i
Altered Peripersonal Space Boundaries in Schizophrenia:
A Virtual Reality Study
By
Hyeon-Seung Lee
Thesis
Submitted to the Faculty of the Graduate School of Vanderbilt University
in partial fulfillment of the requirements for the degree of
MASTER OF SCIENCE in
Psychology August, 7th, 2020 Nashville, Tennessee
Approved:
Sohee Park, Ph.D.
Steven Hollon, Ph.D.
Antonia Kaczkurkin, Ph.D.
ii
TABLE OF CONTENTS
Page
LIST OF TABLES ……….. iii
LIST OF FIGURES ……… iv
1. Introduction ……….. 1
2. Methods ……… 5
2.1 Participants ……… 5
2.2 Psychological assessments ……… 6
2.3 Materials for virtual reality (VR) task ………... 7
2.4 Procedure for the VR for measuring peri-personal space (PPS) ………... 7
2.5 Linear and sigmoid function for PPS task ………. 9
2.6 Data analysis ……… 10
3. Results ……… 12
3.1 Commission error rate and RT analyses ……….. 12
3.2. Computation of PPS variables from tactile RTs ………. 14
3.2.1 Individual goodness of fit (R2) ……….. 14
3.2.2 Tactile RT analyses ………... 14
3.2.3 PPS central point (Xc) and shallowness (b) estimates ……….. 15
3.2.4 Size of the PPS: central point (Xc) ………... 15
3.2.5 Slope of the PPS: shallowness (b) ………. 16
3.3 Relationship between PPS and clinical symptoms ………... 16
4. Discussion ……….. 18
References ………. 24
Appendix ………... 30
iii List of Tables
Table Page
1. Demographic and clinical information of the participants ………... 6
2. Commission error rates (false alarm rates) ………... 12
3. Tactile RT ………... 12
4. Clinical symptom self-report of the participants ………... 17
iv List of Figures
Figure Page
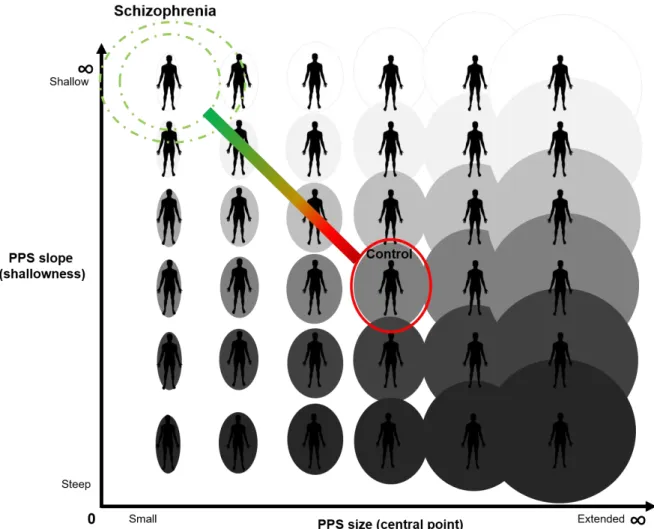
1. Hypothesized Social PPS Size and Slope in Schizophrenia ……….. 5
2. The Schematic Representation of the Procedure ………... 9
3. Comparison of Commission Error Rate between SZ and CO ………. 13
4. PPS Size and Slope Estimates for Social and Non-social Conditions ……… 15
5. Updated Social PPS Size and Slope in Schizophrenia ……… 18
1
1. Introduction
Weakened and porous sense of self has been suggested to be a fundamental feature of
schizophrenia (Bleuler, 1911; Nelson et al, 2012; Sass, & Parnas, 2003). First person accounts are replete with descriptions of body aberrations, loss of bodily self boundary, blurred self-other distinction, and dissociations (e.g., Deegan, 2003; Kean, 2011) and there is robust clinical and empirical evidence for self-disturbances in schizophrenia pathology (e.g., Benson et al., 2019; Brent et al., 2014; Michael, & Park, 2016; Nelson et al., 2012; Raballo & Parnas, 2012; Thakkar et al., 2011). Given that an unstable, incoherent, and inconsistent sense of bodily self in individuals with schizophrenia impairs their capacity to interact with the social world, it is important to understand the source of this problem. Disintegration of self-other differentiation and blurred body boundary can be understood as the phenomenological manifestations of abnormal neural representation of the body in relation to the regions of space that marks the perceptual border between self and others.
This buffer zone is known as the peripersonal space (PPS).
First coined by Rizzolatti and colleagues, PPS refers to the reachable space that surrounds the physical body (Rizzolatti et al., 1981; Rizzolatti et al., 1997; Graziano, & Cooke, 2006). Our subjective experience of bodily self-consciousness with a first-person perspective and capacity for self-other differentiation depends on fast multisensory integration of body-related signals within the PPS (Blanke, & Metzinger, 2009; Blanke, 2012; Blanke et al., 2015; Serino et al., 2018). Since this is the space where we experience direct contact with the external environment, it is not surprising that mechanisms underlying PPS representation play a pivotal role in defining spatial aspects of one’s bodily self-consciousness in the context of social interactions. (Blanke et al., 2015; Cléry et al., 2015; de Vignemont, & Iannetti, 2015).
A specialized cortical system represents the PPS in the brain. Neurophysiological studies of nonhuman primates indicate that PPS is encoded by multisensory neurons in the ventral premotor cortex (Graziano et al., 1997; Rizzolatti et al., 1981) and the posterior parietal cortex (Avillac et al.,
2
2005; Duhamel et al., 1998). In humans, a similar multisensory representation of the PPS has been shown to be mediated by the frontoparietal cortical network (Canzoneri et al., 2012; Serino et al., 2015a; Teneggi et al., 2013; Grivaz et al., 2017).From nonhuman primate studies, it is known that multisensory neurons integrate inputs from tactile stimulation of specific parts of the body (e.g.
hand, face, or trunk) with auditory or visual (i.e., exteroceptive) stimuli when they are presented close to the same body part. The estimated size of the PPS is directly related to the receptive fields of these multisensory neurons (Fogassi et al., 1996; Serino et al., 2015a). However, these neurons do not respond when the exteroceptive stimuli are presented far away beyond the reaching space (Cléry et al., 2015, 2017; Ladavas & Serino, 2008; Macaluso & Maravita, 2010). Thus, it is possible to infer the limits of the self-space from the firing patterns of these neurons in frontoparietal
regions; in other words, such spatially-sensitive coding represents the PPS in the brain (Cléry et al., 2015, 2017).
These findings allow us to leverage the adaptive facilitation of multisensory integration that occurs within the PPS boundary to estimate the extent of the PPS (Canzoneri et al., 2012; Serino et al., 2015a; Teneggi et al., 2013). A typical multisensory method to estimate the PPS noninvasively is as follows. Participants are asked to detect a tactile stimulation (e.g. vibration) delivered to a specific body part as fast as possible. Meanwhile, a task-irrelevant auditory or visual stimulus is presented as approaching the participant. Tactile reaction time (RT) drops rapidly when the auditory or visual stimulus is perceived to be near the body (i.e. entering the PPS). Such facilitation of RT fits better to a sigmoidal function than a linear function. Moreover, the sigmoid function provides size (i.e., central point) and shape (i.e., slope) estimates to better understand the PPS representation (Serino et al., 2015a). Thus, identifying an inflection point where multisensory facilitation occurs can be used to estimate the extent of the PPS (Ferri et al., 2015a,b; Maravita et al., 2003; Serino, 2016). Importantly, PPS representation is malleable and plastic, depending on the types of environment or interaction. Individual differences in anxiety (Sambo & Iannetti, 2013),
interoceptive accuracy (Ardizzi, & Ferri, 2018) as well as types of interaction (Bufacchi, & Iannetti,
3
2018; Ferri, et al., 2015a; Pellencin et al., 2018; Serino, 2019; Teneggi et al., 2013) have all been shown to modify PPS.
The relevance of PPS to self-disturbances of schizophrenia is evident. Difficulties in
distinguishing self from other, loss of body ownership as well as a wide range of body aberrations suggest that individuals with schizophrenia (SZ) experience blurred self-other boundary (e.g.
Chapman et al., 1978). Such uncertainty about the space between self and others or self-other distinction can be represented by variations in the extent of the PPS gradients (Noel et al, 2017).
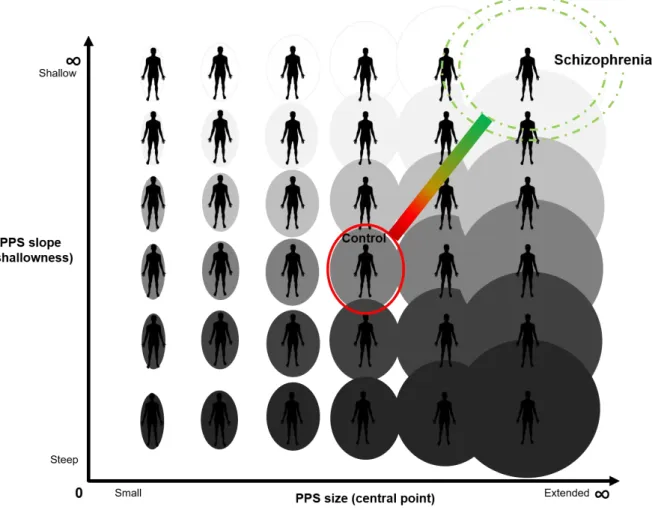
PPS in SZ is hypothesized to be extended gradually between self and other such that there is increased uncertainty about the self boundary across a broader expanse of interpersonal space than in control participants (See Figure 1). In other words, SZ may be unsure of where the self ends and the other begins within a larger volume of interpersonal space than healthy controls (CO).
There is some empirical evidence to support this view from studies of preferred interpersonal distance (Hayduk, 1983), which is closely related to PPS (Cartaud et al., 2018; Quesque et al., 2017). Abnormally extended preferred interpersonal distance has been demonstrated in individuals with schizophrenia (Deus, & Jokic-Begic, 2006; Duke, & Mullens, 1973; Holt et al., 2015;
Horowitz et al., 1964; Park et al., 2009; Penn et al., 2000). Furthermore, Delevoye-Turrell and colleagues (2011) estimated PPS in SZ and CO by asking participants to indicate when an
exteroceptive stimulus (objects or people) entered or exited their reaching space. The extent of the PPS in SZ was much more variable than that of CO. In other words, the boundary between peri- and extra-personal space in SZ seemed to be less well defined (i.e., “shallower” gradient of PPS), or more variable on a trial-by-trial basis than in CO. This increased variability was correlated with the severity of disorganization symptoms in the patients. However, in other studies, the extended preferred interpersonal distance was associated with the severity of negative symptoms (Nechamkin et al., 2003; Park et al., 2009; Holt et al., 2015) so the relationship between symptoms and PPS remain unclear from these studies, whilst they are concordant on the notion of extended PPS in schizophrenia. In contrast, there is empirical support for the hypothesis that PPS is shrunken or
4
contracted in SZ (Di Cosmo et al., 2018; Veling et al., 2014). For instance, Di Cosmo and colleagues (2018) investigated auditory-tactile PPS in SZ and found that PPS representation was narrower and the gradient between the self and other was steeper in this population. It is possible that the discrepancy between these results may stem from methodological differences but the reason for these contradictory results is unknown. Nevertheless, all of these studies point to abnormal or altered PPS in SZ.
Why is abnormal PPS clinically important? If PPS representation is altered in SZ, this might lead to abnormal social behavior. It has been shown that abnormal self-other boundary can
adversely affect social self-awareness, which is in turn, is associated with poor functional outcome (Nelson et al., 2012; Parnas, & Handest, 2003; Sass, & Parnas, 2003). Preference for extended or farther interpersonal distance in SZ especially under socially stressful conditions (Veling et al., 2014, Geraets et al., 2018) may be indicative of the heightened sensitivity to threatening or over- arousing stimuli in the environment (Collip et al., 2011; Haralanova et al., 2012; Kapur, 2003; Kim et al., 2011).
The present study aimed to investigate 1) whether the width (size) and the gradient (slope) of the PPS are altered in schizophrenia. Moreover, we sought to examine 2) the potential effect of social context on PPS parameters by simulating the social and nonsocial environment in virtual reality utilizing a visuo-tactile paradigm adapted from Serino et al. (2018). We hypothesized that PPS estimates would not differ between SZ and CO in non-social environment whereas the PPS of patients and controls diverge when interacting with a social partner, based on past research that points to abnormal processing of social versus nonsocial stimuli in schizophrenia (see Kim et al, 2011). Lastly, past research also points to the negative impact of social isolation on bodily self aberrations and social information processing (see Michael, & Park, 2016; Benson, & Park, 2019).
Therefore, we examined 3) the relationship between perceived social isolation and PPS.
5
Fig. 1 Hypothesized Social PPS Size and Slope in Schizophrenia
2. Methods
2.1 Participants
Twenty-four SZ were recruited from a community mental health center in Nashville, TN.
All SZ were taking antipsychotic medication. Twenty-five demographically matched CO were recruited from the same community. The Structured Clinical Interview for DSM-5 (SCID-5RV;
First et al., 2015) was administered to verify the diagnosis of SZ and to confirm that CO had no history of DSM-5 disorders. Exclusion criteria for both groups were 1) history of head injury or
6
seizures, 2) neurological diseases, 3) substance use or abuse, 4) estimated IQ below 85, or 5) the goodness of fit for sigmoid function in the PPS measure is very low (R2 < .5). Data from one CO participant was excluded because the goodness of fit was very low (R2 < .3). Finally, data from twenty-four SZ and twenty-four CO were analyzed for the study. All participants provided written informed consent prior to assessment and were paid after completing all the study procedures, as approved by the Vanderbilt Institutional Review Board. Demographic and clinical information is summarized in Table 1.
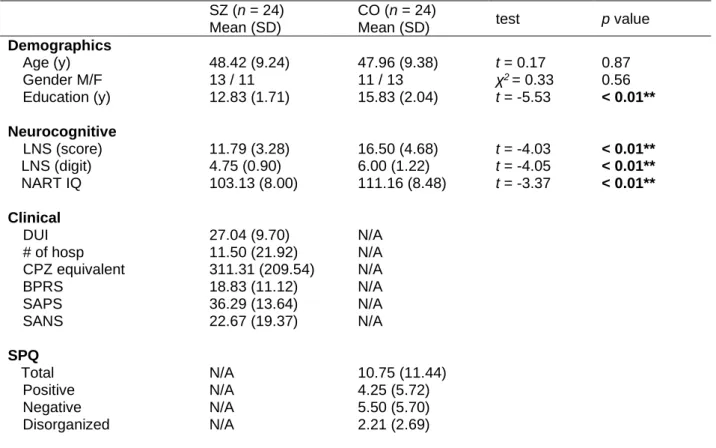
Table 1. Demographic and clinical information of the participants
SZ (n = 24) Mean (SD)
CO (n = 24)
Mean (SD) test p value
Demographics
Age (y) 48.42 (9.24) 47.96 (9.38) t = 0.17 0.87
Gender M/F 13 / 11 11 / 13 χ2 = 0.33 0.56
Education (y) 12.83 (1.71) 15.83 (2.04) t = -5.53 < 0.01**
Neurocognitive
LNS (score) 11.79 (3.28) 16.50 (4.68) t = -4.03 < 0.01**
LNS (digit) 4.75 (0.90) 6.00 (1.22) t = -4.05 < 0.01**
NART IQ 103.13 (8.00) 111.16 (8.48) t = -3.37 < 0.01**
Clinical
DUI 27.04 (9.70) N/A
# of hosp 11.50 (21.92) N/A
CPZ equivalent 311.31 (209.54) N/A
BPRS 18.83 (11.12) N/A
SAPS 36.29 (13.64) N/A
SANS 22.67 (19.37) N/A
SPQ Total
Positive
N/A N/A
10.75 (11.44) 4.25 (5.72)
Negative N/A 5.50 (5.70)
Disorganized N/A 2.21 (2.69)
* LNS (score): a total score of a Letter Number Sequencing subtest of WAIS-IV; LNS (digit): the number of digits in LNS with at least one correct answer; NART: the North American Adult Reading Test; DUI:
duration of illness; # of hosp: the number of hospitalization; CPZ: chlorpromazine equivalent dose (mg/kb/day; BPRS: the Brief Psychiatric Rating Scale; SAPS: the Scale for the Assessment of Positive Symptoms; SANS: the Scale for the Assessment of Negative Symptoms; SPQ: the Schizotypal Personality Questionnaire;
7
2.2 Psychological assessments
For SZ, the Brief Psychiatric Rating Scale (BPRS; Overall, & Gorham, 1962), the Scale for the Assessment of Positive Symptoms (SAPS; Andreasen, 1984), and the Scale for the Assessment of Negative Symptoms (SANS; Andreasen, 1989) were conducted to assess the severity of their current symptoms. For CO, the Schizotypal Personality Questionnaire (SPQ; Raine, 1991) was administered to assess schizotypy. In addition to symptom ratings, the Green Paranoid Thought Scale (GPTS) was given to all participants to measure the self-reported social idea of reference and persecution (Green et al., 2008). A revised version of GPTS with psychometrical validation
(Freeman et al., 2019) was used in the current study. To measure the life-time experiences of bodily self-disturbances, the Body Disturbance Inventory (BODI; Benson et al., 2019) was administered.
The BODI assesses the endorsement, frequency, distress, and vividness of the disturbances. For measuring perceived social isolation, the UCLA Loneliness Scale (Russell, 1996) was used.
Intelligence was estimated using the North American Adult Reading Test, Revised (NART;
Blair, & Spreen, 1989). The Letter Number Sequencing (LNS) subtest of the Wechsler Adult Intelligence Scale (WAIS-IV; Wechsler, 2008) was used to assess participants’ working memory.
2.3 Materials for virtual reality (VR) task
Participants were asked to put on a headset (HTC Vive; 2160 x 1200, 1080 x 1200 per eye, FOV 110◦ diagonally) and use two handheld controllers to make responses. A body belt and shoes with wireless sensors were used to track participants’ movement and body location. Two base station cameras and the Steam VR software (The Valve Corporation) captured signals from the aforementioned wearable devices. Then, by the calibration of Orion software (The IKINEMA) the movement of the participant’s body was matched to the movement of an avatar that represented the participant. This self-avatar was placed into a pre-designed virtual environment similar to a
8
classroom. The presentation of all stimuli and recording of responses were implemented by Unity software (The Unity Technologies).
2.4 Procedure for the VR task for measuring peri-personal space (PPS)
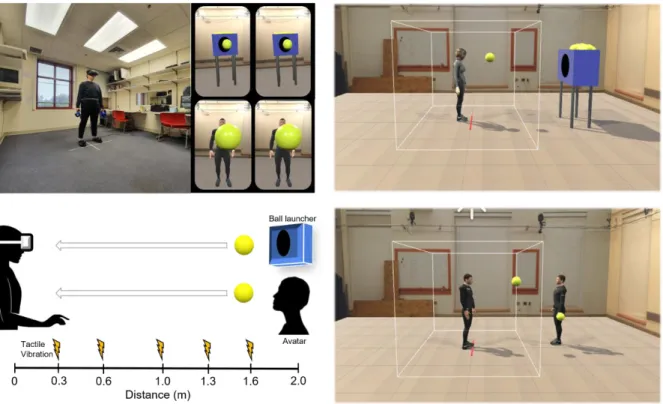
An immersive virtual reality (VR) task was used to estimate PPS boundaries. A well- established visuo-tactile procedure (Pellencin et al., 2018) was administered to incorporate the visual context of social interactions.
After completing the informed consent procedure, symptom interviews, and psychological assessments, participants were given instructions for the experimental procedure for the PPS task.
Before starting the PPS task, participants were asked to stand at the center of the room marked by red tape and put VR tracker devices on their heads, bodies, and feet. Then the experimenter ran the Steam VR software to check the signal strength on eight sensors (i.e., a headset, a belt, two hand controllers, shoes, and two base station cameras). Then participants were asked to press a trigger on a hand controller to be calibrated to the self-avatar. Participants were then placed into the VR environment and given some time to familiarize themselves. They were instructed not to move from the red tape during the PPS task at the center of the VR environment, in order to maintain the same distance to the ball for each trial. After practice trials, the experiment began.
Each trial consisted of participants watching a moving ball thrown by either a ball launcher (i.e., non-social condition) or an avatar that represented another person (i.e., social condition) while detecting a tactile stimulus on their hand. The ball approached the participant with a constant velocity of 75cm/sec, reflecting the average human walking speed (Canzoneri et al., 2012) and was presented for 2,600ms. In between trials, 2,000ms of the fixation period was given. The distance between a participant and a ball thrower (either a machine or the other-avatar) was 2m. While observing the ball moving towards them, participants received a tactile target stimulus when the ball was at given distances (D1 = 0.3m, D2 = 0.6m, D3 = 1m, D4 = 1.3m, D5 = 1.6m) in a random
9
sequence. Participants were required to respond to the tactile vibration as fast as possible, by pulling the trigger on their handheld controller. Participants completed 100 trials (50 trials per social and non-social conditions). The order of presentation of those experimental conditions was
counterbalanced in both SZ and CO groups.
Unlike the previous study (Pellencin et al., 2018) in which a ball kept moving even after reaching the participant, the ball disappeared immediately when the participant pulled the trigger to indicate the detection of tactile vibration. Thus, if a participant pulled a trigger before the vibration was given, this was recorded as a commission error. The error rate was compared between SZ and CO, and between social and non-social conditions to find whether there is a difference in false alarm rates.
Fig. 2 The Schematic Representation of the Procedure
10
2.5 Linear and sigmoid function for PPS task
Mean reaction time (RT) to given tactile targets were collected at different distances (D1- D5). The RT data were fitted to both a linear and a sigmoid function (Canzoneri et al., 2012; Serino et al., 2015b; Di Cosmo et al., 2018; Pellencin et al., 2018) to see whether the performance of either group (i.e., CO and SZ) was better fitted to the sigmoid function than to the linear function. The equation 𝑦(𝑥) = 𝑦0 + 𝑘 ∗ 𝑥 was used for the linear function, and 𝑦(𝑥) = 𝑦𝑚𝑖𝑛+𝑦𝑚𝑎𝑥∗𝑒(𝑥−𝑥𝑐)/𝑏
1+ 𝑒(𝑥−𝑥𝑐)/𝑏
was used for the sigmoid function. In both, x represents the distance point at which tactile vibration is delivered (i.e., independent variable) and y represents predicted RT (i.e., dependent variable).
For the sigmoid function, the ymin and ymax values were individually assigned a priori as parameters. The values denote the minimum and maximum RT of each individual data set, respectively saturated at the lower and upper levels of the sigmoid (Canzoneri et al., 2012; Di Cosmo et al., 2018, Pellencin et al., 2018). However, xc and b are not fixed parameters; both change according to the shape of the sigmoid. xc is the value of the abscissa where 𝑦 = (𝑦𝑚𝑖𝑛 + 𝑦𝑚𝑎𝑥)
2 ,
which is equivalent to the central point of the sigmoid, estimating PPS size (Serino et al., 2015a,b).
b represents the slope of the sigmoid at the central point, reflecting the degree of facilitation effect in RT from far to close; this estimate can be considered as a measure of how clearly the PPS
boundary is defined (Noel et al., 2017). Unlike the central point, the slope estimate is inverted in the formula. Therefore, the larger b value represents the shallower (i.e., unclear, fuzzy, or flexible) the boundary, and vice-versa.
It should be noted that previous studies with the audio-tactile version used elapsed time as an independent variable (𝑥), and thus greater xc and b values indicated smaller PPS central point and steeper shape of boundary, respectively (e.g., Di Cosmo et al., 2018). However, since this study used a distance from a participant to an object as an independent variable, greater xc value means
11
greater PPS central point and greater b value means shallower gradient of the boundary (Serino et al., 2018; Noel et al., 2018a).
To find the optimal xc and b values for the sigmoid function, the Generalized Reduced Gradient (GRG) nonlinear option developed by Leon Lasdon and Allan Waren and incorporated in the excel (Microsoft) solver add-on was used. The add-on helped to find the values that minimize the mean squared error (MSE) value by iterating various values. To evade a situation in which the iteration is stopped at the misleading values, the multiple starting point option (i.e., Multistart option) was adopted (Bermudez et al., 2006; Ravinder, 2013).
2.6 Data analysis
First, to see if there were any behavioral differences, we examined false alarms represented by the commission error rate (i.e., the percentage of the number of trials that participants pressed the trigger before the vibration). MANOVA on the commission error rate with one between variable (diagnosis; SZ vs. CO) and one within variable (conditions; social vs. non-social) were conducted to examine the difference between diagnosis and conditions.
Then, to compare the goodness of fit of both linear and sigmoid function, the R-square value was used. This value shows the proportion of the total variance in observed RTs explained by the function. The value ranges from 0 to 1, and a higher value represents better fitting or prediction.
A dependent t-test was conducted for each condition’s mean R-square value to evaluate which function (i.e., linear vs. sigmoid) has better fitting. For between-group comparison (i.e., SZ vs. CO), An independent t-test was conducted.
In addition, repeated measures MANOVA was conducted to investigate the effects of condition and diagnosis on the RTs. Diagnosis (SZ vs. CO) was included as a between-subject factor, and experimental condition (social vs. non-social) and distance (D1-D5) as within-subject factors in the analyses. Due to the high correlation between RTs in near distances (e.g., RT for D1 is
12
more correlated with RT for D2 than others), the sphericity assumption was not met. Thus, Greenhouse-Geisser correction was applied.
Finally, MANOVA on PPS estimates (i.e., the central point, xc; and the slope, b) were conducted respectively to compare PPS boundaries between groups or conditions. After examining the main effects and interactions, contrast analyses were followed to test the specific PPS
differences in SZ and CO.
Lastly, correlational analyses were conducted to explore the possible link between PPS estimates and clinical or psychological variables.
13 3. Results
3.1. Commission error rate and RT analyses.
Mean and standard deviations of the errors and RTs are presented in Tables 2 and 3.
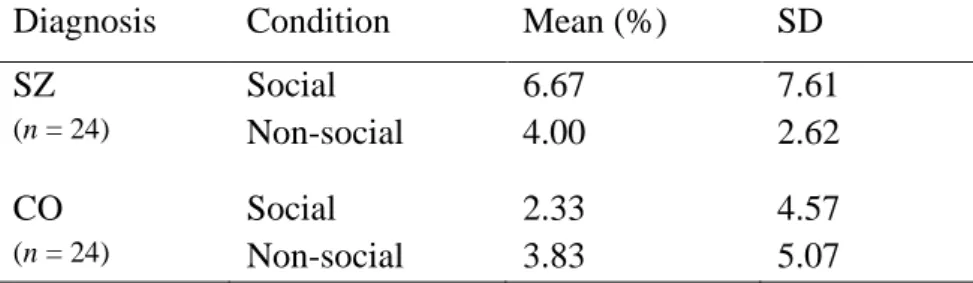
Table 2. Commission error rates (false alarm rates)
Diagnosis Condition Mean (%) SD
SZ Social 6.67 7.61
(n = 24) Non-social 4.00 2.62
CO Social 2.33 4.57
(n = 24) Non-social 3.83 5.07
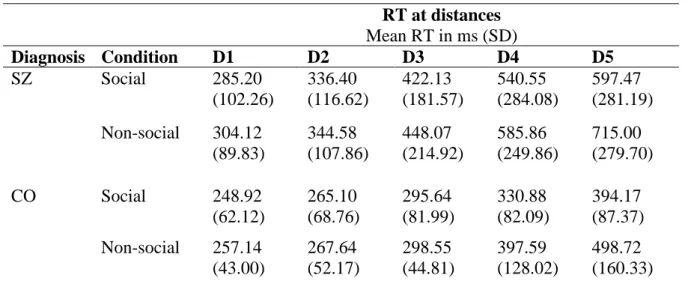
Table 3. Tactile RT
RT at distances Mean RT in ms (SD)
Diagnosis Condition D1 D2 D3 D4 D5
SZ Social 285.20
(102.26)
336.40 (116.62)
422.13 (181.57)
540.55 (284.08)
597.47 (281.19) Non-social 304.12
(89.83)
344.58 (107.86)
448.07 (214.92)
585.86 (249.86)
715.00 (279.70)
CO Social 248.92
(62.12)
265.10 (68.76)
295.64 (81.99)
330.88 (82.09)
394.17 (87.37) Non-social 257.14
(43.00)
267.64 (52.17)
298.55 (44.81)
397.59 (128.02)
498.72 (160.33)
* D1 = 0.3m, D2 = 0.6m, D3 = 1m, D4 = 1.3m, D5 = 1.6m
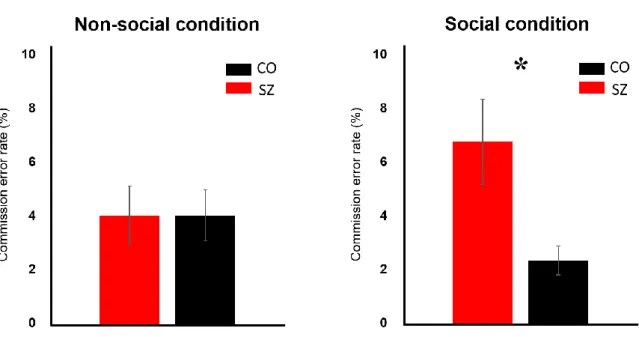
The commission error rate is defined as the percentage of the number of trials that participants pressed the trigger before the vibration (Figure 3) and thus, it represents the false alarm rate. Commission errors may indicate a hyper-anticipatory state of the participants who were expecting the ball coming into their personal boundary. There was a significant effect of diagnosis (F 1, 46 = 3.95, p < .05*) such that the commission error rate was higher in SZ than
14
CO regardless of conditions. There was no significant main effect of condition (F 1, 46 = .33, p
= .57) indicating that the error rate did not differ between social and non-social conditions.
The following paired-t test on commission error rate reassured a nonsignificant condition’s own effect for both SZ (t 23 = 1.66, p = .11) and CO (t 23 = -1.20, p = .24*).
However, there was a significant interaction of diagnosis and condition (F 1, 46 = 4.20, p = .04*). The following separate analyses showed that the commission error rate in SZ (M = 6.67%, SD = 7.61) was significantly higher than that of CO (M = 2.33%, SD = 4.57) in social condition (F 1, 46 = 6.95, p = .011*) but not in nonsocial condition (F 1, 46 = .01, p
= .91). Interpersonal context of the social condition affects the SZ group such that they anticipate the ball to enter their PPS faster when a person throws it at them than when a machine throws it. It is not clear whether this result reflects increased anxiety in the patient group when confronted with another person or a change in the PPS boundary in relation to the social nature of the condition.
* Error bar: +/- SE (standard error)
Fig. 3 Comparison of Commission Error Rate between SZ and CO
15
3.2. Computation of PPS variables from tactile RTs
3.2.1 Individual goodness of fit (R2)
For both social and non-social conditions, sigmoid function (mean R2 > .90) exhibited significantly better fit than Linear function (mean R2 < .85). The better fit of the sigmoid function was observed in both SZ and CO groups, while there was no significant difference between fits of CO and SZ (See supplementary material 1). These results suggest that sigmoid function better predicts reaction time changes in the PPS experiment than linear function, regardless of participant group or experimental conditions.
3.2.2 Tactile RT analyses
There was a significant main effect of diagnosis (F 1, 46 = 16.35, p < .001***) on the tactile RT. SZ were slower than CO, regardless of distances and social conditions. There was a significant main effect of the condition such that mean RTs in the social condition were faster than nonsocial conditions (F 1, 80.50 = 7.16, p = .01**). There was a significant effect of distance (F 1.98, 80.50 = 78.68, p < .001***) such that the tactile RT was significantly different across the five distances, regardless of diagnosis or condition (see figure 4).
There were significant two-way interactions. Distance-by-Diagnosis interaction was significant (F 1.98, 80.50 = 8.20, p < .001***) such that RTs were more starkly changed
(facilitated) across the five distances in SZ group than CO. There was also a significant interaction of distance and condition (F 1.75, 80.50 = 6.20, p < .01**) such that the RTs for the social condition were changed more markedly than non-social condition.
There was no significant three-way interaction (F 1.75, 80.50 = .22, p = .77).
16
3.2.3 PPS central point (Xc) and shallowness (b) estimates
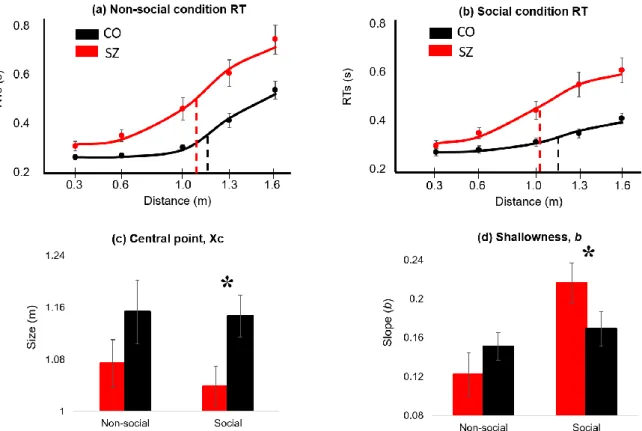
We then computed the central point (Xc) and Slope (b) variables for SZ and CO for social and nonsocial conditions. The following (Figure 4) represents the PPS central point (size of the PPS) and the shallowness of the PPS (slope) for social and non-social condition
* (a) RT changes in distances in nonsocial condition; (b) RT changes in distances in social condition; For (a) and (b), dashed line indicates central point (red for SZ and black for CO); (c) central point values between conditions; (d) shallowness values between conditions; Error bar: +/- SE (standard error)
Fig. 4 PPS Size and Slope Estimates for Social and Non-social Conditions.
3.2.4 Size of the PPS: central point (Xc)
There was a significant main effect of diagnosis (F 1, 46 = 4.82, p = .03*) such that PPS size was smaller in SZ than in CO overall. There was no significant main effect of condition (F 1, 46 = .40, p = .53) and no significant interaction of diagnosis and condition (F 1, 46 = .20, p = .66). Even though the diagnosis-by-condition interaction was not significant, we note that PPS size in SZ (M = 1.04m, SD = .16) was significantly smaller than CO (M =
17
1.15m, SD = .15) in the social condition (F 1, 46 = 5.90, p = .019*) but not in nonsocial condition (F 1, 46 = 1.67, p = .20).
3.2.5 Slope of the PPS: shallowness (b)
There was no main effect of diagnosis (F 1, 46 = .42, p = .52) on the PPS slope but the main effect of condition (F 1, 46 = 9.29, p = .004**), and the interaction of diagnosis and condition (F 1, 46 = 6.02, p = .018*) were significant. For both SZ and CO, social condition appears to increase the shallowness of the slope, but this effect is much more pronounced for SZ. SZ exhibited PPS slope comparable to CO in the non-social condition (F 1, 46 = 1.16, p
= .29) but they showed significantly shallower boundary (mean slope = .22, SD = .09) than CO (mean slope = .16, SD = .10) in the social condition (F 1, 46 = 4.29, p = .04*). This finding suggests that under the interpersonal context, self-boundary of SZ becomes shallow or
extremely ill-defined.
3.3 Relationship between PPS and clinical symptoms
Correlation analyses were conducted to investigate the possible link between PPS estimates (i.e., size or slope variables) and clinical or psychological factors. The severity of symptoms in SZ and psychosis-proneness in CO were expected to play a role in self-other boundary, especially signs that indicate bodily self aberrations and paranoia. However, PPS size and slope were not significantly correlated with clinical symptoms in SZ (Supplementary material 4) and schizotypy in CO (Supplementary material 5).
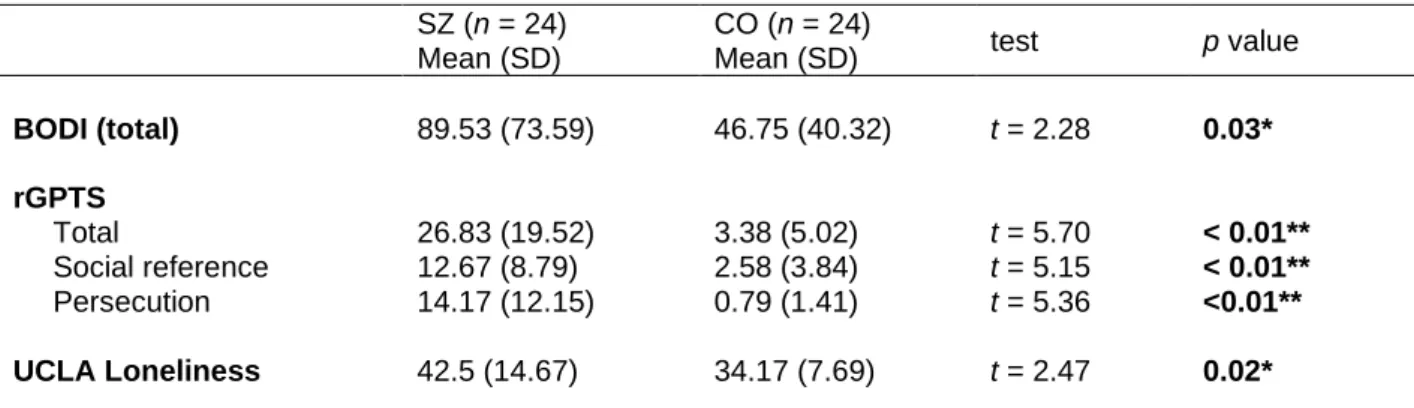
Although there were significant group differences in phenomenological measures of bodily self disturbances measured by the BODI (t = 2.28 and p = .03*), the degree of
18
paranoia (t = 5.70 and p < .01**) and loneliness (t = 2.47 and p = .02*), PPS estimates were not correlated with BODI, rGPTS or UCLA loneliness (supplementary material 4, 5).
Table 4. Clinical symptom self-report of the participants
SZ (n = 24) Mean (SD)
CO (n = 24)
Mean (SD) test p value
BODI (total) 89.53 (73.59) 46.75 (40.32) t = 2.28 0.03*
rGPTS Total
Social reference Persecution
26.83 (19.52) 12.67 (8.79) 14.17 (12.15)
3.38 (5.02) 2.58 (3.84) 0.79 (1.41)
t = 5.70 t = 5.15 t = 5.36
< 0.01**
< 0.01**
<0.01**
UCLA Loneliness 42.5 (14.67) 34.17 (7.69) t = 2.47 0.02*
* rGPTS: the revised Green Paranoid Thought Scale; BODI: the Body Disturbance Inventory;
However, there were interesting correlations between hallucinations and PPS shallowness in the social condition such that steep PPS boundary was associated with more severe hallucination symptoms (r = -.47, p = .02*).
In non-social PPS, the reduced boundary of SZ was associated with high loneliness (r
= -.46, p = .03*) and negative symptom such as anhedonia and asociality (r = -.51, p < .01**).
19
5. Discussion
The main goal of the present study was to examine the spatial aspect of the self in schizophrenia in order to further understand the nature of self disturbances in this disorder.
The concept of the PPS allows for a systematic investigation of the self-other boundary in relation to changing social environment around the self. The present study utilized a visuo- tactile reaction time task in virtual reality to estimate the size and the slope of the PPS, which reflects the extent of the uncertainty of the self-other boundary.
Fig. 5 Updated Social PPS Size and Slope in Schizophrenia
20
Given the importance of social context in self processing, we expected that the PPS variables in both groups to change in response to social interaction based on past findings (see Noel et al, 2015, 2017). Further, we hypothesized that in social condition, SZ would have a larger PPS size and a shallower slope than CO. However, our results indicate a smaller PPS size and shallower slope of PPS in SZ compared with CO in social environment. We interpret these findings to suggest that despite the nearness of the perceived self-boundary, there is much uncertainty about the location of this border between self and other such that the PPS slope extends out far from the body location (see Figure 5).
We first asked whether the social nature of interaction would modify the participant’s response toward the external stimuli. We observed that the social condition tended to elicit more commission errors in SZ, which may indicate a breakdown of multisensory integration under increased anticipation. When a virtual ball comes close, a person may expect the possible contact (Clery et al., 2015; Kandula et al., 2015) from the ball in the near future, and prepare for one’s action toward it (e.g., a catch) (Brozzoli, et al., 2012, 2014; Bufacchi, &
Iannetti, 2018; Cardellicchio et al., 2013; Fini et al., 2014). The presence of a social other might influence the prediction of the ball’s velocity, due to an expectation of negative consequences of bodily contact in the social condition (de Haan et al., 2016; Noel et al., 2018b). It is also possible that generally increased commission errors in SZ reflect executive function deficits including working memory deficit, a hallmark of schizophrenia (e.g., Park and Gooding, 2014). Beyond the frontoparietal networks (Grivaz et al., 2017), PPS
processing has also been associated with the prefrontal cortex (Noel, & Serino, 2019) which supports executive functions.
Simulation of social interaction yielded different size and slope of the PPS in SZ compared with CO. Firstly, significantly smaller PPS boundary was observed in SZ than CO in the social condition, while such difference was not observed in non-social condition. The
21
presence of social other made meaningful alterations of PPS size only in SZ, but not in CO.
Though previous studies with preferred interpersonal distance paradigm showed extended or variable personal space in SZ (e.g., Delevoye-Turrell et al., 2011; Holt et al., 2015), reduced personal space was also reported in past studies using a VR based social interaction paradigm (Veling et al., 2014) or audio-tactile PPS paradigm (Di Cosmo et al., 2018). It is possible that different paradigms might be tapping into different self-other boundary systems. The
interpersonal distance paradigm measures ‘safe zone’ where people are reluctant to be intruded, while PPS paradigm reflects the need to protect the body from potentially harmful stimuli (Graziano & Cooke, 2006; Makin, et al., 2009; Sambo et al., 2012), or the capacity to promote goal-directed behaviors (Bufacchi, & Iannetti, 2018; Fini et al., 2014; de Vignemont
& Iannetti, 2014). Perhaps, diminished PPS boundary implies that SZ were reluctant to interact with the social partner.
Our results indicate that SZ exhibit shallower PPS slope than CO, especially in the social condition. Thus, individuals with SZ seem to experience a more diffuse and uncertain boundary between self and the outside world. This finding is consistent with the prior
literature bridging the gap between an incoherent multisensory processing and abnormal self- experiences in SZ (Park & Nasrallah, 2014; Postmes et al., 2014; Sass, & Parnas, 2003).
However, Di Cosmo and colleagues (2018) found a steeper PPS slope in SZ than CO, suggesting a clear distinction between the self and other. It should be noted that there are important differences between our paradigm and the audio-tactile paradigm task used by Di Cosmo et al. (see Canzoneri et al, 2012), which incorporated an intensity-increasing ‘pink’
noise as a stimulus to denote a looming sound. The auditory system is very sensitive for detecting and orienting quickly to potential threats (Ferri et al., 2015b). Thus, the more a participant processed the looming sound as imminent or potentially negative, the faster they would respond to the tactile vibration near the PPS boundary. Such behavioral pattern could
22
lead to a stark difference between the self-other boundary and this is reflected in a steeper slope of the PPS. In contrast, we used a visuo-tactile pairing which elicits relatively slower orienting behavior but with greater spatial acuity than auditory-tactile paring. Also, the visuo- tactile task in VR allows for a more realistic simulation of the social environment (i.e., a ball catching with either a ball launcher or an avatar). Taken together, our finding of shallower social PPS in SZ does not necessarily conflict with the previous finding by Di Cosmo et al., given the differences in the paradigms. Both steeper and shallower slope of PPS boundary suggest disturbed self in SZ, either hyperreflexive or diminished self affection (Nelson et al., 2012; Parnas, & Handest, 2003; Sass, & Parnas, 2003).
The PPS size and shape estimates were not directly related to overall positive or negative symptoms in SZ, and psychosis-proneness in CO. Also, bodily self abnormalities and paranoia were not associated with PPS variables. One possible explanation for these results is that unlike previous studies (Di Cosmo et al., 2018; Holt et al., 2015; Park et al., 2009), participants in the current study were older and had a greater duration of illness. Self disturbances are clearly evident in the pre-morbid and prodromal stages of psychosis and predict the future onset (Chapman et al., 1978; Nelson et al., 2012; Parnas, & Handest, 2003;
Sass, & Parnas, 2003). Thus, though self disturbances are phenomenologically salient and empirically observable in chronic stages of SZ, the association between the self disturbances and clinical symptoms may be weakened due to the long duration of illness, having
secondary symptoms, long-term treatment effects, various coping mechanisms, and remissions (Parnas, & Handest, 2003; Sass, & Parnas, 2003).
Interestingly, however, there was a positive correlation between hallucination and the steep gradient of social PPS boundary. It has been suspected that complex schizophrenia symptoms such as delusion and hallucination may arise from perceptual incoherence (Postmes et al., 2014; Stanghellini et al., 2019) but it has not been clear how the size and
23
shape of the PPS would be associated with the severity of hallucinations. In healthy subjects, Noel and colleagues (2018a) found that the brief period of audio-visual deprivation leads to a shallower representation of PPS and an increased tendency to report hallucination or self- disorganization (e.g., being lost in space). In contrast, we found that in SZ patients, the steeper slope of PPS was associated with increased hallucinatory experiences. These findings underscore the point that the relationship between PPS variables and clinical symptoms is not linear nor simple.
PPS size in the nonsocial condition was associated with high levels of loneliness and negative symptom in SZ. Presumably, increased loneliness and negative symptoms indicate reduced levels of social interactions in these participants. Consistently, diminished PPS size has been assumed to reflect an unwillingness to interact with the external environment (Teneggi et al., 2013, Pellencin et al., 2018).
There are several limitations to the present study. The adjustment of RT using baseline performance was not applied to the current study. Some previous studies subtracted the fastest RT in unimodal (i.e., visual, or tactile only) trials from the mean raw RT to pose the most conservative way to find the facilitation effect solely from the multisensory
processing and reduce the temporal expectancy effect (Kandula et al., 2017; Pellencin et al., 2018; Serino et al., 2018). However, the present study was an explorative study aiming at maximizing the power. It is also unknown how unimodal processing in different groups might affect to the malleability of PPS representation. Therefore, previous studies with between-group design did not involve a baseline correction (e.g., Di Cosmo et al., 2018; Mul et al., 2019). Instead, to reduce the temporal expectancy effect, the present study changed a ball to disappear right after the participants’ response, and participants’ reaction before vibration (i.e., false firing) was recorded as commission error to be ruled out for the main analyses. In addition, the current study examined peri-hand PPS. Though the study’s
24
paradigm is most relevant to hand-related action (i.e., a ball catch), and there is evidence that the change of PPS is not completely separate between different body parts (Serino et al., 2015a), the malleability of social PPS representation in SZ needs to be replicated testing different body parts such as a trunk, face, and full-body.
Despite these limitations, the present study was the first to investigate the anomalous social PPS representation in SZ. The use of immersive VR allowed us to simulate the social and nonsocial environment. Our findings indicate that PPS is plastic with respect to the social environment and that an altered experience of the self-other boundary in SZ depends partly on the nature of the environment surrounding the self.
25 References
Andreasen, N. C. (1984). Scale for the assessment of positive symptoms (SAPS). Group, 17(2), 173-180.
Andreasen, N. C. (1989). The Scale for the Assessment of Negative Symptoms (SANS):
conceptual and theoretical foundations. The British Journal of Psychiatry, 155(S7), 49-52.
Ardizzi, M., & Ferri, F. (2018). Interoceptive influences on peripersonal space boundary. Cognition, 177, 79-86.
Avillac, M., Deneve, S., Olivier, E., Pouget, A., & Duhamel, J. R. (2005). Reference frames for representing visual and tactile locations in parietal cortex. Nature Neuroscience, 8(7), 941-949.
Benson, T. L., Brugger, P., & Park, S. (2019). Bodily self‐disturbance in schizophrenia‐
spectrum populations: Introducing the Benson et al. Body Disturbances Inventory (B‐
BODI). PsyCh Journal, 8(1), 110-121.
Benson, T. L., & Park, S. (2019). Increased plasticity of bodily self-experience in individuals who may carry latent liability for schizophrenia. Schizophrenia Research, 207, 58-62.
Bermudez, J.D., Segura, J.V., & Velcher, E. (2006). Improving Demand Forecasting Accuracy Using Nonlinear Programming Software. Journal of the Operational Research Society, 57, 94-100.
Blanke, O., & Metzinger, T., (2009). Full-body illusions and minimal phenomenal selfhood.
Trends in Cognitive Sciences 13, 7–13.
Blanke, O. (2012). Multisensory brain mechanisms of bodily self-consciousness. Nature Reviews Neuroscience, 13(8), 556-571.
Blanke, O., Slater,M., & Serino, A., (2015). Behavioral, neural, and computational principles of bodily self-consciousness. Neuron, 88, 145–166.
Blair, J. R., & Spreen, O. (1989). Predicting premorbid IQ: a revision of the National Adult Reading Test. The Clinical Neuropsychologist, 3(2), 129-136.
Bleuler, E., (1911). Dementia Praecox oder gruppe der Schizophrenien. In: Aschaffenburg, G.
(Ed.), Handbuch der Psychiatrie. Spezieller Teil, 4. Abteilung, 1. Hälfte. Deuticke, Leipzig.
Brent, B.K., Seidman, L.J., Thermenos, H.W., Holt, D.J., & Keshavan, M.S. (2014).
Selfdisturbances as a possible premorbid indicator of schizophrenia risk: A neurodevelopmental perspective. Schizophrenia Research, 152(1), 73–80.
Brozzoli, C., Gentile, G., & Ehrsson, H. H. (2012). That's near my hand! Parietal and
premotor coding of hand-centered space contributes to localization and self-attribution of the hand. Journal of Neuroscience, 32(42), 14573-14582.
26
Brozzoli, C., Ehrsson, H. H., & Farnè, A. (2014). Multisensory representation of the space near the hand: from perception to action and interindividual interactions. The
Neuroscientist, 20(2), 122-135.
Bufacchi, R. J., & Iannetti, G. D. (2018). An action field theory of peripersonal space. Trends in Cognitive Sciences, 22(12), 1076-1090.
Canzoneri, E., Magosso, E., & Serino, A. (2012). Dynamic sounds capture the boundaries of peripersonal space representation in humans. PloS one, 7(9) e44306.
Cardellicchio, P., Sinigaglia, C., & Costantini, M. (2013). Grasping affordances with the other's hand: A TMS study. Social Cognitive and Affective Neuroscience, 8(4), 455-459.
http://dx.doi.org/10.1093/scan/nss017.
Cartaud, A., Ruggiero, G., Ott, L., Iachini, T., & Coello, Y. (2018). Physiological response to facial expressions in peripersonal space determines interpersonal distance in a social
interaction context. Frontiers in Psychology, 9, 657.
Chapman, L. J., Chapman, J. P., & Raulin, M. L. (1978). Body-image aberration in schizophrenia. Journal of Abnormal Psychology, 87(4), 399-407.
Cléry, J., Guipponi, O., Wardak, C., & Hamed, S. B. (2015). Neuronal bases of peripersonal and extrapersonal spaces, their plasticity and their dynamics: knowns and
unknowns. Neuropsychologia, 70, 313-326.
Cléry, J., Guipponi, O., Odouard, S., Pinède, S., Wardak, C., & Hamed, S. B. (2017). The prediction of impact of a looming stimulus onto the body is subserved by multisensory integration mechanisms. Journal of Neuroscience, 37(44), 10656-10670.
Collip, D., Nicolson, N. A., Lardinois, M., Lataster, T., Van Os, J., & Myin-Germeys, I.
(2011). Daily cortisol, stress reactivity and psychotic experiences in individuals at above average genetic risk for psychosis. Psychological Medicine, 41(11), 2305-2315.
Deegan, G. (2003). Discovering recovery. Psychiatric Rehabilitation Journal, 26(4), 368- 376.
Delevoye-Turrell, Y., Vienne, C., & Coello, Y. (2011). Space boundaries in
schizophrenia. Social Psychology, 42(3), 193-204. https://dx.doi.org/10.1027/1864- 9335/a000063
Di Cosmo, G., Costantini, M., Salone, A., Martinotti, G., Di Iorio, G., Di Giannantonio, M.,
& Ferri, F. (2018). Peripersonal space boundary in schizotypy and schizophrenia. Schizophrenia Research, 197(1), 589-590.
Deus, V., & Jokic-Begic, N. (2006). Personal space in schizophrenia. Psychiatria Danubina, 18, 150–158.
Duhamel, J. R., Colby, C. L., & Goldberg, M. E. (1998). Ventral intraparietal area of the macaque: congruent visual and somatic response properties. Journal of
Neurophysiology, 79(1), 126-136.
27
Duke, M. P., & Mullens, C. (1973). Preferred interpersonal distance as a function of locus of control orientation in chronic schizophrenics, nonschizophrenic patients, and
normals. Journal of Consulting and Clinical Psychology, 41(2), 230–
234. https://doi.org/10.1037/h0035141
Ferri, F., Costantini, M., Huang, Z., Perrucci, M. G., Ferretti, A., Romani, G. L., & Northoff, G. (2015a). Intertrial variability in the premotor cortex accounts for individual differences in peripersonal space. Journal of Neuroscience, 35(50), 16328-16339.
Ferri, F., Tajadura-Jiménez, A., Väljamäe, A., Vastano, R., & Costantini, M. (2015b).
Emotion-inducing approaching sounds shape the boundaries of multisensory peripersonal space. Neuropsychologia, 70, 468-475.
Fini, C., Costantini, M., & Committeri, G. (2014). Sharing Space: The Presence of Other Bodies Extends the Space Judged as Near. Plos One, 9(12), e114719.
http://dx.doi.org/10.1371/journal.pone.0114719.
First, M. B., Williams, J. B. W., Karg, R. S., & Spitzer, R. L. (2015). Structured clinical interview for DSM-5—Research version (SCID-5 for DSM-5, research version; SCID-5- RV). Arlington, VA: American Psychiatric Association, 1-94.
Fogassi, L., Gallese, V., Fadiga, L., Luppino, G., Matelli, M., & Rizzolatti, G. (1996). Coding of peripersonal space in inferior premotor cortex (area F4). Journal of
Neurophysiology, 76(1), 141-157.
Freeman, D., Loe, B. S., Kingdon, D., Startup, H., Molodynski, A., Rosebrock, L., ... & Bird, J. C. (2019). The revised Green et al., Paranoid Thoughts Scale (R-GPTS): psychometric properties, severity ranges, and clinical cut-offs. Psychological Medicine, 1-10.
Geraets, C. N., van Beilen, M., Pot-Kolder, R., Counotte, J., van der Gaag, M., & Veling, W.
(2018). Social environments and interpersonal distance regulation in psychosis: A virtual reality study. Schizophrenia Research, 192, 96-101.
Graziano, M. S., & Cooke, D. F. (2006). Parieto-frontal interactions, personal space, and defensive behavior. Neuropsychologia, 44(6), 845-859.
Graziano, M. S., Hu, X. T., & Gross, C. G. (1997). Visuospatial properties of ventral premotor cortex. Journal of Neurophysiology, 77(5), 2268-2292.
Green, C. E. L., Freeman, D., Kuipers, E., Bebbington, P., Fowler, D., Dunn, G., & Garety, P.
A. (2008). Measuring ideas of persecution and social reference: the Green et al. Paranoid Thought Scales (GPTS). Psychological Medicine, 38, 101-111.
Grivaz, P., Blanke, O., & Serino, A. (2017). Common and distinct brain regions processing multisensory bodily signals for peripersonal space and body ownership. Neuroimage, 147, 602-618.
de Haan, A. M., Smit, M., Van der Stigchel, S., & Dijkerman, H. C. (2016). Approaching threat modulates visuotactile interactions in peripersonal space. Experimental Brain Research, 234(7), 1875-1884.
28
Haralanova, E., Haralanov, S., Beraldi, A., Möller, H. J., & Hennig-Fast, K. (2012).
Subjective emotional over-arousal to neutral social scenes in paranoid
schizophrenia. European Archives of Psychiatry and Clinical Neuroscience, 262(1), 59-68.
Holt, D. J., Boeke, E. A., Coombs III, G., DeCross, S. N., Cassidy, B. S., Stufflebeam, S., ...
& Tootell, R. B. (2015). Abnormalities in personal space and parietal–frontal function in schizophrenia. NeuroImage: Clinical, 9, 233-243.
Horowitz, M. J., Duff, D. F., & Stratton, L. O. (1964). Body-buffer zone: exploration of personal space. Archives of General Psychiatry, 11(6), 651-656.
Kandula, M., Hofman, D., & Dijkerman, H. C. (2015). Visuo-tactile interactions are dependent on the predictive value of the visual stimulus. Neuropsychologia, 70, 358-366.
Kandula, M., Van der Stoep, N., Hofman, D., & Dijkerman, H. C. (2017). On the
contribution of overt tactile expectations to visuo-tactile interactions within the peripersonal space. Experimental Brain Research, 235(8), 2511-2522.
Kapur, S. (2003). Psychosis as a state of aberrant salience: a framework linking biology, phenomenology, and pharmacology in schizophrenia. American Journal of
Psychiatry, 160(1), 13-23.
Kean, C. (2009). Silencing the self: schizophrenia as a self-disturbance. Schizophrenia Bulletin, 35(6), 1034-1036.
Kim, J., Park, S., & Blake, R. (2011). Perception of biological motion in schizophrenia and healthy individuals: a behavioral and FMRI study. PLoS One, 6(5) e19971.
Làdavas, E., & Serino, A. (2008). Action-dependent plasticity in peripersonal space representations. Cognitive Neuropsychology, 25(7-8), 1099-1113.
Macaluso, E., & Maravita, A. (2010). The representation of space near the body through touch and vision. Neuropsychologia, 48(3), 782-795.
Makin, T. R., Holmes, N. P., Brozzoli, C., Rossetti, Y., & Farne, A. (2009). Coding of visual space during motor preparation: approaching objects rapidly modulate corticospinal
excitability in hand-centered coordinates. Journal of Neuroscience, 29(38), 11841-11851.
Maravita, A., Spence, C., & Driver, J. (2003). Multisensory integration and the body schema:
close to hand and within reach. Current Biology, 13(13), R531-R539.
Michael, J., & Park, S. (2016). Anomalous bodily experiences and perceived social isolation in schizophrenia: an extension of the social deafferentation hypothesis. Schizophrenia Research, 176(2-3), 392-397.
Mul, C. L., Cardini, F., Stagg, S. D., Sadeghi Esfahlani, S., Kiourtsoglou, D., Cardellicchio, P., & Aspell, J. E. (2019). Altered bodily self-consciousness and peripersonal space in autism. Autism, 23(8), 2055-2067.
29
Nechamkin, Y., Salganik, I., Modai, I., & Ponizovsky, A. M. (2003). Interpersonal distance in schizophrenic patients: relationship to negative syndrome. International Journal of Social Psychiatry, 49(3), 166-174.
Nelson, B., Thompson, A., Yung, A.R., (2012). Basic self-disturbance predicts psychosis onset in the ultra high risk for psychosis “prodromal” population. Schizophrenia Bulletin, 38(6), 1277–1287.
Noel, J. P., Pfeiffer, C., Blanke, O., & Serino, A. (2015). Peripersonal space as the space of the bodily self. Cognition, 144, 49-57.
Noel, J. P., Cascio, C. J., Wallace, M. T., & Park, S. (2017). The spatial self in schizophrenia and autism spectrum disorder. Schizophrenia Research, 179, 8-12.
Noel, J. P., Park, H. D., Pasqualini, I., Lissek, H., Wallace, M., Blanke, O., & Serino, A.
(2018a). Audio-visual sensory deprivation degrades visuo-tactile peri-personal space. Consciousness and Cognition, 61, 61-75.
Noel, J. P., Blanke, O., Magosso, E., & Serino, A. (2018b). Neural adaptation accounts for the dynamic resizing of peripersonal space: evidence from a psychophysical-computational approach. Journal of Neurophysiology, 119(6), 2307-2333.
Noel, J. P., & Serino, A. (2019). High action values occur near our body. Trends in Cognitive Sciences, 23(4), 269-270.
Overall, J. E., & Gorham, D. R. (1988). The Brief Psychiatric Rating Scale (BPRS): recent developments in ascertainment and scaling. Psychopharmacology Bulletin, 24(1), 97-99.
Park, S., & Gooding, D. C. (2014). Working memory impairment as an endophenotypic marker of a schizophrenia diathesis. Schizophrenia Research: Cognition, 1(3), 127-136.
Park, S. H., Ku, J., Kim, J. J., Jang, H. J., Kim, S. Y., Kim, S. H., ... & Kim, S. I. (2009).
Increased personal space of patients with schizophrenia in a virtual social environment. Psychiatry Research, 169(3), 197-202.
Park, S., & Nasrallah, H. A. (2014). The varieties of anomalous self experiences in schizophrenia: splitting of the mind at a crossroad. Schizophrenia Research, 152(1), 1-4.
Parnas, J., & Handest, P. (2003). Phenomenology of anomalous self-experience in early schizophrenia. Comprehensive Psychiatry, 44(2), 121-134.
Pellencin, E., Paladino, M. P., Herbelin, B., & Serino, A. (2018). Social perception of others shapes one's own multisensory peripersonal space. Cortex, 104, 163-179.
Penn, D. L., Kohlmaier, J. R., & Corrigan, P. W. (2000). Interpersonal factors contributing to the stigma of schizophrenia: social skills, perceived attractiveness, and
symptoms. Schizophrenia Research, 45(1-2), 37-45.
Postmes, L., Sno, H. N., Goedhart, S., Van Der Stel, J., Heering, H. D., & De Haan, L.
(2014). Schizophrenia as a self-disorder due to perceptual incoherence. Schizophrenia Research, 152(1), 41-50.
30
Quesque, F., Ruggiero, G., Mouta, S., Santos, J., Iachini, T., & Coello, Y. (2017). Keeping you at arm’s length: modifying peripersonal space influences interpersonal
distance. Psychological Research, 81(4), 709-720.
Raballo, A., & Parnas, J. (2012). Examination of anomalous self-experience: initial study of the structure of self-disorders in schizophrenia spectrum. The Journal of Nervous and Mental Disease, 200(7), 577-583.
Raine, A. (1991). The SPQ: a scale for the assessment of schizotypal personality based on DSM-III-R criteria. Schizophrenia Bulletin, 17(4), 555-564.
Ravinder, H. V. (2013). Determining the Optimal Values of Exponential Smoothing Constants-Does Solver Really Work?. American Journal of Business Education, 6(3), 347- 360.
Rizzolatti, G., Scandolara, C., Matelli, M., & Gentilucci, M. (1981). Afferent properties of periarcuate neurons in macaque monkeys. II. Visual responses. Behavioural Brain
Research, 2(2), 147-163.
Rizzolatti, G., Fadiga, L., Fogassi, L., Gallese, V., (1997). The space around us. Science 277, 190–191.
Russell, D. W. (1996). UCLA Loneliness Scale (Version 3): Reliability, validity, and factor structure. Journal of Personality Assessment, 66(1), 20-40.
Sambo, C. F., Forster, B., Williams, S. C., & Iannetti, G. D. (2012). To blink or not to blink:
fine cognitive tuning of the defensive peripersonal space. Journal of Neuroscience, 32(37), 12921-12927.
Sambo, C. F., & Iannetti, G. D. (2013). Better safe than sorry? The safety margin surrounding the body is increased by anxiety. Journal of Neuroscience, 33(35), 14225-14230.
Sass, L.A., & Parnas, J., (2003). Schizophrenia, consciousness, and the self. Schizophrenia Bulletin, 29(3), 427–444.
Serino, A., Noel, J. P., Galli, G., Canzoneri, E., Marmaroli, P., Lissek, H., & Blanke, O.
(2015a). Body part-centered and full body-centered peripersonal space representations. Scientific Reports, 5, 18603.
Serino, A., Canzoneri, E., Marzolla, M., Di Pellegrino, G., & Magosso, E. (2015b).
Extending peripersonal space representation without tool-use: evidence from a combined behavioral-computational approach. Frontiers in Behavioral Neuroscience, 9, 4.
Serino, A. (2016). Variability in multisensory responses predicts the self-space. Trends in Cognitive Sciences, 20 (3), 169-170.
Serino, A., Noel, J. P., Mange, R., Canzoneri, E., Pellencin, E., Ruiz, J. B., ... & Herbelin, B.
(2018). Peripersonal space: an index of multisensory body–environment interactions in real, virtual, and mixed realities. Frontiers in ICT, 4, 31.
31
Serino, A. (2019). Peripersonal space (PPS) as a multisensory interface between the
individual and the environment, defining the space of the self. Neuroscience & Biobehavioral Reviews, 99, 138-159.
Stanghellini, G., Broome, M., Fernandez, A. V., & Raballo, A. (Eds.). (2019). The Oxford handbook of phenomenological psychopathology. Oxford University Press, USA.
Teneggi, C., Canzoneri, E., di Pellegrino, G., & Serino, A. (2013). Social modulation of peripersonal space boundaries. Current Biology, 23(5), 406-411.
Thakkar, K. N., Nichols, H. S., McIntosh, L. G., & Park, S. (2011). Disturbances in body ownership in schizophrenia: evidence from the rubber hand illusion and case study of a spontaneous out-of-body experience. PloS one, 6(10) e27089.
Veling, W., Brinkman, W. P., Dorrestijn, E., & Van Der Gaag, M. (2014). Virtual reality experiments linking social environment and psychosis: a pilot study. Cyberpsychology, Behavior, and Social Networking, 17(3), 191-195.
de Vignemont, F., & Iannetti, G. D. (2015). How many peripersonal spaces?. Neuropsychologia, 70, 327-334.
Wechsler, D. (2008). Wechsler adult intelligence scale–Fourth Edition (WAIS–IV). San Antonio, TX: NCS Pearson.
32 Appendix
Supplementary material 1. Group difference in goodness of fit (R2)
Condition Function CO SZ test
Social PPS Linear R2 = .79 R2 = .84 t = 1.08, p = .29 Sigmoid R2 = .92 R2 = .91 t = -.36, p = .72 Non-social PPS Linear R2 = .76 R2 = .75 t = -.16, p = .87 Sigmoid R2 = .90 R2 = .94 t = 1.44, p = .16
33
Supplementary material 2. Individual goodness of fit (R2) for CO Condition
Social Non-social
ID Linear Sigmoid Linear Sigmoid
1 0.91 0.89 1.00 0.99
2 0.92 0.88 0.59 0.61
3 0.58 0.92 0.84 0.97
4 0.60 0.79 0.88 0.90
5 0.85 0.97 0.74 0.99
6 0.75 0.99 0.64 0.93
7 0.79 1.00 0.59 1.00
8 0.96 0.94 0.84 0.97
9 0.89 0.99 0.60 0.59
10 0.38 0.92 0.89 0.99
11 0.75 0.74 0.86 0.85
12 0.46 0.86 0.68 0.92
13 0.97 0.99 0.58 0.96
14 0.68 1.00 0.68 0.91
15 0.84 0.98 0.98 0.95
16 0.75 0.91 0.88 1.00
17 0.72 0.85 0.61 0.99
18 0.56 0.72 0.48 0.79
19 0.87 0.88 0.86 0.97
20 0.98 0.95 0.84 0.83
21 0.95 0.96 0.83 0.98
22 0.98 0.96 0.82 0.92
23 0.92 0.97 0.93 0.91
24 0.94 0.92 0.61 0.57
For social condition, average R2 value for sigmoid function (M = 0.92) was significantly higher than that of linear function (M = 0.79) in control group (Paired-t = 3.91, p = .001***).
Likewise, for non-social condition, average R2 value for sigmoid function (M = 0.90) was significantly higher than that of linear function (M = 0.76) in control group (Paired-t = 4.58, p
= .001***).
34
Supplementary material 3. Individual goodness of fit (R2) for SZ Condition
Social Non-social
ID Linear Sigmoid Linear Sigmoid
1 0.78 1.00 0.80 0.99
2 0.83 0.95 0.92 0.99
3 0.80 1.00 0.76 0.92
4 0.91 0.99 0.86 1.00
5 0.91 0.92 0.70 0.85
6 0.96 0.94 0.82 0.91
7 0.89 0.87 0.58 0.97
8 0.79 0.92 0.69 1.00
9 0.86 0.81 0.66 0.95
10 0.98 0.98 0.93 0.91
11 0.86 0.90 0.89 0.98
12 0.73 0.94 0.62 0.86
13 0.79 0.76 0.40 0.80
14 0.95 0.95 0.81 0.88
15 0.43 0.68 0.75 0.87
16 0.99 0.97 0.82 0.98
17 0.96 0.95 0.93 0.95
18 0.94 0.93 0.89 0.99
19 0.92 0.98 0.96 0.99
20 0.90 0.86 0.65 1.00
21 0.89 0.95 0.79 0.97
22 0.39 0.57 0.14 0.81
23 0.92 0.96 0.91 0.94
24 0.83 0.97 0.78 1.00
For social condition, average R2 value for sigmoid function (M = 0.91) was significantly higher than that of linear function (M = 0.84) in individuals with schizophrenia group (Paired-t = 3.35, p = .003**). Also, for non-social condition, average R2 value for sigmoid function (M = 0.94) was significantly higher than that of linear function (M = 0.75) in individuals with schizophrenia group (Paired-t = 5.83, p < .001***).
35
Supplementary material 4. Correlations among PPS variables, psychological or clinical factors in SZ
PPS variables
Social PPS Non-social PPS
CP Slope CP Slope
Working memory
LNS (score) .03 .21 .43* -.30
LNS (digit) .04 .13 .41* -.33
Clinical
DUI .06 .43* .10 -.07
# hosp .10 -.06 -.16 .26
BPRS .08 -.07 -.09 -.20
SAPS (total) .07 -.23 -.09 -.06
Hallucination .01 -.47* -.08 .02
Delusion .16 -.04 .05 -.22
Bizarre behavior .17 .19 -.18 -.04 Thought disorder .13 -.03 .03 .05
SANS (total) .02 .00 -.22 .08
Affective flattening -.01 -.04 .07 .05
Alogia