My association with Ken Grace and the members of the Caltech Swimming Club has been a source of great pleasure to me. The members of the Bailey research group deserve my thanks for sharing their expertise and friendship.
Run CI22 sample, start of bioconversion
Run CI22 sample, 54 hours of bioconversion
Run CI21 spores from a sample after 79 hours of bioconversion
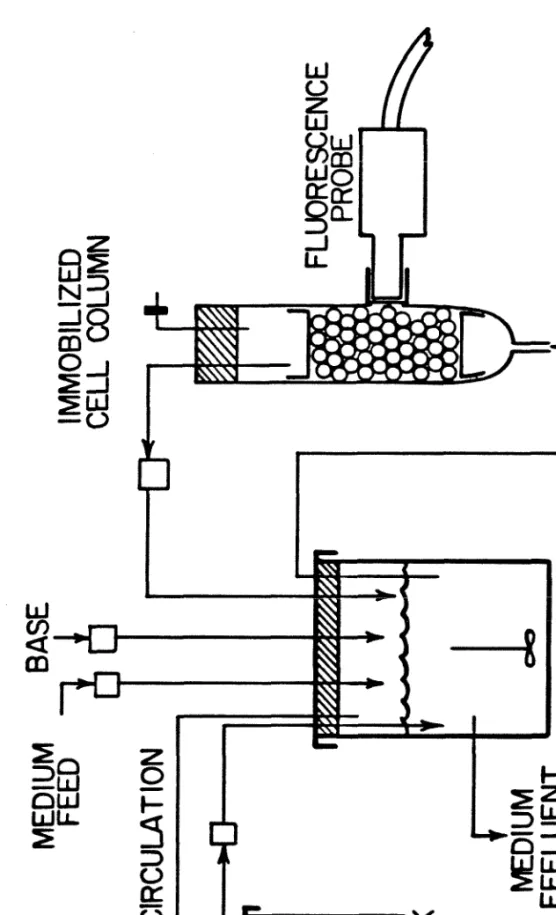
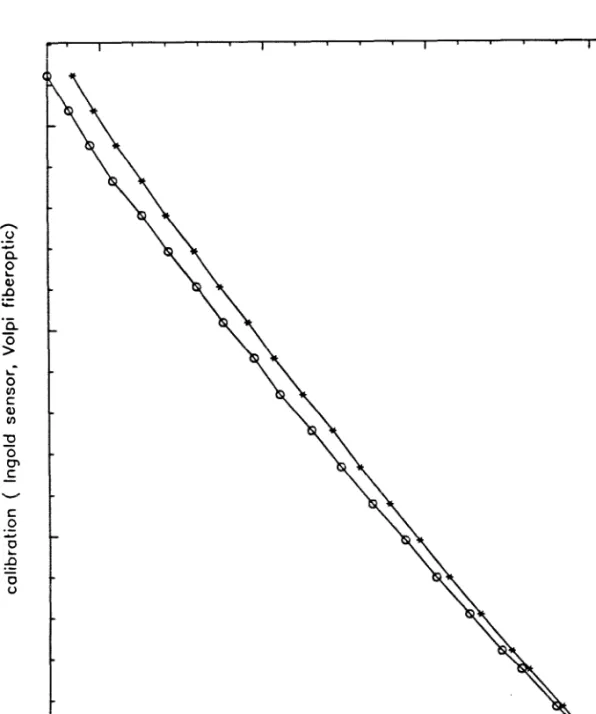
Cheetham, P.S.J., "Use of Immobilized Enzymes and Cells and Biochemical Reactors in Biotechnology - Principles of Enzyme Engineering,". After passing through a 365 nm interference filter (Oriel Corp.), the light entered a liquid fiber optic cable arm and was guided to the emission/collection end of the "combination" section.
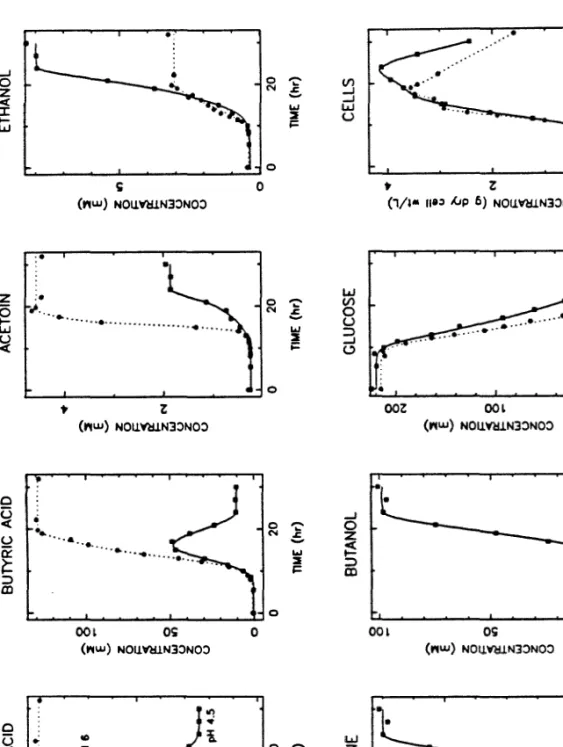
Acetic Acid, Acetoin, Acetone, Butanol, Butyric Acid, and Εthanol The concentrations of these fermentation products were measured by
To assess bead-to-bead variation in the number of cells per bead in run CI30, samples from this experiment were quantified by dissolving 15 beads in 3.0 mL of tripolyphosphate solution. Acetic acid, acetoin, acetone, butanol, butyric acid and εethanol The concentrations of these fermentation products were measured with. The decrease in 340 nm absorbance due to consumption of NADH by reductive amination of 2-oxoglutarate (by glutamate dehydrogenase) was measured with a Shimadzu UV-160 spectrophotometer.
L-(—)-lactic acid concentrations in fermenter samples were measured with a kit from Boehringer Mannheim using the technique described by Noll [8].
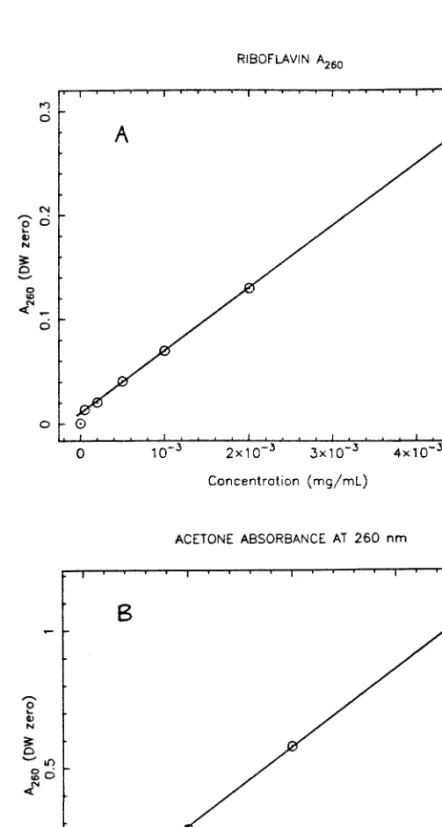
Riboflavin
Iron
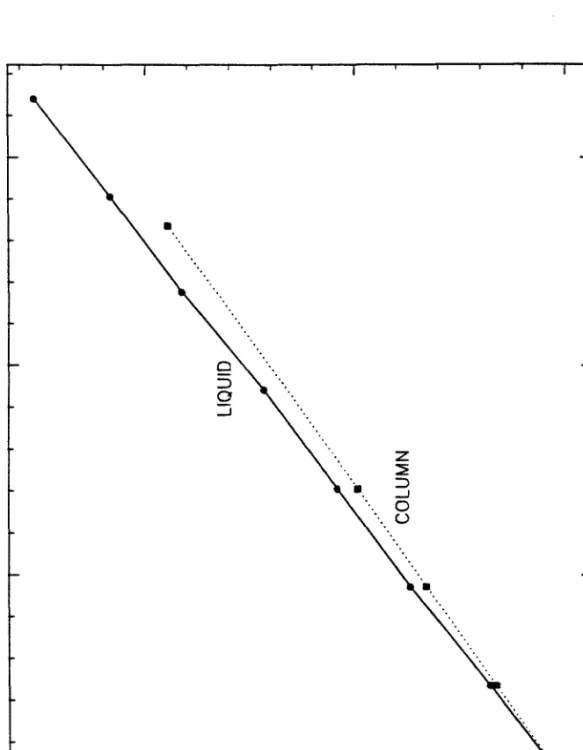
The reducing reagent was necessary to convert the iron(III) in the fermentation samples to iron(II) for the formation of the colored complex with Ferrozine. The absorbance values could be converted into concentration data using the calibration curve shown in Figure 13. For the determination of very low iron levels, the above protocol was followed, except that 1.0 ml of sample and 0.1 ml of reducing reagent were used.
The release of cytoplasmic components from the immobilized cells was measured as absorbance at 260 nm (in experiments CI28 and CI30), using a Shimadzu UV-260 spectrophotometer (25oC, slit width 1 nm, path length 1 cm, deionized water zero). Black and white photographs were taken of cell suspensions of the dissolved alginate bead samples from experiment CI28, using an Olympus BHB microscope, a Nikon F2 35 mm camera, and a special microscope-camera adapter. The following procedure was used to prepare the alginate bead samples for viewing: first, whole beads were immersed in 2% (v-v) glutaraldehyde solution for 12 h.
The beads were then washed in buffer and stored overnight at 40C in bead storage buffer to remove excess glutaraldehyde.
COLUMN
FERMENTORMEDIUM RECIRCULATION
Gas return from GasPak
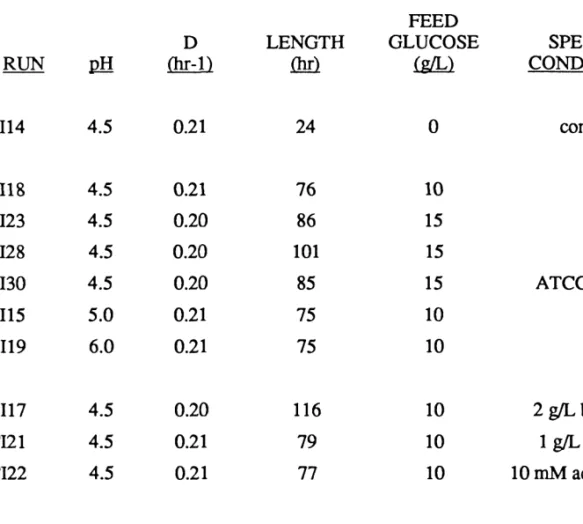
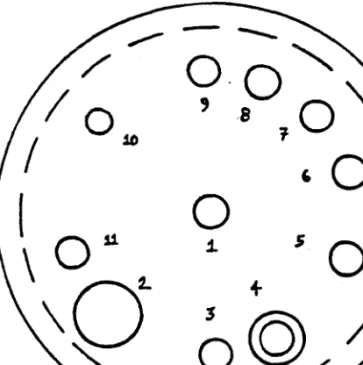
Sample tube 5. Heater well
Base addition 7. Thermometer
FERMENTOR“MEDIUM RECIRCULATION
From column 6. Heater well
Thermometer 8. Thermistor well
Base addition 12. Condenser and
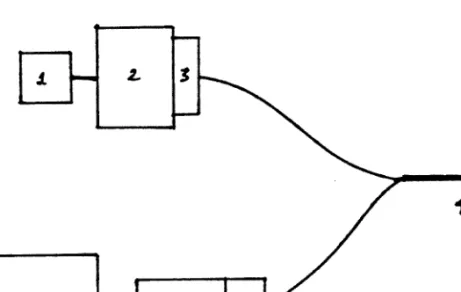
Lamp
Primary filter 3. Optical fibers
Photomultiplier tube 7. Amplifier
Cable
Calibration device 10. Power supply
Power supply
Liquid/fiber optical light guide 5.460 nm filter and housing
Photomultiplier tube and housing 7. Photometer power supply and readout
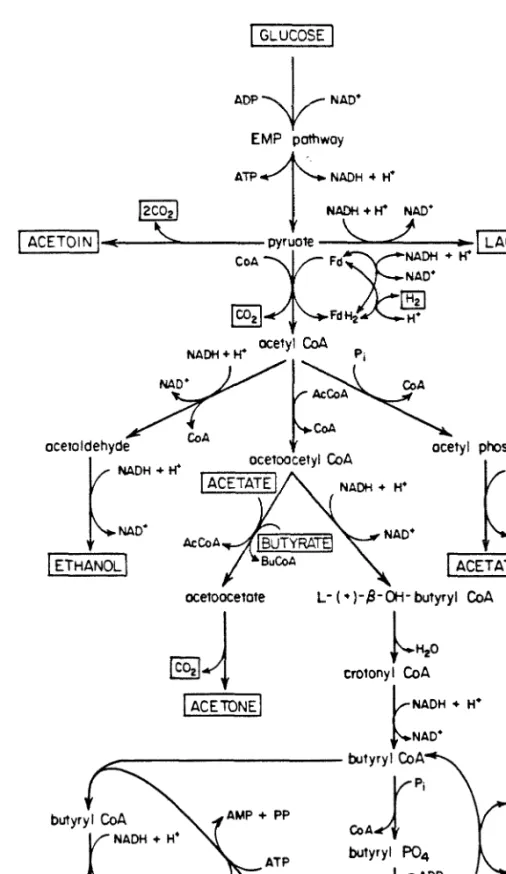
Although industrially important for many years [15,16] and studied by many researchers [e.ÿ the complete enzyme system and regulatory mechanisms of the metabolism of Cl. Most of the pyruvate is decarboxylated by pyruvate-ferredoxin oxidoreductase to form acetyl coenzyme A and CO2 [31]. One involves a CoA transferase, either the acetoacetyl-CoA:acetate (butyrate) CoA transferase mentioned earlier [l,4] or perhaps an acetate CoA transferase of the type found in Cl.
In this work, concepts such as these will be used to evaluate carbon fluxes through the various branches of the Cl metabolic pathway. These levels of pathway branching must now be related to changes in the concentration of external fermentation metabolites. The small fluctuations in Figures 20 and 21 are remnants of the glue fitting process.
Another notable feature is the consumption of butyric acid during the last 8-10 hours of the pH 4.5 fermentation, which is manifested as negative values for the clumping rate vγ.
Culture Fluorescence Analysis
An advantage of the optical fiber system used in the Ingold probe used in this work is the relatively short effective light penetration depth (small measuring volume); this depth be. This local maximum in specific fluorescence is a very sensitive indicator of the onset of growth and glucose consumption; the change in glucose concentration is not measurable at this point, but increases rapidly shortly thereafter. Of the seven carbon fluxes of the υ* branches that contribute to changes in NAD(P)H concentration, all but t>13 are known.
There is substantial evidence for reversal of the NAD(P)H:ferredoxin oxidoreductase reaction during a solvent-producing batch fermentation. However, at the 13 hour point of pH 6.0 cultivation, the specific fluorescence level begins to increase, signaling a significant change in the size of tq3. It is not possible to determine the sign of tq3 at this stage of fermentation (due to the specific flu.
Gay, “Activities of NAD and NAOP ferredoxin reductase in cell-free extracts of the butter group.
ACETATE
Bioconversion With Metabolite-Containing Feed 1. Product Concentration Profiles
As was the case when butyric acid was included in the feed, acetic acid was clearly consumed from the feed medium, resulting in relatively high initial concentrations of acetone. In fact, early in the bioconversion phase, the molar concentration of acetone was higher than that of butanol. All the bioconversion experiments discussed so far used a feed medium that contained neither a nitrogen source nor any vitamins (eg, biotin).
The acid product concentration ranges are similar to those in bioconversion experiments at pH 4.5 with regular feed, in terms of their increase to a single large peak, the value of the peak, and the formation of more butyric acid than acetic acid. The large box in the background of the photo is probably due to gas evolution by rapidly growing cells. These conclusions regarding the degree of diffusion limitation are derived for the bioconversion phases of the experiments discussed in this chapter.
Evidence that internal diffusion was not limiting in the growth phase of the experiments is provided by the photograph of Figure 57A.
Bioconversion With Sporogenous vs. Asporogenous Strains
Figures 35-38 and 44-46 show the numbers of four different morphological types found in the alginate granules during the bioconversion phase for runs CI28 and CI30, respectively. Although the data points in Figure 35 indicate that the number of vegetative rod shapes counted increased over the 30-60 hour interval of the experiments. Flavodoxin can participate in the same electron transfer reactions as ferredoxin, and the catabolic activity of the cell does not appear to be affected by the substitution [37].
In fact, the specific formation rates of all products and the specific glucose uptake rates were maximal at that time. This is a consequence of the faster decrease in cell number than volumetric rates during the run. The presence of nitrogenous lysis products also explains the ability of the ATCC 824 cells to sporulate in the absence of a medium-supplied nitrogen source, as C.
The results for both experiments further illustrate the general increase in metabolic rate due to the consumption of lysis products.
NAD(P)H-Dependent Fluorescence During Bioconversion
This indicates that the activities of the two enzymes that lead to the formation of butanol from butyric acid, butyraldehyde dehydrogenase and butanol dehydrogenase, were not affected by changes in pH in the range of 4.5 to 6. In fact, the activity of acetoacetate decarboxylase (which catalyzes the irreversible decarboxylation of acetoacetate) is was maximum at pH 5, 85% of maximum at pH 4.5 and only 23% of maximum at pH 6 [42,43]. It is possible that the pH dependence of at least one of the dehydrogenases leading to ethanol formation exhibits similar behavior.
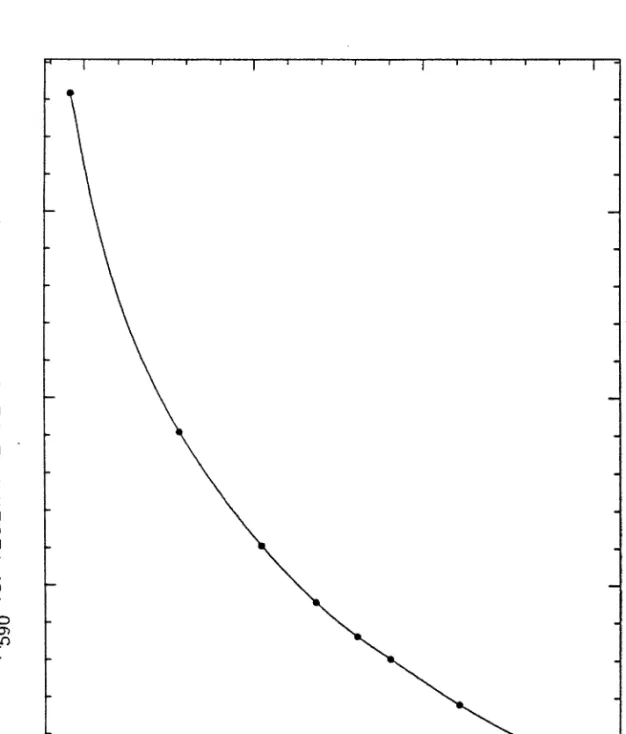
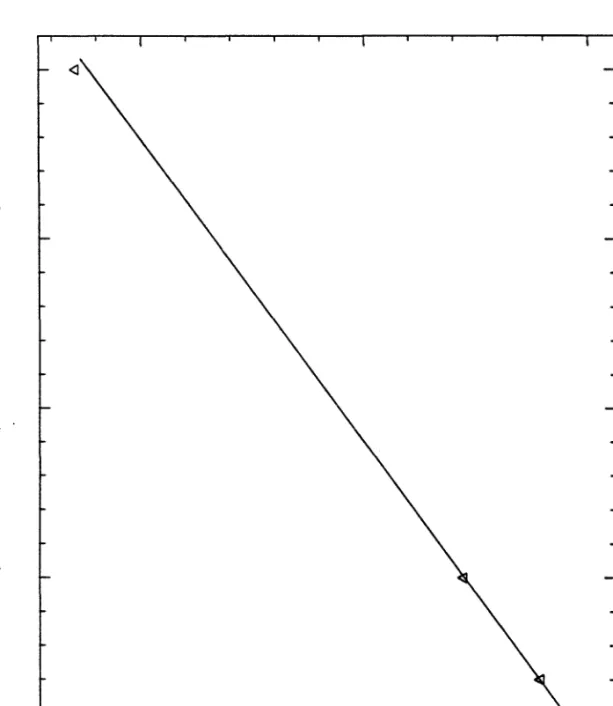
This is confirmed by the results of the run CI22 alginate bead analysis, in which both microscope and A590 tests were used (Figures 54 and 55). More visible evidence of the consumption of excreted acids is evident in these curves than in the results of most other runs. Although the volumetric production rate of measured acetone was negative during the first 20 hours of the run CI22 bioconversion experiment (Figure 80), this was due to the consumption of acetoacetate (acetone uptake does not occur).
This consumption appears as an increase in the early acetic acid formation rate, which was greater than the butyric acid formation rate for most of the run.
Bioconversion With Nitrogen-Containing But Vitamin-Free Feed The addition of 0.8 g/L NH4C1 to the bioconversion feed resulted in dramati
Other experiments with acetate addition to growing suspended cells also reported increases in acetone, but not butanol, production [49]. As in the acetate feeding experiment, consumption of excreted acetic and butyric acids was observed and resulted in increased acetone and butanol formation rates after 20–25 h of bioconversion. Huesemann and Papoutsakis found that the addition of acetoacetate to growing suspended cell group cultures resulted in enhanced butanol formation; they also reported that addition of butyrate increased the amount of butanol formed towards the end of growth [50].
These authors argued that these effects were caused by the uncoupling action of weak acids on the membrane ΔpH and were able to achieve similar increases by adding non-metabolizing uncoupling agents to growing cultures [50]. Unfortunately, beads were not sampled during this experiment, and thus there is no direct information about the number and composition of the immobilized cell population. However, microscopic examination of digested bead samples at the end of the experiment indicated that significant levels of sporulation had occurred.
Bioconversion With Clostridium acetobutylicum
While sporulation of the majority of the immobilized cell population is the main cause of the loss of activity after lysis in the ATCC 824 experiments, a different, slower mechanism is responsible for the activity losses in the ATCC 39236 experiment, as only a few immobilized cells sporulated. . It may be that the lack of these vitamins after 100 h of bioconversion caused sporulation in the experiment in which nitrogen was supplied. A more reasonable hypothesis is that starved cells require the highest rate of ATP production; the phosphorylation of ADP in the kinase reactions leading to the formation of acetate and butyrate does not occur when solvent production predominates, and thus acidogenesis produces more ATP per molecule of glucose consumed.
The highest butanoacetone ratio in the right column of Table 4 was found in run CI19, bioconversion at pH 6. The experiment in which a nitrogen source was supplied to the immobilized cells resulted in the highest overall butanol productivity (mol of butanol per experiment), with a very high B:A ratio. Differences in the environmental conditions of the bioconversion stage, such as pH or metabolizable acid feed additives, resulted in different patterns of product formation activity and product selectivity.
In situ monitoring of immobilized cell NAD(P)H-dependent fluorescence showed that the intracellular NAD(P)H levels in the cells changed during the course of bioconversion.