In addition to the effects of government spending on production, an important aspect is also the problem of synchronizing fiscal policy with the economy of the conjuncture. Fiscal policy here includes the effects of government spending and government tax revenue on output and prices. The existing literature on the effects of fiscal policy can be classified into two groups: demand-side and supply-side.
The effect of fiscal policy on the economy through the aggregate demand approach is described by the Keynes approach. Using one of the identified variables, fiscal policy alone, is not sufficient to determine the direction of fiscal policy. Academics have not reached agreement on the method of measuring appropriate fiscal policy discretion (Fatas and Mihov, 2003).
On the other hand, there is also the opinion that fiscal policy should not be restrictive. In addition, fiscal policy can affect inflation through public expectations of the Government's ability to pay its debts. This means that changes in the fiscal policy stance of the current period (t) and the previous period (t-1) increase the volatility of inflation in the current period (t).
Studying the effects of fiscal policy on inflation is usually done by examining the relationship between fiscal and monetary policy and its impact on inflation.
METHODOLOGY 3.1. Data and Variables
Estimation techniques
VECM is a VAR model; designed for use in non-stationary data series and the series have a cointegration relationship. VEC has cointegration relations built into the specification, so that it constrains the long-run behavior of the endogenous variables to converge to their cointegration relations, while allowing for short-run adaptive dynamics. A0 is a vector of exogenous variables in the form of constants A1; is the matrix of lag coefficients of size (k x k) and et is the error vector (residual).
Using the standard model of the VAR in equation (5), structural innovation is calculated by:. A and B is the matrix to estimate (k x k). Structural innovation et is assumed to be orthonormal such that the covariance matrix is the identity matrix E[ete't)=1. Assuming orthonormality, the number of necessary constraints is k(k+1) / 2 to complete an equal number of 2k2 unknown parameters in matrices A and B.
Γp is a (k x k) matrix of coefficients; C* is the matrix associated with the deterministic term used in the model as a constant, trend or seasonal dummy; and reduced shape distortion. Therefore, determining how many r < (k-1) are contained in the cointegrating vector β is similar to determining how many columns there are zeros in α. The presence of a zero column in α means that the cointegration vector in the β matrix is not significant if it is not included in the model specifying equation (6) above.
The first step of the VECM method is to test the stationarity of all variables to determine the order of integration. To obtain the pattern of dynamic adjustment of the VECM model, we also analyze the impulse response function of the LGDPRLSA and LCPI to one standard deviation shock to other studied variables. In this study, the choice of the sequence is determined by the Granger causality test.
As previously mentioned, the second approach, the linear regression model, was used to see the effect of discretionary fiscal policy on output and inflation volatility. This is done by estimating the three variants of the equation, namely (i) the cyclically adjusted balance equation, (ii) the volatility of output equations, and (iii) volatility of the inflation equation. This method is defined as the deviation of the monthly inflation rate from its average during the year.
RESULTS AND ANALYSIS
This study will estimate the effects of government spending and taxes on production and inflation. Furthermore, we performed a weak exogeneity test, which is equivalent to testing whether the variables' rate of fit coefficients are equal to zero. In other words, no information is lost if the variable is not modeled, so it means that a variable can be inserted on the right side of the VECM equation.
Testing the speed of adjustment coefficient of the variables is done by linear constraint on the coefficients of the long run VECM equation. The result of the test using the likelihood ratio test can be seen in Table 6. This may mean that tax revenue is one of the most important aspects in the source of government funding, especially for infrastructure development.
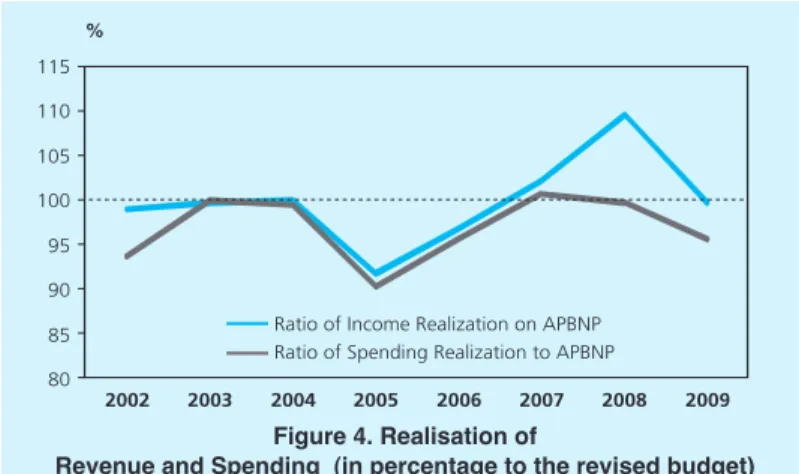
Residual tests of the VECM estimation results indicate that the VECM equation passes the residual test. The pattern of short-term adjustment of the output variable to one standard deviation shock of the other variables can be shown from the impulse response. Over the entire 2002-2009 period, the expenditure budget was generally always below the APBNP, with the exception of the years 2007-2008.
The test results using the same method to analyze the effect of public consumption and taxation on inflation suggest that there is no cointegration relationship between inflation and the fiscal variables. The inflation error correction coefficient is not significant despite having a negative value (Appendix 4) ). From the impulse response function, a positive shock to public consumption will be responded to by a fall in inflation (left panel in Figure 5). The negative influence of a positive shock in public consumption is in line with several studies, i.e.
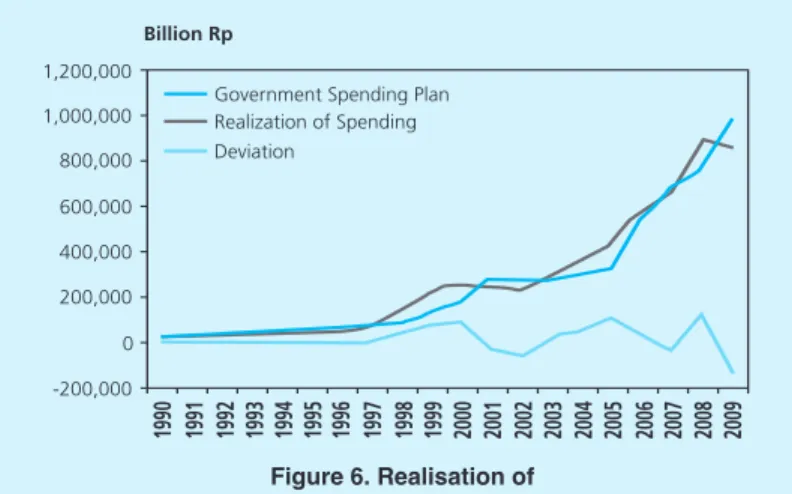
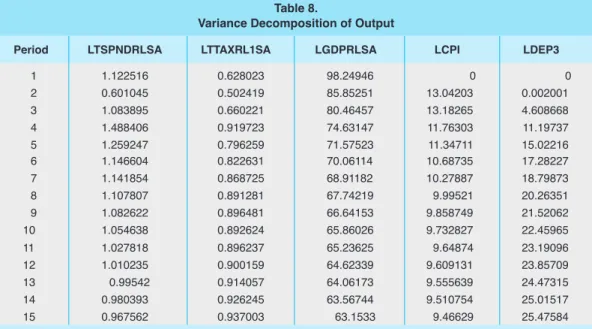
Fatas and Mihov [2003] and Mountford and Uhlig [2002], where government spending has a negative impact on inflation. The test results show that the variance decomposition of inflation (CPI) is more explained by changes in government spending than tax variables. If the deviation is calculated as a percentage of the plan, the standard deviation during the sample period is 19.4%.
The larger divergence in the economy after the 1998 crisis is partly due to Indonesia's economy becoming increasingly integrated with the global economy. Consequently, the shock that occurred in the global economy will affect the achievement of the macroeconomic assumptions used in budget planning.
CONCLUSION
It can therefore be concluded that the deviation has not demonstrated the existence of a discretionary fiscal policy, therefore it is not necessary to test for the effects on output and inflation volatility. Oil price increases beyond the stated assumptions are softening, forcing the government to revise its spending plans. Review of expenditure is mainly related to the sky-high fuel subsidies and transfers of funds to the regions.
Adjusting government spending since the economic crisis of 1998 has not been so easy in the pre-crisis period, as the government has committed to gradually reducing its debt ratio and keeping the budget deficit under control. In addition, the increasing role of the parliament (DPR) in the budget process makes the government's budget adjustment process more complex. In academic terms, these studies suggest improvements to the model to examine the effect of fiscal policy on inflation.
One way is to include the elasticity of expenditure and taxes to inflation when preparing the model.
- Optimal Lag
- Model Stability Test
- Cointegration Test
- Estimasi Result: VECM
- Estimasi Result: VECM (continued)
Follow-up test indicates 1 cointegrating equation(s) at the 0.05 level * indicates rejection of the hypothesis at the 0.05 level **MacKinnon-Haug-Michelis (1999) p-value. The maximum eigenvalue test shows 1 cointegrating equation(s) at the 0.05 level * indicates rejection of the hypothesis at the 0.05 level.