JDE (Journal of Developing Economies)
https://e-journal.unair.ac.id/JDE/index
THE SHORT-RUN IMPACT OF INDONESIA’S LARGE-SCALE SOCIAL RESTRICTION ON INTRA-GENERATIONAL HOUSEHOLD ECONOMIC
MOBILITY
Sri Juli Asdiyanti Samuda*1,2 Rus’an Nasrudin1
1Faculty of Economics and Business, Jakarta, Universitas Indonesia
2Statistics Indonesia, Jakarta, Indonesia
ABSTRACT
This study aims to estimate the impact of policy responses due to the Covid-19 pandemic on intra-generational household economic mobility in Indonesia. Given the many policy interventions during the Covid-19 pandemic in 2020, this study focuses on the implementation of partial lockdowns known as PSBB policy in four districts (Bogor Regency, Bekasi Regency, Bogor City, and Bekasi City). In order to have a causal relationship, this study performs Synthetic Control Method to construct hypothetical counterfactual regions for districts that implement PSBB policy. Based on multinomial logit estimations, this study found that the implementation of PSBB adversely affects household economic mobility in rural districts but does not significantly affect household economic mobility in urban districts in the short run.
Keywords: Mobility restriction, large-scale social restriction, Covid-19, intra-generational, economic mobility
JEL: D31, I18, I30, R28, Z13
To cite this document: Samuda, S. J. A. & Nasrudin, R. (2023). The Short-Run Impact of Indonesia’s Large-Scale Social Restriction on Intra- Generational Household Economic Mobility. JDE (Journal of Developing Economies), 8 (1), 61-79. http://dx.doi.org/10.20473/jde.v8i1.39710
Introduction
The world has faced massive disruptions due to the outbreak of Coronavirus Disease 2019 (Covid-19). The Covid-19 pandemic led to many uncertainties, resulting from individuals’
fear of infections, business closure, mandatory social distancing, and change in the labor market and working habits. In Indonesia, Covid-19 was first detected on March 2, 2020, in Depok, as was announced by President Joko Widodo, followed by a drastic increase in new Covid-19 cases.
The Indonesian government responded to this unprecedented shock with various interventions, including non-pharmaceutical interventions (NPIs) interventions. On December 31, 2020, 743,198 reported positive cases were confirmed in Indonesia, of which 611,097 have recovered, with 22,138 deaths (WHO, 2021).
In 2020, instead of total lockdowns, the Indonesian government implemented Large- Scale Social Restrictions (Pembatasan Sosial Berskala Besar - PSBB) as policy responses to deal with the Covid-19 pandemic. The enactment of policy was based on Government Regulation (PP) No. 21/2020 on Large-Scale Social Restrictions to Accelerate the Mitigation of Coronavirus Disease 2019. PSBB was implemented in only some regions in Indonesia. The decision to implement PSBB policy is based on regional authority considerations, such as the number
ARTICLE INFO
Received: Oct 11st, 2022 Revised: Feb 3rd, 2023 Accepted: Mar 26th, 2023 Online: Jun 15th, 2023
*Correspondence:
Sri Juli Asdiyanti E-mail:
JDE (Journal of Developing Economies) p-ISSN: 2541-1012; e-ISSN: 2528-2018 DOI:http://dx.doi.org/10.20473/jde.v8i1.39710
of active cases, healthcare systems, financial capabilities, and approval from the central government. Most of the Covid-19 pandemic epicenters’ authorities initiated implementation of PSBB, for instance, Jakarta, Bogor, Depok, Tangerang, and Bekasi (JABODETABEK).
The implementation of PSBB may slow the infection of Covid-19 but also hurts the economy simultaneously. As the results of a survey in research conducted by Jafar & Meilvidiri (2022) stated that the government policies implemented are still partially effective. So that the negative impact on the economy can still be clearly felt by people. Many studies try to identify the potential economic impact of Covid-19 shock and policy implemented (Chen et al., 2020;
Chetty et al., 2020; Gibson & Olivia, 2020; Kim et al., 2020; Loungani et al., 2021; Martin et al., 2020; McKibbin & Fernando, 2021; Olivia et al., 2020; Suryahadi et al., 2021). According to Gibson and Olivia (2020), the unprecedented economic and public health responses during the Covid-19 pandemic caused the direct effects of Covid-19 on poverty rates and the indirect effects of Covid-19 on life expectancy through lower future incomes.
Furthermore, many economists believe that the economic impact of the pandemic and implemented policy affects not only certain income groups but every income group, from the poorest to the richest, with different degrees of effects (Blundell et al., 2020). Millions of previously economically secure households in the middle of the income distribution have become poor or are at risk of becoming poor. Ministry of Finance and UNICEF (2020) tried to simulate the economic repercussions and found that the Covid-19 crisis would result in an 18%
decline in upward economic mobility and a 16 % increase in downward economic mobility for Indonesia’s children. Therefore, studies on economic mobility help evaluate policies to prevent widening inequality.
This study aims to estimate the impact of policy responses due to Covid-19 on short-run household economic mobility. Specifically, this study focuses on implementing PSBB policy in selected districts in the pandemic’s epicenter, namely Bogor Regency, Bekasi Regency, Bogor City, and Bekasi City. Considering the short observation period, this study focuses on examining intra-generational household economic mobility. Though a significant number of studies analyzed the impact of Covid-19, studies focusing on the short-run impact of policy responses due to Covid-19 are still limited, especially in Indonesia. Most studies examine the impact of policy responses due to Covid-19 and focus on macroeconomic indicators, such as economic growth, investment, and employment. Studies that provide detailed analysis at the household level still need to be done. In addition, few studies on economic mobility at the household level employ recent panel data sets, especially during the Covid-19 pandemic in Indonesia.
This study aims to fill those gaps by providing empirical evidence of the economic impact of PSBB on intra-generational household economic mobility. This paper uses recent panel data from Susenas March and September 2020 provided by Statistic Indonesia (Badan Pusat Statistik - BPS) to provide empirical evidence of the short-run intra-generational household economic mobility during the Covid-19 pandemic in 2020.
Literature Review
Household Economic Mobility
Economic mobility is an aggregate measure of the changes in income among the same individuals or families in a given society between two periods, where the individual-level changes might increase or decrease (Fields & Ok, 1999). Although economic mobility is rarely discussed in policy, it is still an important and interesting topic to reduce inequality.
There are three crucial dimensions in economic mobility analysis. One is the metric, the indicators to measure welfare, for example, income, consumption, expenditures, health, assets, employment, and capabilities. The second is temporal, the timeframe over which the metric is examined. The period of data can be distinguished between static data (single cross- section) and longitudinal data. The third dimension is the method used to analyze economic
mobility over the population of interest (Baulch & Hoddinott, 2000). In recent literature, economic mobility is calculated using income or consumption and measured through time.
Based on transition, economic mobility is divided into two categories: first, economic mobility between parents and children or grandchildren (inter-generational mobility), and second, changes in income or social class within the same individual or household (intra- generational mobility). The economic mobility of households is affected by many factors, such as the level of education, the career choice of household members, job experience, earnings, and the formation or dissolution of families (Beegle et al., 2011; Carroll & Chen, 2016; Woolard
& Klasen, 2005).
Dartanto et al. (2020) measured the intra-generation economic mobility in Indonesia using five waves (1993, 1997, 2000, 2007, and 2014) of the Indonesian Family Life Survey (IFLS) dataset. This study suggested that the primary determinant of economic mobility in Indonesia is the accumulation of physical and human capital. This study also noted that households in poor and emerging income classes have more capability to move into higher income groups than other income classes. In contrast, households in the middle-income class are very vulnerable to falling into poverty. Similarly, Nguyen & Nguyen (2020) prove that education plays an important role in increasing the intra-generational and intergenerational mobility of households in Vietnam. Households with highly educated heads are more mobile than households with heads with lower educational attainment. There are also covariate shocks, including the Covid-19 pandemic and economic depression, that are outside the direct control of the household. The shocks can have suspended millions of workers’ lifetime labor supply, human capital accumulation, consumption, and nonmarket returns to education, which modify their life trajectories and mid-and later-life outcomes (Baulch & Hoddinott, 2000;
Fields, 2000; Song et al., 2020).
There needs to be more literature investigating Covid-19 and household economic mobility. However, this study summarizes the effect of Covid-19 on household economic mobility based on statements from previous studies that the impacts of lockdown on households’ welfare come from at least two channels: income effect and social challenge (Almeida et al., 2021; Christelis et al., 2020; Kansiime et al., 2021; Martin et al., 2020; Morgan
& Trinh, 2021). First, through income effect, partial lockdown or PSBB prompts that many economic activities are restricted, and working is impossible. Some essential occupations, such as healthcare or food chain-related jobs, may still operate. Meanwhile, some jobs may also be less affected by PSBB because of their ability to work from home. However, not all workers can perform their jobs at home, especially in informal sectors (Khoirunurrofik et al., 2021).
When economic activities are closed or restricted, a significant part of the labor force faces wage reduction, decreasing household income and triggering household economic mobility.
Besides income effects, the enactment of PSBB occurs social challenges such as restricted movements and mental health issues. Restricted movements were associated with psychological states resulting from fear, uncertainty, and stress due to failure to attend social activities (Kansiime et al., 2021). During the lockdown, psychological conditions changed households’ preference for necessities and non-necessities products, such as personal hygiene products, out-of-pocket (OOP) healthcare spending, and hedonic shopping (Di Crosta et al., 2021). Suppose this expenditure is large, exceeding a certain threshold of a household’s income or ‘capacity to pay’, there is the possibility that it might be causing ‘catastrophic’ spending (Alam & Mahal, 2014). Catastrophic spending is out-of-pocket (OOP) payments for healthcare exceeding a specified threshold of a household’s capacity to pay (the WHO uses a threshold of 40%), which may cause households to face financial problems. Therefore, the PSBBs cause uncertainty and insecurity and affect household income and consumption. Meanwhile, based on expenditure metrics, a change in consumption during the implementation of partial lockdown would lead to a change in the initial trajectories of household income class, resulting in intra-generational economic mobility.
The Implementation of Large-Scale Social Restrictions (PSBB)
This section briefly overviews large-scale social restriction (PSBB) implementation in Indonesia. In the time of Covid-19, Indonesia has taken several policy responses, including PSBB. According to Law No. 6/2018 on Health Quarantine, which contributes as the reference for PSBB regulation, the restriction set forth by the regulation involves (i) school and workplaces closure, (ii) restrictions on activities in public facilities, and (iii) restrictions on religious activities.
DKI Jakarta was the first region that proposed PSBB, followed simultaneously by Bogor, Depok, and Bekasi almost in the same period, i.e., mid-April 2020 until December 2020. Figure 1 shows the timeline of policy responses from March 2020 and February 2021.
The implementation of PSBB implies that many economic activities are closed, and working is impossible. Some essential occupation workers, such as healthcare or food chain- related jobs, may still operate, and some jobs may not be affected by PSBB because of their ability to work from home. However, not all workers can perform their jobs at home, such as informal sector workers. When some economic activities are closed or restricted (or demand is diminishing to avoid infection), there is a possibility for a significant part of the labor force to face wage reduction, leading to a decrease in household income. Reduction in income forces households to ensure consumption smoothing. As economic mobility is measured using expenditure or spending, the change in expenditure or spending will result in a transition in household economic mobility.
Figure 1: Indonesia Policy Responses Timeline, 2020-2021 Data and Research Methods
Data and Variable
This study examines the impact of policy responses due to Covid-19 and focuses on partial lockdown, namely PSBB policy in 2020 at the districts-level in four districts (Bogor Regency, Bekasi Regency, Bogor City, and Bekasi City). This study selects these four districts because we obtained expenditure, individual, and household characteristics data from the Susenas panel in March 2020 and September 2020, as the subject of focus is households.
Susenas is conducted by Statistic Indonesia (BPS) twice a year, in March and September. In 2020, in response to the Covid-19 pandemic, BPS conducted Susenas in March and September 2020 with a panel sample of households. With panel data, this study can capture the change in household economic mobility during the Covid-19 pandemic. Also, Susenas provides present-day individuals and households’ data during the Covid-19 pandemic. In September 2020, there were several cities or districts which implemented PSBB in Indonesia. However, these four districts are cities or districts that early and constantly implement PSBB from April 2020 until September 2020. These four cities implemented the PSBB for the first time on 10 April 2020, then continued until December 2020.
The outcome variable in this study is intra-generational economic mobility, measured at the household level. The treatment variable is policy responses due to Covid-19 at the district level, focusing on large-scale social restrictions (PSBB) in 2020. The covariates can be
categorized as follows. First, initial household characteristics, such as gender, age, highest education of the head household, household size, household income class, and the number of adults, are measured based on the household level. Second, Covid-19 indicators, such as the Covid-19 fatality rate, number of Covid-19 hospitals, and Covid-19 active cases, are measured at the district level. This study collects the Covid-19 indicators data from the official website of the Indonesia National Task Force for the Acceleration of Covid-19. Third, the initial dummy location includes rural and urban. Fourth, to estimate the effectiveness of social protection programs during pandemics, this study includes the change in household recipients’ status in the Covid-19 social assistance programs as a covariate and will be measured at the household level. The social assistance program consists of conditional cash transfers (Bantuan Sosial Tunai - BST) and unconditional cash transfers (Bantuan Langsung Tunai Dana Desa– BLT DD).
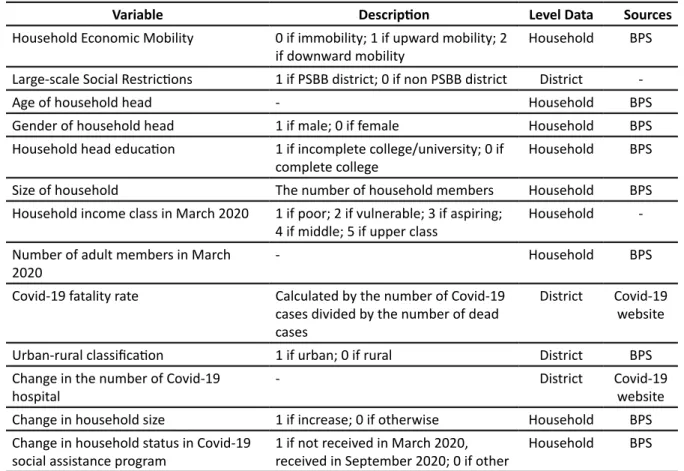
The description of variables is provided in Table 1.
Table 1: Variable Description
Variable Description Level Data Sources
Household Economic Mobility 0 if immobility; 1 if upward mobility; 2
if downward mobility Household BPS
Large-scale Social Restrictions 1 if PSBB district; 0 if non PSBB district District -
Age of household head - Household BPS
Gender of household head 1 if male; 0 if female Household BPS
Household head education 1 if incomplete college/university; 0 if
complete college Household BPS
Size of household The number of household members Household BPS Household income class in March 2020 1 if poor; 2 if vulnerable; 3 if aspiring;
4 if middle; 5 if upper class Household - Number of adult members in March
2020 - Household BPS
Covid-19 fatality rate Calculated by the number of Covid-19 cases divided by the number of dead cases
District Covid-19 website
Urban-rural classification 1 if urban; 0 if rural District BPS
Change in the number of Covid-19
hospital - District Covid-19
website Change in household size 1 if increase; 0 if otherwise Household BPS Change in household status in Covid-19
social assistance program 1 if not received in March 2020,
received in September 2020; 0 if other Household BPS
Before examining the impact of PSBB policy on outcome variables, to provide the counterfactual of treated districts, i.e., determining the control districts, this study employs the Synthetic Control Method (SCM) to construct hypothetical counterfactuals for regions that implemented PSBB policy. This study collects data from Statistics Indonesia (Badan Pusat Statistik - BPS) and the Ministry of Finance for synthetic control method estimation from 2012 to 2020. The data includes poverty rate, own-source revenue (Pendapatan Asli Daerah – PAD), allocation of social assistance programs, mean years of schooling, population density, and the specific allocation fund (Dana Alokasi Khusus-DAK). At the district level, the data includes 127 districts repeated nine years from 2012 until 2020; the total sample is 1,179 observations.
Measuring Household Economic Mobility
Intra-generational household economic mobility describes changes in a household income class between March 2020 and September 2020. However, unlike the measurement of poverty, which has certain thresholds and classifications, there is no clear threshold to categorize households into particular income classes (Dartanto et al., 2020). In some studies,
the precision of the concept to measure mobility is still being determined. Economic mobility may need to be clarified with noise in the data and cause an overestimate because the change in income or expenditure sometimes contains measurement errors. Thus, this study measures economic mobility using per capita consumption expenditures that have less measurement error than income because it is aggregated from detailed expenditures. In addition, consumption expenditures are typically an excellent proxy for the longer-term well-being of the household (Salehi-Isfahani & Majbouri, 2013).
Based on household consumption metrics, to construct dummy intra-generational economic mobility with consistent thresholds over time and capture regional variations in the socio-economic condition, this study adjusted the international threshold from World Bank following steps from Dartanto et al. (2020). First, the World Bank has five income group classifications: the poor, vulnerable, emerging middle, middle class, and upper class, determined by household per capita per day consumption (in 2011 PPP dollars). Those living below US$2.20 per person per day in PPP-adjusted terms are classified as poor. World Bank sets households with per capita per day expenditure between US$2.20-3.30 as vulnerable households. The lower bound for the aspiring middle class is US$3.30 per person per day, while the upper bound is US$7.75 per person per day. The middle class is classified as those whose expenditure is US$7.75-38 per person per day. Further, World Bank sets the upper class as households that consume more than US$ 38 per person per day.
The international dollar thresholds $2.2, $3.3, $7.75, and $38 are multiplied by the 2011 PPP consumption conversion rate from the World Bank conversion rate. The formula is shown in equation 1:
IPLctN $PL PPP2011
c# tN
= (1)
where IPL is the rupiah value of the international dollar threshold; N is the national level; c is
$2.2, $3.3, $7.75, $38, and more than $38; t is SUSENAS March 2020 and September 2020;
$PL is the international dollar threshold for classifying the poor, vulnerable, aspiring class, middle class or upper class based on World Bank classification. Second, for province i, the BPS national poverty line is calculated from the average of the BPS urban and rural poverty line, as in equation 2.
PL PL
2
tN itN
j 1 2
=
/
=(2)
where is the average value of the BPS rural and urban poverty lines and j is the location (1 if rural and 2 if urban). Third, to get the regional variation in the poverty line, this study calculated the ratio of the provincial poverty line to the national poverty line, shown in the equation in 3.
PL PL
PL
prov jti
tN ijt
= (3)
where is the proportion of the provincial poverty line to the national poverty line, and i denotes provinces. Fourth, the international dollar thresholds in the PPP term are multiplied by the regional variation to obtain the rupiah value of the international dollar standard of income classification, which is adjusted with regional variation expressed in equation 4.
$Czjti IPL PL prov
Nct
jti
= # (4)
where is the rupiah value of the provincial threshold for classification of income class. Fifth, the household will be classified as poor, vulnerable, emerging or aspiring, middle class, or upper class when their per capita expenditure (below the threshold).
After classifying the income class, the last step is to identify household economic mobility. This study uses a dummy variable to measure household intra-generational economic mobility. The household that remains in the same income class (immobility) denotes 0; 1 if a household is moving from the low-income class to the higher class (upward mobility); 2 if a household is changing the income class from high to low class (downward mobility).
Synthetic Control Method
The main goal of this research is to estimate the impact of policy response due to Covid-19 on the outcome variable. In many studies, the main challenge of an impact evaluation is to determine what would have happened if the intervention had not existed.
The problem is the missing counterfactual because, at a certain point in time, an individual or a household cannot have two simultaneous existences—an individual or a household cannot be in the treated and the untreated groups simultaneously (Khandker et al., 2010). Ideally, the randomized controlled trial (RCT) represents the golden standard in many studies to estimate the effect of the treatment on a particular outcome between two groups randomly drawn from a pool of similar candidates. One group receives treatment, and the second group does not. Therefore, the treatment’s effect is the difference between the treatment and control groups’ outcomes. However, in this study, it is impossible to randomize the intervention.
To provide a causal relationship, it is important to ensure that treatment and control groups differ only by implementing the PSBB policy. Thus, this study tries to provide counterfactuals for treated districts. First, this study restricts comparison or control districts to districts unaffected by treatments. PSBB was beginning to implement in DKI Jakarta, Bekasi Regency, Bogor Regency, Bogor City, and Bekasi City in April 2020 and then continued to propose in other regions of Indonesia, along with the increased number of covid-19 cases.
Therefore, this study discards other districts that implement PSBB from April 2020 until September 2020 as the potential control units. Second, to address the concern that untreated districts’ characteristics may differ from those of treated districts that may affect household economic mobility, districts with characteristics far from treated districts are excluded as potential control districts (Agarwal & Qian, 2014). Based on these two criteria, this study already has 123 districts as potential control districts. However, using the potential control districts resulting from these two criteria in the regression model may still result in a bias estimation because of the selection bias problem and omitted variable bias.
Abadie & Gardeazabal (2003) proposed the Synthetic Control Methods (SCM) that let the construction of a counterfactual by providing a weighted average of the outcome variable from a group of units similar to the treated unit (Bouttell et al., 2018). The main idea of a synthetic control method, consider a setting where one aggregate entity, such as cities or countries, is exposed to an event or intervention of interest; a combination of unaffected units may provide a more appropriate counterfactual than a single untreated unit. The synthetic control method consists of two basic concepts: (1) the contribution of each control unit to the counterfactual of the treated unit, (2) the similarity between the treated unit and the synthetic control in terms of pre-intervention outcomes and other predictors of post- intervention outcomes.
This study constructed the synthetic of each treated district (Bogor Regency, Bekasi Regency, Bogor City, and Bekasi City) from a weighted average of potential control districts.
This study uses district-level panel data for the period 2012– 2020 to see the pattern of pre- intervention data. The phase is as follows. Let J be the number of potential control regions (districts which never implement PSBB), and W = a vector of non-negative weight which sum to one. Suppose that this study observes J+1 districts in periods 1 and 2. District 1 is exposed to the intervention during periods T0 + 1, …, T. The remaining J districts are an untreated reservoir of potential controls (a donor pool). Let w = (w2 + … + wJ+1) be a collection of weights in synthetic of treated district, with for j = 2, …, J+1 and w2 + … + wJ+1 = 1. Each value of w denotes a potential synthetic control and produces a different “donor pool”. Hence, each treated district in this study may have a different set of donor districts and weights. Let is a (k×1) vector of pre-intervention characteristics for the treated district. Let for each district, j, and time, t, the outcome of interest is and a set of k predictors of the outcome, ,…, , which may include pre-intervention values of and which are themselves unaffected by the intervention.
The vector is chosen to minimize , subject to the weight constraints. The synthetic control
estimator of the impact of the intervention for the treated district in a post-intervention period t (t ≥ T0) is shown in equation 5.
a t Yt j w Y*j jt
J
1 1 2
= - =+1
V
/
(5)A weighted Euclidean norm is usually used to measure the discrepancy between the characteristics of the treated district and the characteristics of the synthetic control, as shown in equation 6.
X1-X w0 = (X1-X w V X0 )' ( 1-X w0 ) (6)
where V is a diagonal matrix with non-negative values in the main diagonal that control the relative importance of gaining a better match between each value in and the corresponding value in . Since depends on V, the choice of V could be subjective, reflecting previous knowledge about the relative importance of each particular outcome variable predictor.
Econometric Models and Estimation
There are no specific classification orders in dummy intra-generational economic mobility regarding the transition of households’ statuses in this study. Thus, the impact of PSBB policy on household economic mobility will be estimated using the multinomial logit model. The multinomial logit model extends binary logit regression, allowing the dependent or outcome variable for more than two categories (Wooldridge, 2010). The estimation model is expressed in equation 7.
Eco Mobi PSBBi j v Xj ij ui J
1 1
a b
= + +
/
= + (7)where is the movement of households i between income classes. The dependent variable of intra-generational economic mobility can be defined as follow. Intra-generational economic mobility denotes 0 if households remain in the same class (immobility); 1 if a household moves from the low-income class to higher class (upward mobility); 2 if a household is changing the income class from high to low class (downward mobility). is dummy PSBB, 1 if PSBB districts;
0 if non-PSBB districts. Including confounding variables that have created an open backdoor path is important to establish the causal inference of PSBB to outcome variables. This study tries to identify covariates that can close that path in the model. includes a set of covariates, such as gender, age, highest education of the head household, household size, household income class, number of adults age 60 above, Covid-19 fatality rate, change in the number of Covid-19 hospitals, change in household size, location (urban-rural), and change in beneficiary status of social assistance programs potentially related to the PSBB and household economic mobility. represents error term and i indicates the household (i = 1, 2,…,n). The coefficient shows the impact of the PSBB on household intragenerational economic mobility.
Finding and Discussion
Data Description and Exploration
Providing the descriptive statistics of variables used in this research is essential to enrich the analysis and support the main findings.
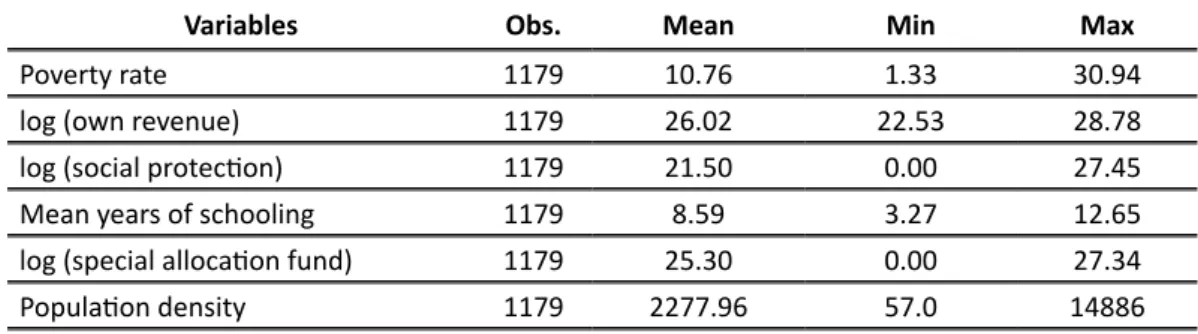
Table 2: Summary Statistics of Variable Used in Synthetic Control Method, 2012-2020
Variables Obs. Mean Min Max
Poverty rate 1179 10.76 1.33 30.94
log (own revenue) 1179 26.02 22.53 28.78
log (social protection) 1179 21.50 0.00 27.45
Mean years of schooling 1179 8.59 3.27 12.65
log (special allocation fund) 1179 25.30 0.00 27.34
Population density 1179 2277.96 57.0 14886
Source: Authors’ calculation. (Data retrieved from BPS and Ministry of Finance, 2012-2020)
Table 2 summarizes the outcome and predictor variables used in the synthetic control method. During the observation period, the poverty rate in our samples ranges from 1.33%
to 30.94%.
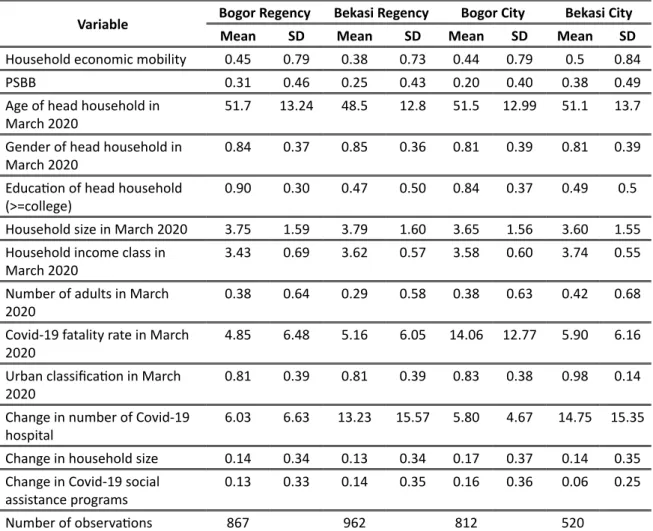
Table 3 summarizes the variable of interest and control variables for overall districts in each model. The total sample for each district is different because of the different number of donor pools resulting from the synthetic control method. This study only includes districts with a weight of more than zero in the donor pool.
Table 3: Summary Statistics of Selected Variables for Overall Districts
Variable Bogor Regency Bekasi Regency Bogor City Bekasi City
Mean SD Mean SD Mean SD Mean SD
Household economic mobility 0.45 0.79 0.38 0.73 0.44 0.79 0.5 0.84
PSBB 0.31 0.46 0.25 0.43 0.20 0.40 0.38 0.49
Age of head household in
March 2020 51.7 13.24 48.5 12.8 51.5 12.99 51.1 13.7
Gender of head household in
March 2020 0.84 0.37 0.85 0.36 0.81 0.39 0.81 0.39
Education of head household
(>=college) 0.90 0.30 0.47 0.50 0.84 0.37 0.49 0.5
Household size in March 2020 3.75 1.59 3.79 1.60 3.65 1.56 3.60 1.55 Household income class in
March 2020 3.43 0.69 3.62 0.57 3.58 0.60 3.74 0.55
Number of adults in March
2020 0.38 0.64 0.29 0.58 0.38 0.63 0.42 0.68
Covid-19 fatality rate in March
2020 4.85 6.48 5.16 6.05 14.06 12.77 5.90 6.16
Urban classification in March
2020 0.81 0.39 0.81 0.39 0.83 0.38 0.98 0.14
Change in number of Covid-19
hospital 6.03 6.63 13.23 15.57 5.80 4.67 14.75 15.35
Change in household size 0.14 0.34 0.13 0.34 0.17 0.37 0.14 0.35
Change in Covid-19 social
assistance programs 0.13 0.33 0.14 0.35 0.16 0.36 0.06 0.25
Number of observations 867 962 812 520
Based on the threshold in equation 4, this study provides the transition of household economics between income classes between March 2020 and September 2020, as shown in Figure 2. The figure of intra-generational economic mobility shows that middle-class households dominate the expenditure distribution in almost all districts, but this group also seems very vulnerable during the pandemic. From March 2020 to September 2020, middle- class households are more likely to fall into a lower class or remain in the same class than move into a higher class.
In March 2020, no household was classified as poor based on the World Bank classification in Bekasi Regency, Bogor City, and Bekasi City. However, in September 2020, the number of poor households increased by 0.1%, 1%, and 0.5% in Bekasi Regency, Bogor City, and Bekasi City, respectively. In Bogor Regency, around 9.1% of households were classified as vulnerable in March 2020, increasing to 15.4% in September 2020. Most of the new vulnerable households are from emerging class households. Similarly, in the Bekasi Regency, the percentage of households in vulnerable groups also increased from 2.1% to 2.3%. In addition, in Bogor City, 2.3% of households are in vulnerable groups, while in Bekasi City, the percentage of vulnerable households reached 2.1% in September 2020. In contrast, although
some households struggled during the Covid-19 pandemic, some households successfully climbed into the higher income class. In Bekasi Regency, the proportion of households classified as upper-class increased from 1.6% to 4% in September 2020.
Figure 2: Intra-generational Economic Mobility, March 2020-September 2020 (number of household)
Synthetic Control Method Results
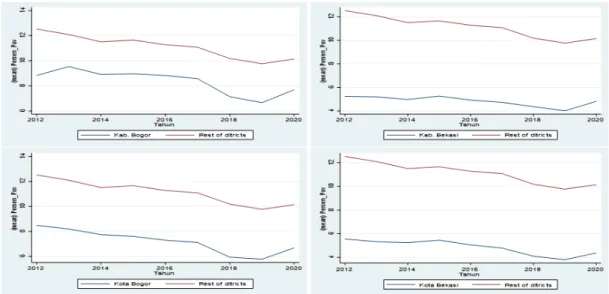
This study uses 123 districts out of 514 districts in Indonesia. Potential comparison districts were selected based on districts that never implemented PSBB policy and have relatively similar characteristics with treated districts. To examine if the potential control group provides appropriate counterfactuals for treated districts, this study plots the poverty rate trends between treated and potential control districts in Figure 3. The economic mobility data is not available annually; thus, this study uses poverty rates as a proxy for the change in the welfare of each region.
Figure 3: Trends in Poverty Rate of Treated Districts and the Rest of Untreated Districts, 2012-2020
Based on the poverty rate trend, including 127 districts show similar trends between treated districts and potential control districts but with different trajectories. In order to
have a meaningful statement about the estimation results, it must be clear to determine whether groups of units are endogenously selected into treatment, the presence of omitted variable biases, potential sources of selection bias, and open backdoor paths. Such traditional endogeneity requires more than merely visualizing parallel leads (Cunningham, 2021).
Technically, pre-intervention similarities are neither necessary nor sufficient to ensure parallel counterfactual trends (Kahn-Lang & Lang, 2020).
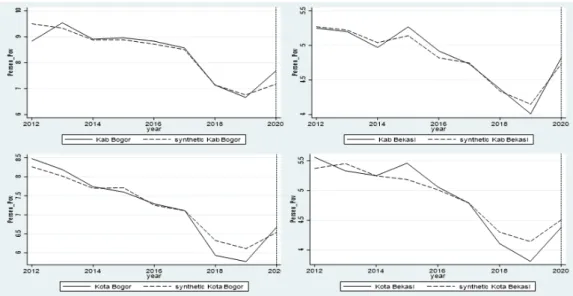
The results of the synthetic control method are shown in Figure 4 and Table 4, which compare the pre-treatment characteristics of the real-treated districts with the synthetic- treated districts. Figure 4 displays that, based on the result from the synthetic control method, the poverty rate in the synthetic of treated districts shows a more similar trajectory with treated districts during the study period. The synthetic control method prevents the estimation of extreme counterfactuals, which means those counterfactuals fall far outside the convex hull of the data.
Figure 4: Trends in Poverty Rate of Treated Districts and the Synthetic of Treated Unit, 2012-2020
Table 4 shows a value of diagonal matrices to minimize the mean squared prediction error of the poverty rate in treated districts before the intervention period. The resulting value of the diagonal element of matrix V associated with the population density variable is very small. Given the other variables in Table 4, it indicates that population density has little power to predict the poverty rate in all treated districts before implementing the PSBB policy.
Table 4: Poverty Rate Predictor Means
Variables Bogor Regency Bekasi Regency Bogor City Bekasi City Treated Synthetic Treated Synthetic Treated Synthetic Treated Synthetic
Log(own revenue) 28.32 27.62 28.12 27.43 27.19 27.16 28.01 27.84
Log(social protection) 23.88 22.59 20.98 21.37 22.96 21.96 23.97 22.66
Mean years of schooling 7.75 9.56 8.62 8.66 10.12 10.37 10.76 10.36
Log(special allocation) 26.55 25.32 25.54 25.45 24.69 24.63 25.18 24.96 Population density 1964.4 4062.99 2664.1 2951.8 9091.2 8756.98 13132.4 5055.8
Poverty rate in 2013 9.54 9.33 5.2 5.22 - - 5.33 5.45
Poverty rate in 2019 6.66 6.76 4.01 4.15 5.77 6.11 3.81 4.14
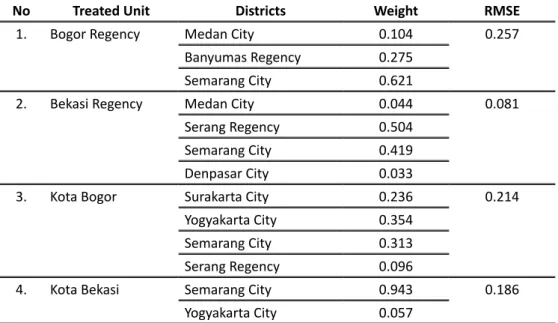
Based on the result from the synthetic control method, this study only includes districts with a weight more than zero into estimation, as shown in Table 5. This study also reports pre- treatment RMSPE (root mean square prediction error). The idea is that the RMSPE will be small prior to intervention, and if there is an effect, the RMSPE will be large after treatment.
Table 5: Districts Weights in the Synthetic Treated Districts
No Treated Unit Districts Weight RMSE
1. Bogor Regency Medan City 0.104 0.257
Banyumas Regency 0.275
Semarang City 0.621
2. Bekasi Regency Medan City 0.044 0.081
Serang Regency 0.504
Semarang City 0.419
Denpasar City 0.033
3. Kota Bogor Surakarta City 0.236 0.214
Yogyakarta City 0.354
Semarang City 0.313
Serang Regency 0.096
4. Kota Bekasi Semarang City 0.943 0.186
Yogyakarta City 0.057
The Impact of PSBB on Household Economic Mobility
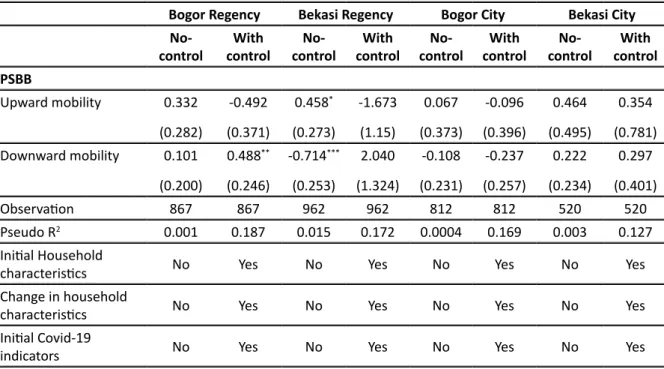
In order to estimate the impact of PSBB policy on economic mobility, this study employs multinomial logit models. Table 6 provides the coefficient estimation of PSBB policy on household intra-generational economic mobility with immobility as the base outcome.
Before considering the potential confounder variables, the PSBB alone does not significantly affect household economic mobility in all treated districts. However, the coefficient might be misleading as the PSBB is not random in the model, and the presence of confounders between PSBB and household economic mobility should be controlled.
Table 6: Multinomial Logit Model Resultsa
Bogor Regency Bekasi Regency Bogor City Bekasi City controlNo- With
control No-
control With
control No-
control With
control No-
control With control PSBB
Upward mobility 0.332 (0.282)
-0.492 (0.371)
0.458* (0.273)
-1.673 (1.15)
0.067 (0.373)
-0.096 (0.396)
0.464 (0.495)
0.354 (0.781) Downward mobility 0.101
(0.200)
0.488**
(0.246)
-0.714***
(0.253)
2.040 (1.324)
-0.108 (0.231)
-0.237 (0.257)
0.222 (0.234)
0.297 (0.401)
Observation 867 867 962 962 812 812 520 520
Pseudo R2 0.001 0.187 0.015 0.172 0.0004 0.169 0.003 0.127
Initial Household
characteristics No Yes No Yes No Yes No Yes
Change in household
characteristics No Yes No Yes No Yes No Yes
Initial Covid-19
indicators No Yes No Yes No Yes No Yes
Bogor Regency Bekasi Regency Bogor City Bekasi City controlNo- With
control No-
control With
control No-
control With
control No-
control With control Change in Covid-19
indicators No No No Yes No No No No
Location No Yes No Yes No Yes No Yes
Change in status social
assistance program No Yes No Yes No Yes No Yes
Note: Robust Standard errors are in parentheses with * p < 0.1, ** p < 0.05, *** p < 0.01
a “immobility” as base outcome
As shown in estimation results, after including a list of control variables, in Bogor Regency, the result of the multinomial logit statistically confirms that PSBB significantly affects households’ ability to move from high-income to low-income. In contrast, based on the estimation, the implementation of PSBB in Bekasi Regency, Bogor City, and Bekasi City does not statistically significantly affect households’ economic mobility. Most of the confounders in this study, such as the educational attainment of household head, household size, initial income class household, and location, significantly explain the variations of household economic mobility. Therefore, considering the PSBB policy alone on the right-hand side will cause bias in household economic mobility coefficient estimation.
Table 7 shows the average partial effect of change in the household economic mobility responding to the implementation of PSBB in Bogor Regency, Bekasi Regency, Bogor City, and Bekasi City. The partial effects (the predicted probability of household economic mobility) were evaluated at the mean of independent variables. Based on estimation results, the implementation of PSBB in Bogor Regency causes households to have a higher probability of moving down into the lower-income class by 0.065%. Similarly, in Bekasi Regency, living in a district that implements PSBB significantly decreases households’ probability of moving from low-income to higher-income by 0.097%. Meanwhile, the implementation of PSBB does not significantly affect the households’ economic mobility in Bogor City and Bekasi City.
Table 7: Average Partial Effect, Economic Mobility as the Dependent Variable
Bogor Regency Bekasi Regency Bogor City Bekasi City controlNo- With
control No-
control With
control No-
control With
control No-
control With control PSBB
Immobility -0.033
(0.035) -0.046
(0.034) 0.038
(0.033) -0.092
(0.128) 0.012
(0.038) 0.032
(0.033) -0.051
(0.043) -0.044 (0.053) Upward mobility 0.022
(0.021) -0.019
(0.012) 0.050*
(0.025) -0.097*
(0.056) 0.005
(0.021) -0.001
(0.006) 0.016
(0.019) 0.008 (0.019) Downward
mobility 0.010
(0.031) 0.065*
(0.033) -0.088***
(0.025) 0.190
(0.123) -0.017
(0.034) -0.031
(0.033) 0.035
(0.041) 0.036 (0.051)
Observation 867 867 962 962 812 812 520 520
Pseudo R2 0.001 0.187 0.015 0.172 0.000 0.169 0.003 0.127
Initial Household
characteristics No Yes No Yes No Yes No Yes
Change in household
characteristics No Yes No Yes No Yes No Yes
Initial Covid-19
indicators No Yes No Yes No Yes No Yes
Bogor Regency Bekasi Regency Bogor City Bekasi City controlNo- With
control No-
control With
control No-
control With
control No-
control With control Change in
Covid-19
indicators No No No Yes No No No No
Location No Yes No Yes No Yes No Yes
Change in status social assistance
program No Yes No Yes No Yes No Yes
Note: Robust Standard errors are in parentheses with * p < 0.1, ** p < 0.05, *** p < 0.01
Educational data from BPS may explain the estimation results of four districts. Many studies have proven that educational attainment is a critical determinant of economic mobility. Our regression results also show that the educational attainment of head households is a consistently significant factor affecting households’ transition between income classes.
Based on data from BPS, Bogor Regency has mean years of schooling lower than the three other districts. In 2020, Bogor Regency and Bekasi Regency had mean years of schooling around 12.48 and 13.09, respectively, while Bogor City and Bekasi City were 13.41 and 14, respectively. Lower mean years of schooling indicate that regions or district also has lower human capital, which increases the probability of being chronically poor, and declines the ability of a household to respond to transitory shocks (Dartanto & Nurkholis, 2013).
Furthermore, Fields et al. (2003) and Woolard & Klasen (2005) stated that the principal focus of mobility analysis should be the labor market because shifting in employment status and sector in a mass unemployment situation are among the biggest determinants of household economic mobility. The unemployment rate in Bogor Regency has increased significantly compared to the other three districts. In Bogor Regency, the unemployment rate increased by 5.18% in 2020, while in Bekasi Regency, Bogor City, and Bekasi City, the unemployment rate increased by 2.54%, 3.52%, and 2.38%, respectively.
Mitigating The Effect of Implemented Policy
A growing economics literature on Covid-19 has been developed since the spread of Covid-19 began. Many studies focus on examining the growth rate of Covid-19, the impact on macroeconomic indicators, or mitigating the impact of implemented policy. Implementing PSBB may successfully downtrend the outbreak of Covid-19, but it also potentially has negative impacts due to widespread business closure and strict mobility restrictions. In order to mitigate the economic losses, the Indonesian government has allocated approximately IDR 695.2 trillion through the National Economic Recovery (PEN) program to address health impacts, support domestic consumption, and deal with rapidly worsening poverty and unemployment (UNICEF et al., 2021). The government targets social assistance to poor households, job seekers, and laid-off workers (Olivia et al., 2020). There are concerns about the effectiveness of social assistance programs to prevent economic losses and how precisely these programs in terms of targeting. This study attempts to present the proportion of households that benefited from four major social assistance programs, namely the Family Hope Program (Program Keluarga Harapan-PKH), Non-Cash Food Assistance (Bantuan Pangan Non-Tunai-BPNT), Cash Social Assistance (Bantuan Sosial Tunai - BST), and Direct Cash Transfer Village Fund (Bantuan Langsung Tunai Dana Desa – BLT DD) as of September 2020 in four districts (Bogor Regency, Bekasi Regency, Bogor City, and Bekasi City) shown in Figure 4.
As shown in Figure 4, Bogor Regency has the highest proportion of households that received four major social assistance programs. However, the implementation of PSBB still significantly and adversely affects household economic mobility in Bogor Regency. It may be because the proportion of informal workers and the unemployment rate in Bogor Regency is
higher than in the other three districts. According to BPS, in 2020, the unemployment rate in Bogor was 14.29%. Meanwhile, in Bekasi Regency, Bogor City, and Bekasi City was 11.54%, 12.68%, and 10.68%, respectively. In addition, the proportion of informal employees in Bogor Regency is also higher than in the other three districts. In 2020, the proportion of informal workers was 51.30%, while in Bekasi Regency, Bogor City, and Bekasi City, the proportion was 41.85%, 42.15%, and 34.8%, respectively. Informal workers often run small businesses, have poor, less diversified income, and may need to work in crowded public spaces, leading them to face significant disruption because of PSBB policy (Khoirunurrofik et al., 2021; Olivia et al., 2020; Sparrow et al., 2020).
Meanwhile, in Bekasi Regency, the rise of the unemployment rate is lower than in Bogor City. Data from Susenas September 2020 shows that the percentage of beneficiary social assistance programs households in the Bekasi Regency is still lower than the other three districts. Mean years of schooling in Bekasi Regency is also the second lowest above Bogor Regency, indicating that job choice is also limited with lower educational attainment, especially during mass unemployment.
Figure 4: Proportion of Households Receiving the Benefits of Social Assistance Programs as of September 2020, by percentile (%)
To sum up, implementing PSBB may not significantly affect household economic mobility in Bogor City and Bekasi City. It is not only because of the support of social assistance programs but also the resilience of each district that came from regional economic structures and the quality of human capital. As shown in Figure 4, although the proportion of household that receives social protection is higher in Bogor Regency and Bekasi Regency because the unemployment rate and the proportion of informal workers are also higher, the Covid-19 pandemic still affects household economic mobility significantly. In addition, data from BPS also support the regression results. Bogor Regency has a mean of years of schooling, and the human development index is lower than the other three districts. In 2020, Bogor Regency had mean years of schooling of around 12.48, while Bekasi Regency, Bogor City, and Bekasi City were 13.09, 13.41, and 14.0, respectively. Lower mean years of schooling indicate that a region or district also has lower human capital, increases the probability of being chronically poor, and declines the ability of a household to respond to transitory shocks. In 2020, the
human development index in Bogor Regency was 70.40, while in Bekasi Regency, Bogor City, and Bekasi City were 74.07, 76.11, and 81.5, respectively.
Therefore, to successfully mitigate the economic impact of the PSBB policy, apart from allocating social assistance, the Indonesian government needs to pay attention to informal sector workers by giving them stimulus and substantial knowledge to sell their products, for example, through e-commerce. Furthermore, since the investment in human capital is a long- term process, to overcome the lower educational attainment problem during the crisis, non- formal training provisions such as workshops can be a promising solution. Public or ministry- operated training institutions, private training institutions, and other course providers can provide the non-formal training program. This training program is expected to elevate jobseekers’ and lay-off workers’ skills in addition to what they get at formal education. The Pre-Employment Card Program (Kartu Prakerja) is one of the Indonesian government programs that can fulfill this provision. The Pre-Employment Card Program combines temporary social assistance with skills development that aims to boost productivity and income, provide links for further learning for laid-off workers and job seekers, and build the resilience of the poor.
Conclusion
This study examines the impact of implementing PSBB policy on household economic mobility. Examining household economic mobility during the PSBB period will help some light on suitable policy action for the government to prevent widening inequality. The negative impact of PSBB may lead households to move from higher-income class to lower-income class or even lock up households in bottom income class. Our Regression model shows that the enactment of PSBB policy only significantly affects economic mobility in rural districts, namely Bogor Regency and Bekasi Regency. In contrast, the implementation of the PSBB policy does not significantly affect household economic mobility in more urbanized districts of Bogor City and Bekasi City in the short run.
Based on estimation results and supporting data, this study concludes that the effect’s mechanism or the resilience of each district during the implementation of the PSBB is through educational attainment and employment status (unemployment rate and informal workers). Thus, the Covid-19 pandemic has given the government a view on the importance of educational attainment and labor force participation in increasing the resilience of a region against economic shocks. The government needs to acknowledge the territorial differences in which rural areas tend to be disadvantaged from the adverse effect of the containment policy of the pandemic when proposing policy responses. Furthermore, the allocation of social assistance programs is a promising solution to address the negative impact of implemented policy. However, it also must be supported with the provision of non-formal training that can elevate the capability of jobseekers and laid-off workers. Again, considering the impact of PSBB is adversely affected in rural areas, the accuracy of targeting recipients of social assistance programs and affirmation training provision in favor of rural areas is desirable.
Declarations
All authors have read and agreed to the published version of the manuscript.
Conflict of Interests
The authors declare no conflict of interest.
Availability of Data and Materials
Data and material are provided with request.
Author’s Contribution
SJA and RN conceptualized the study. Original draft preparation: SJA. Review and
Editing: RN.
Funding Sources
Funding source of this study is from authors.
Acknowledgments
The authors are thankful to Badan Pusat Statistik (BPS) and University of Indonesia for supporting this study.
References
Abadie, A., & Gardeazabal, J. (2003). The economic costs of conflict: A case study of the Basque country. American Economic Review, 93(1), 113–132. https://doi.
org/10.1257/000282803321455188
Agarwal, S., & Qian, W. (2014). Shocks : Evidence from a Natural Experiment in Singapore.
American Economic Review, 104(12), 4205–4230.
Alam, K., & Mahal, A. (2014). Economic impacts of health shocks on households in low and middle income countries: A review of the literature. Globalization and Health, 10(1).
https://doi.org/10.1186/1744-8603-10-21
Almeida, V., Barrios, S., Christl, M., De Poli, S., Tumino, A., & van der Wielen, W. (2021). The impact of COVID-19 on households´ income in the EU. Journal of Economic Inequality, 19(3), 413–431. https://doi.org/10.1007/s10888-021-09485-8
Baulch, B., & Hoddinott, J. (2000). Economic mobility and poverty dynamics in developing countries. Journal of Development Studies, 36(6), 1–24. https://doi.
org/10.1080/00220380008422652
Beegle, K., Weerdt, J. D., & Dercon, S. (2011). Migration and Economic Mobility in Tanzania : Evidence from a Tracking Survey. The Review of Economics and Statistics, 93(3), 1010–
1033.
Blundell, R., Costa Dias, M., Joyce, R., & Xu, X. (2020). COVID-19 and Inequalities. Fiscal Studies, 41(2), 291–319. https://doi.org/10.1111/1475-5890.12232
Bouttell, J., Craig, P., Lewsey, J., Robinson, M., & Popham, F. (2018). Synthetic control methodology as a tool for evaluating population-level health interventions. Journal of Epidemiology and Community Health, 72(8), 673–678. https://doi.org/10.1136/jech- 2017-210106
Carroll, D. R., & Chen, A. (2016). Income Inequality Matters, but Mobility Is Just as Important.
Economic Commentary (Federal Reserve Bank of Cleveland), 2005, 1–6. https://doi.
org/10.26509/frbc-ec-201606
Chen, H., Qian, W., & Wen, Q. (2020). The Impact of the COVID-19 Pandemic on Consumption:
Learning from High Frequency Transaction Data. SSRN Electronic Journal, 1–28. https://
doi.org/10.2139/ssrn.3568574
Chetty, R., Friedman, J. N., Hendren, N., & Stepner, M. (2020). The Economic Impacts of Covid-19: Evidence from a New Public Database Built Using Private Sector Data. (Working Paper 27431). https://doi.org/10.3386/w27431
Christelis, D., Georgarakos, D., Jappelli, T., & Kenny, G. (2020). The COVID-19 Crisis and Consumption: Survey Evidence from Six EU Countries. SSRN Electronic Journal, 2507.
https://doi.org/10.2139/ssrn.3751097
Cunningham, S. (2021). Causal Inference: The Mixtape. Connecticut: Yale University Press.
Dartanto, T., Moeis, F. R., & Otsubo, S. (2020). Intra-generational Economic Mobility in Indonesia: A Transition from Poverty to the Middle Class in 1993–2014. Bulletin of Indonesian Economic Studies, 56(2), 193–224. https://doi.org/10.1080/00074918.2019 .1657795
Dartanto, T., & Nurkholis. (2013). The determinants of poverty dynamics in Indonesia: evidence from panel data. Bulletin of Indonesian Economic Studies, 49(1), 61–84. https://doi.org/1 0.1080/00074918.2013.772939
Di Crosta, A., Ceccato, I., Marchetti, D., la Malva, P., Maiella, R., Cannito, L., Cipi, M., Mammarella, N., Palumbo, R., Verrocchio, M. C., Palumbo, R., & Domenico, A. Di. (2021). Psychological factors and consumer behavior during the COVID-19 pandemic. PLoS ONE, 16(8), 1–23.
https://doi.org/10.1371/journal.pone.0256095
Fields, G. S. (2000). DigitalCommons @ ILR Income Mobility : Concepts and Measures Income . Washington, DC: The Brookings Institution Press
Fields, G. S., & Ok, E. A. (1999). The Measurement of Income Mobility: An Introduction to the Literature. In Handbook of Income Inequality Measurement, pp. 557–598. https://doi.
org/10.1007/978-94-011-4413-1_20
Gibson, J., & Olivia, S. (2020). Direct and Indirect Effects of Covid-19 On Life Expectancy and Poverty in Indonesia. Bulletin of Indonesian Economic Studies, 56(3), 325–344. https://
doi.org/10.1080/00074918.2020.1847244
Indonesia: WHO Coronavirus Disease (COVID-19) Dashboard With Vaccination Data | WHO Coronavirus (COVID-19) Dashboard With Vaccination Data. (n.d.). Retrieved from https://
covid19.who.int/region/searo/country/id
Jafar, R., & Meilvidiri, W. (2022). Decision Making Under Uncertainty Market During Covid-19.
JDE (Journal of Devel-oping Economies), 7(1), 84-99. https://doi.org/10.20473/jde.
v7i1.21243
Kahn-Lang, A., & Lang, K. (2020). The Promise and Pitfalls of Differences-in-Differences:
Reflections on 16 and Pregnant and Other Applications. Journal of Business and Economic Statistics, 38(3), 613–620. https://doi.org/10.1080/07350015.2018.1546591
Kansiime, M. K., Tambo, J. A., Mugambi, I., Bundi, M., Kara, A., & Owuor, C. (2021). COVID-19 implications on household income and food security in Kenya and Uganda: Findings from a rapid assessment. World Development, 137, 105199. https://doi.org/10.1016/j.
worlddev.2020.105199
Khandker, S., Gayatri, S., & Hussain, K. (2010). Handbook on Impact Evaluation : Quantitative Methods and Practices. World Bank.
Khoirunurrofik, K., Abdurrachman, F., & Putri, L. A. M. (2021). Half-Hearted Policies on Mobility Restrictions during COVID-19 in Indonesia: A Portrait of Large Informal Economy Country. Transportation Research Interdisciplinary Perspectives, 13, 100517. https://doi.
org/10.1016/j.trip.2021.100517
Kim, S., Koh, K., & Zhang, X. (2020). Short-term Impacts of COVID-19 on Consumption and Labor Market Outcomes: Evidence from Singapore. SSRN Electronic Journal, 13354.
https://doi.org/10.2139/ssrn.3612738
Loungani, P., Ostry, J., Furceri, D., & Pizzuto, P. (2021). Will COVID-19 Have Long-Lasting Effects on Inequality? Evidence from Past Pandemics. IMF Working Papers, 2021(127), 1. https://
doi.org/10.5089/9781513582375.001
Martin, A., Markhvida, M., Hallegatte, S., & Walsh, B. (2020). Socio-Economic Impacts of