Rustem Ismagilov – Thank you for accepting me into your lab and training me to be a scientifically rigorous researcher. Shapiro – Thank you for accepting me as a rotation student and for your support throughout the years. Dmitriy Zhukov – Thank you for accepting me and training me during my first year of research.
Si Hyung Jin – I thank you for being such a generous, intelligent and responsible colleague and collaborator.
LIST OF ILLUSTRATIONS AND/OR TABLES
OVERVIEW
If the POC test is not sufficiently robust, the accuracy and usefulness of the test will suffer. Usually these antigens are peptides displayed on the surface of the pathogen or antibodies developed by the host (serology testing). While NAAT excels with its high sensitivity and specificity, NAAT does not meet any of the remaining POC requirements (requiring highly trained users in centralized laboratories with expensive and bulky equipment).
The Director-General of WHO summarizes the outcome of the Emergency Committee regarding clusters of microcephaly and Guillain-Barré syndrome.
TWO-PHASE WASH TO SOLVE THE UBIQUITOUS CONTAMINANT-CARRYOVER PROBLEM IN COMMERCIAL
NUCLEIC-ACID EXTRACTION KITS
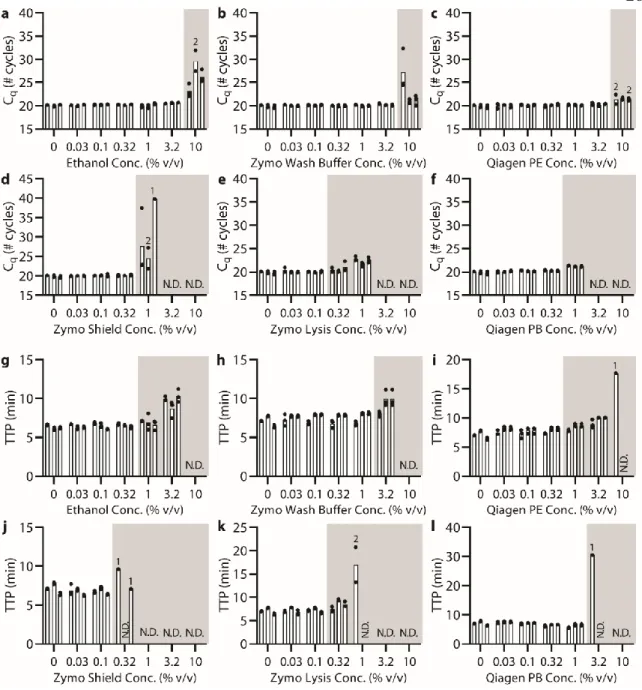
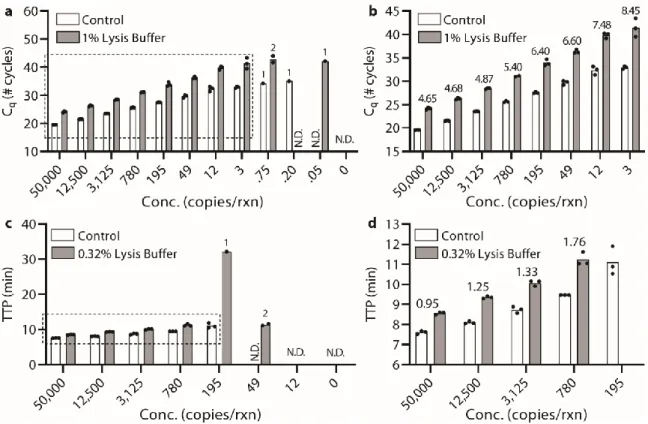
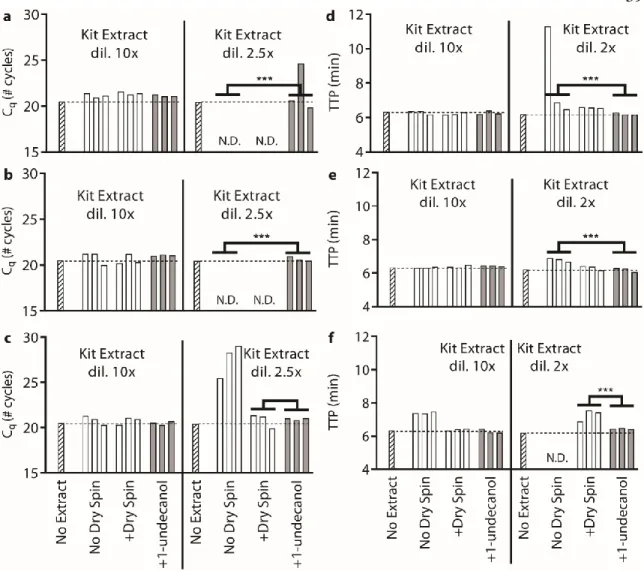
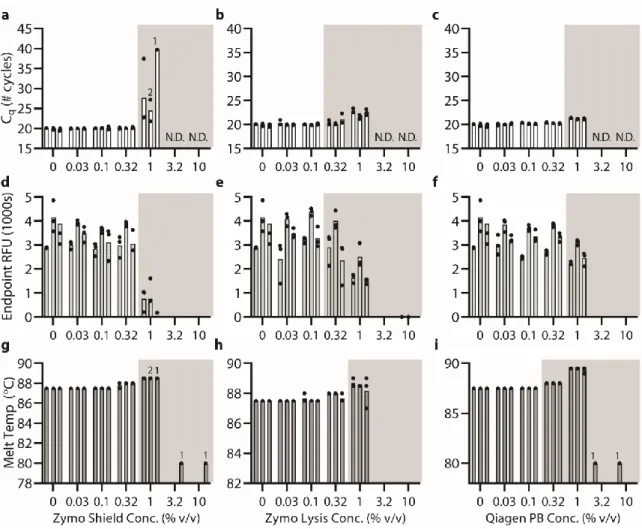
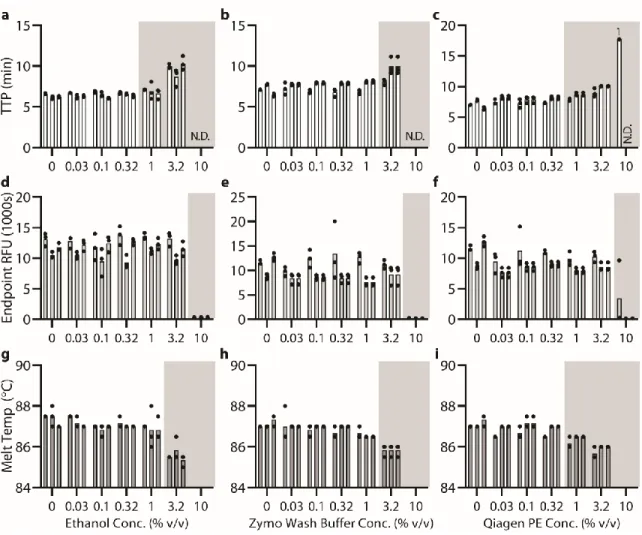
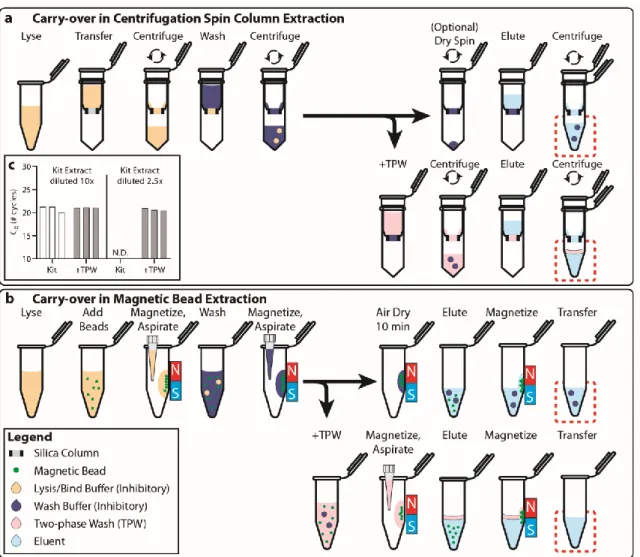
Below (section "TPW validation for magnetic bead extractions"), we explicitly examine the extent of buffer carryover for magnetic bead extractions using low and high dilution eluent. Overall, we found that the addition of 1-undecanol TPW greatly improved qPCR and LAMP performance at low dilution (Figure 2.4c-d). In total (Figures 2.4-5) we ran 27 reactions (9 columns) following the manufacturer's protocol and compared to 27 reactions (9 columns) with the added 1-undecanol wash.
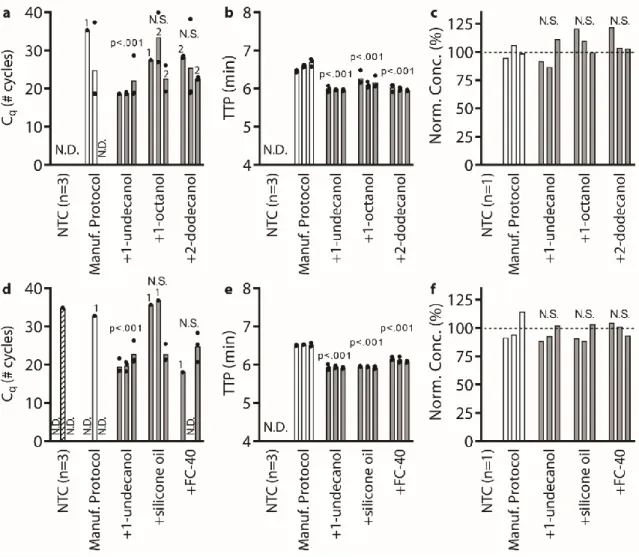
Next, we evaluated whether the TPW meets criterion 3 (NAs are effectively eluted from the column during the TPW or are lost due to premature elution or incomplete elution) (Figure 2.5c,f). Dashed lines show Cq or TTP for a reaction without inhibitors (“No extract”). a-f) We asked whether the manufacturer's protocol replicates (“No dry spin for Zymo kits, “+dry spin” for Qiagen kit) fell within the 95% CI of the corresponding +1-undecanol condition for the low kit extract dilution case. Qiagen kit and LAMP (Figure 2.6f) we observe total reaction inhibition without dry spin and a 1.1 min delay according to the manufacturer's protocol.
COMMERCIAL STOCKS OF SARS-COV-2 RNA MAY REPORT LOW CONCENTRATION VALUES, LEADING TO ARTIFICIALLY
INCREASED APPARENT SENSITIVITY OF DIAGNOSTIC ASSAYS
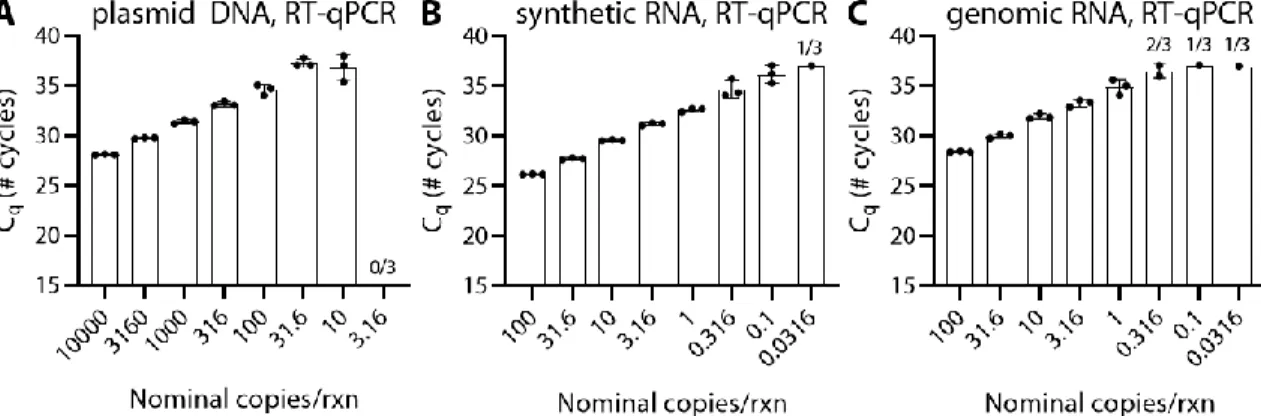
For synthetic RNA, the actual concentration measured by RT-dPCR for one lot was 770% of the label concentration and for another lot was 57% of the label concentration. For genomic RNA, the concentration measured by RT-dPCR for one lot was 240% of the label concentration and for another lot it was 300% of the label concentration. From this measurement, we calculated a stock concentration of 2.2x10⁴ copies/µL, which is 11% of the supplier's label concentration of 2x10⁵ copies/µL.
For synthetic RNA (BEI, lot), we observed that all RT-dPCR quantifications were systematically higher than the supplier's label concentration of 5x10⁵ copies/µL (Figure 3.2B). From this measurement, we calculated a stock concentration of 3.9x10⁶ copies/µL, which is 770% of the supplier's label concentration of 5 x 10⁵. For genomic RNA (BEI, lot) we observed that all RT-dPCR quantifications were systematically higher than the supplier's label concentration of 5.5 x 10⁴ copies/µL (Figure 3.2C).
From this measurement, we calculated a stock concentration of 1.3x10⁵ copies/µL, which is 240% of the supplier's label concentration of 5.5x10⁴. From this measurement, we calculated a concentration of 1.4x10⁵ copies/µL, which is 300% of the label concentration of 4.8x10⁴. In this chapter, we noted large discrepancies in the analytical sensitivity of the CDC-recommended RT-qPCR protocol based on which the commercial NA stock was used.
Specifically, using RT-dPCR, the concentration of plasmid DNA (IDT, lot 508728) was measured to be 11% of the label concentration. The template was added at 10% of the reaction mixture and the original concentration was calculated from the dilution series.
EVALUATING 3D PRINTING TO SOLVE THE SAMPLE-TO- DEVICE INTERFACE FOR LRS AND POC DIAGNOSTICS
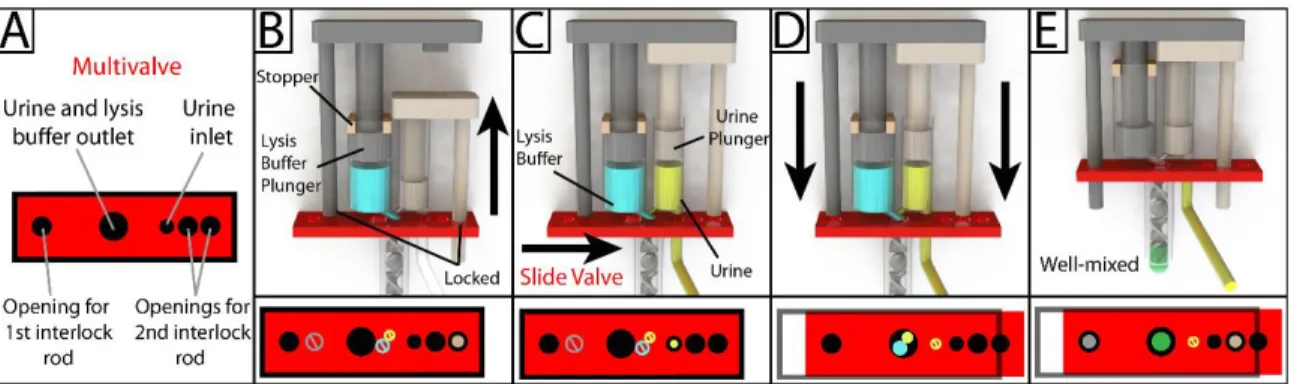
In the initial position, the urine track block blocks the slide of the multivalve, and the multivalve blocks the movement of the lysis buffer track (Figure 4.1A). To ensure reliable operation of the device, all seals in the device must be hermetically sealed. During operation of the device, the urine piston is pulled up until it contacts the bottom of the lysis buffer piston.
In this way, the end user does not have to consider the handling of the lysis buffer during device operation. On the millimeter scale, there was no noticeable delay between the withdrawal of the urinary plunger and the filling of the urinary chamber. The ratio of solution ejected from the lysis buffer chamber and the urine chamber was calculated by measuring the absorbance of the final ejected solution and comparing it to the green dye loaded into the lysis buffer chamber.
We found that the released volumes from the lysis buffer chamber and the urine chamber were similar, with percentage deviations of 2.5% and 6.6%. To mount, the urine plunger was first inserted into the main chamber urine chamber, followed by the lysis buffer plunger into the lysis buffer chamber. The two plunger stoppers were then inserted, locking the top position of the lysis buffer plunger.
For these joints, the outer diameter of the static mixer housing (8 mm) and the outer diameter of the urine suction tube (4.5 mm) are exactly the same as the diameter of the adapters on the main body. Due to the versatility of the metering mixer, it can be used in a variety of applications.
READING OUT SINGLE-MOLECULE DIGITAL RNA AND DNA ISOTHERMAL AMPLIFICATION IN NANOLITER VOLUMES WITH
UNMODIFIED CAMERA PHONES
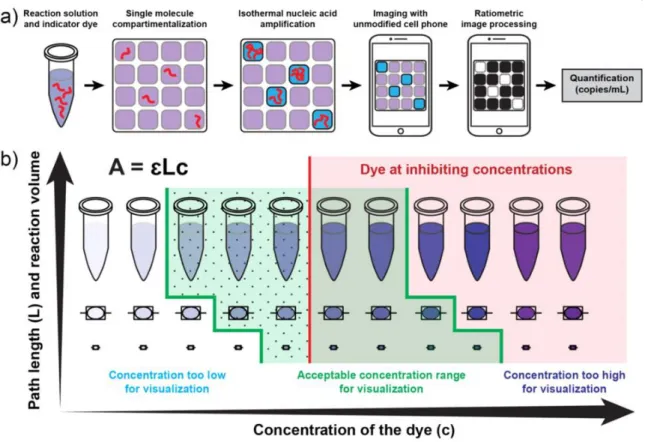
A visual readout approach for digital single molecule isothermal amplification for use with an unmodified cell phone camera. a). We hypothesized that EBT would be amenable to colorimetric analysis with a cell phone camera because, in RGB terms, in a positive LAMP reaction containing EBT dye, there is higher transmission in the blue channel (blue LAMP reaction solution), while in a negative LAMP. reaction transmission remains high in the blue and red channels (purple LAMP reaction solution) (Figure 5.2a). The predicted RGB values for a positive and a negative response are used to calculate the ratios for each channel combination (Figure 5.2d); the ratio with the largest difference between positive and negative outcomes (G/R in this example) is predicted to be the most robust ratiometric analysis.
HNB is increasingly being reported in the literature for LAMP visualization,50,59-62 and chelagit is an analogue of the EBT dye lacking the nitro group (the more stable version).63 A side-by-side comparison showed that the biggest difference predicted between positive and negative RT-LAMP reactions, as captured by an unmodified cell phone camera, would be achieved using EBT as the indicator dye and G/R as the ratiometric combination (Figure 5.17). We confirmed the storage stability of the EBT dye stock solution in the dried state (Figure 5.19), as this is a critical requirement for the use of a dye in real point-of-need diagnostic applications. To experimentally validate this approach for predicting an optimal ratiometric combination, we performed an RT-LAMP reaction for HCV RNA containing EBT as an indicator dye and captured an image of the readout with an unmodified camera phone (iPhone 4S) (Figure 5.2 c).
Detailed information for the G/R ratiometric process (Figure 5.8) and additional cell phone camera images (Figure 5.9) are provided in the Supporting Information. In addition, using a device containing 800 wells of 27 nL, we observed excellent correlation between positive counts obtained from the stereoscope, fluorescence imager and cell phone camera (Figure 5.12). To do this, we designed a two-step SlipChip device (based on previous SlipChip designs)13 (Figure 5.15-16) in which the amplification solution and the detection solution are loaded into separate wells (Figure 5.6a).
First, we performed isothermal digital amplification in the array of small (5 nL) amplification wells (in the absence of indicator dye) (Figure 5.6a(i)). After amplification, a “slide” was performed and the amplification wells were contacted with a second set of larger wells (9.5 nL), which contained indicator dye—for a total well volume of 14.5 nL (Figure 5.6a ( ii)). A comparison of stock solutions of the indicator dye EBT, HNB, and calaghite before and after treatment with Chelex® 100 is provided in SI (Figure 5.18).
Photographs of the 96-well plate were also taken using alternative commercial cell phones and under different lighting conditions (Figure 5.3 and Figure 5.9).
REAL-TIME, DIGITAL LAMP WITH COMMERCIAL MICROFLUIDIC CHIPS REVEALS THE INTERPLAY OF
A FUNCTION OF REACTION TEMPERATURE AND TIME
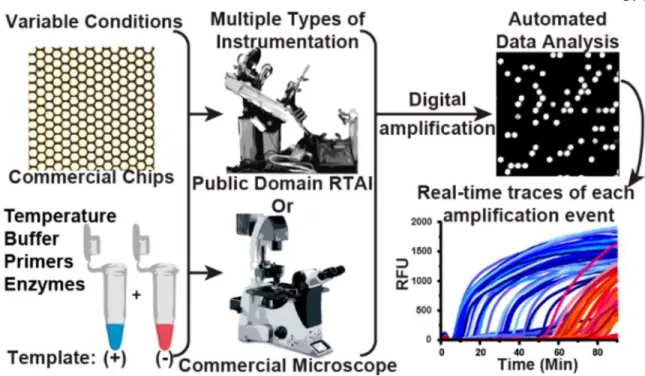
Unfortunately, there is no commercially available and affordable real-time, digital instrument validated for isothermal amplification; thus, most researchers have failed to apply digital, real-time approaches to isothermal amplification. Here we generate an approach for real-time digital loop-mediated isothermal amplification (LAMP) using commercially available microfluidic chips and reagents, and open-source components. By analyzing the interplay of amplification efficiency, background, and amplification rate, this real-time digital method allowed us to test the enzymatic performance over a range of temperatures, generating highly accurate kinetic and endpoint measurements.
This real-time digital approach will be useful for others in the future to understand the fundamentals of isothermal chemistries—including which components determine the fate of amplification, reaction rate, and enzyme efficiency. In this chapter, we describe a methodology for using commercially available chips, reagents, and microscopes to perform real-time digital LAMP. Real-time digital formats are particularly valuable for studying variables that mainly affect non-specific amplification and amplification rate.
Despite the value that real-time dLAMP can bring to diagnostics, this method is difficult to implement - especially for those without experience in micro-electro-mechanical or microfluidic systems - because there is no commercial system for real-time isothermal digital amplification. . Here, we demonstrate how to generate high-precision kinetic and endpoint measurements using a real-time dLAMP assay performed entirely with commercially available and open-source components (Figure 6.1). We use this real-time information to investigate dLAMP reactions mechanistically, including the interplay of efficiency, rate, and background amplification as a function of temperature and reaction time in two enzymes.
To illustrate one application of using real-time dLAMP to improve a clinically relevant assay, we optimized assay conditions for phenotypic AST using the real-time dLAMP pipeline and used the optimized protocol to compare our AST of 17 clinical urine samples with the gold-standard method. LAMP experiments using Bst 2.0 (Figure 6.3a, c, e, g) contained the following final concentrations, optimized as shown in Figure 6.7: 1x isothermal amplification buffer (New England BioLabs, Ref.