ISSN : 0853-9189 (Print) DOI: 10.25105/ber.v21i1.9230
The Influence of Demographics Factor on Pension Planning and Financial Literacy of Private Employee
1)Maria Rycca P. Sembiring
2)Farah Margaretha Leon
1)Boga Group
2)Trisakti University [email protected]
ABSTRACT
The purpose of this research is to analyze the relationships of demographics factors to pension planning and financial literacy. The research methodology used in this research is the quantitative method. The sample in this research is private employees that are determined by using sampling probability. The data analysis method in this research is a correlation test that used the Chi-Square approach. The result and contribution in this research is there any correlation between demographics factor and pension planning. From the demographics factor in this research can be seen that education factor, marriage status, and income have its significant relationship with pension planning.
On the other hand, gender factor and age have no relationship to pension planning. From demographics factor in this research concluded that age, education level, marital status, and income has a significant relationship to financial literacy. Whereas, gender factor has no relationship to financial literacy.
Keyword: demographics factor; financial literacy; pension planning; private employee.
History Article Recieved: 2021-04-12 Revised: 2021-04-18 Accepted: 2021-05-01
*Corresponding author
INTRODUCTION
The lack of awareness to prepare for the retirement period will create problems for an individual who has retired, because in that time the individual has no productivity therefore, he only gets less income to compare with the productive age period.
Added to the burden of loans in the productive period such as housing loans and vehicles before entering retirement and the increasing cost of living plus health problems can create financial problems for retirees so they must depend on their children (Folk, Beh, Baranovic., 2012).
Pension planning and satisfaction have a positive relationship where retirement planning is a factor that can affect satisfaction and well-being in retirement. Retirement planning can be decided by changes in roles, relationships, routines, and habits, along with changes in income and health (Lee & Law, 2004). Planning includes formal preparation 4 or informal preparation through discussions with spouses or friends and learning about pensions (Heeekenda., 2016).
Pension planning is one of the important activities to be prepared during the productive period or while it is still actively working and this plan must be updated regularly depending on the actual situation and conditions. With good financial planning, this will be able to avoid many difficulties related to the financial future. Saving in the productive period is also an activity that requires a good balance between expenditure and savings (Heeekenda., 2016).
Financial literacy plays an important role in influencing saving behavior and the participation of family members in pension schemes as well as efforts to reduce the debt burden and collect wealth and manage it effectively (Lusardi, Mitchell, Curto., 2010).
Financial literacy has an important role in the individual economy with financial knowledge is better to save and save more than their counterparts who lack financial literacy. The increase in savings related to financial literacy has a positive impact on both the level of investment and economic growth (Lusardi and Mithcell., 2014). Financial literacy is a very broad concept that covers various economic concepts and also provides a clear understanding of how economic conditions affect decisions households. Financial literacy is a basic money management concept that includes budgeting, investment, planning for retirement, and maximizing wealth. Financial literacy is also related to facts, data, and thus provides specialized knowledge to increase awareness of the various financial options and opportunities available. (Pinto, Fernández, Pulgarín, 2015). Many unknown households are even regarding the most basic economic concepts needed to make austerity and investment decisions (Lusardi & Mitchell, 2014).
There are still many individuals who do not have and understand the concepts of basic financial literacy and consequently can have an impact on decisions for savings, retirement planning, mortgages, and other decisions. Lack of knowledge about financial
literacy makes the younger generation so they are not ready to enter retirement because it is too late to prepare for retirement (Moorthy, Durai, Sien, Leong., 2012). Demographic factors are one of the factors that can influence financial literacy skills and also retirement planning (Moorthy, Durai, Sien, Leong., 2012). The results of the research from Onduko, Gweyi, Nyawira (2015) also showed the influence of socio-demographic factors on financial literacy and retirement plans. Pinto, Fernández, Pulgarín (2015) research also showed that demographic factors had an influence on financial literacy and also found that financial literacy is a factor that determines individual choices in retirement planning.
This study aims to analyze the relationship of demographic factors to retirement planning and to analyze the relationship of demographic factors to financial literacy.
LITERATURE REVIEW
Financial Literacy
Financial literacy is the ability to obtain, analyze, manage and communicate a person's financial situation that can affect one's well-being where this reflects the ability to gather important and relevant information to distinguish between different financial options, discuss financial and monetary issues, and plan and answer events that influence routine decision making (Mouna and Jarboui., 2015). According to Margaretha and Siti (2015), financial literacy is the ability to analyze, manage and communicate one's financial condition that can affect material welfare. According to Shaari, Hasa, Mohamed, Sabri (2013) financial literacy is a process by which an individual uses a combination of expertise, resources, and knowledge to make financial decisions based on these combinations.
Financial planning
Financial planning can be considered as a planning process in the financial realm and uses a series of mechanisms (Irving., 2012). In the context of the company financial planning is understood as the most important tool for companies to make financial decisions and achieve financial goals (Andres, 2014). Meanwhile, in the context of
individuals, personal financial planning is the process of managing money to achieve personal economic satisfaction. (Heenkenda., 2016) The general approach of personal financial planning involves the effective use of savings to accumulate wealth, followed by careful management of wealth against depreciation of values and losses, and finally the distribution of wealth in the final stages of one's life.
Pension Planning
Shultz & Wang (2007) defines retirement as an individual discharge from the workforce, which accompanies a decrease in psychological commitment and withdrawal of behavior from work. This definition emphasizes retirement both as a psychological process and the status of life. Retirement is a stage of life that is not only by the level of physical activity and decreased productivity but also involves reducing stress and smaller responsibilities for others in daily life (Wang and Shi, 2013).
Socio-Demographic Factors
Socio Factor Demography is a feature that describes the differences in society based on age, sex, occupation, education, religion, ethnicity, income, family type, marital status, geographical location, and social class (Margaretha and Yosephina, 2016). Rita and Kusumawati (2010) stated that sociodemographic factors consisted of gender, age, education level, marital status, employment, position, and income. While the demographic characteristics according to Loix, Pepermans, and Hove (2005) are age, gender, education, family, and work.
Conceptual Framework
Retirement is a period that must be well prepared. Lack of awareness to prepare for retirement can cause problems especially financial problems for retirees so they have to depend on their children because of limited funds and also being unable to be productive plus health problems and other problems.
Financial literacy plays an important role in influencing the adoption behavior and participation of family members in pension schemes as well as efforts to reduce the debt burden and collect wealth and manage it effectively (Lusardi et al 2010). Previous studies have shown that demographic factors can influence financial literacy and also retirement planning. Based on this, the following framework can be arranged:
Picture 1: Conceptual Framework
Hypothesis Formulation
Demographic factors are one of the factors that can influence the ability of financial literacy and pension planning (Moorthy et al., 2012). The results of the research from Onduko et al (2015) also show the influence of socio-demographic factors on pension plan literacy. Pinto et al (2015) results also show that demographic factors have an influence on financial literacy and also find that financial literacy is a factor that determines individual choices in retirement planning.
H1: There is a relationship between demographic factors to retirement planning.
According to Taft et al (2013), demographic factors are one of the factors that can influence financial literacy. Demographic factors such as age and level of education have a positive influence on financial literacy. Other results also show that married individuals and more men have higher financial literacy (Xiao et al, 2013). Demographic factors are one of the factors that can influence the ability of financial literacy and retirement planning
Financial Literacy H2
H1
Pension Planning Demographic
Factors
(Moorthy et al., 2012). The results of the study from Onduko et al (2015) also indicate the influence of socio-demographic factors on financial literacy.
H2: There is a relationship from demographic factors to financial literacy.
METHODS
Research design
The design of this study uses hypothesis testing, which is research that aims to test existing hypotheses by explaining the characteristics of a particular relationship or differences between groups or the interdependence of two or more factors in a situation (Leon, 2018). The unit of analysis used in this study is individuals who have credit cards.
This study uses a cross-sectional time horizon were observation. Also, this study was conducted with data that was only collected once to answer the research question.
Variables and Measurements
This study uses questionnaires as a tool to determine how demographic factors influence financial literacy on retirement planning and financial literacy. Questionnaires submitted to respondents use the Likert Scale to measure financial literacy and pension plans where this scale measures the agreement and disagreement of respondents to a series of questions related to beliefs or behavior regarding a particular object.
Likert scale used in this study is a 5-point Likert scale, where 1 = Strongly Disagree, 2 = Disagree, 3 = Enough Agree, 4 = Agree, 5 = Strongly Agree. While the demographic scale uses a nominal scale.
Demographic factors in this study are grouped by sex, education level, age, marital status, and income.
Retirement planning measurements use indicators developed by Pinto et al (2015) which consist of 3 items, namely:
1. You believe in planning for retirement
2. You believe retirement planning is very important for the future of financial security
3. I have enough money to live safely during the retirement year
Financial literacy measurement uses indicators developed by Pinto et al (2015) which consist of 8 items, namely:
1. I know health insurance
2. I know motor vehicle insurance 3. I know life insurance
4. I know about stocks 5. I know bonds
6. I know mutual funds 7. I know the property 8. I know pension funds
Data collection technique
The data in this study were taken by distributing questionnaires to private employees in productive age as research samples. Sampling is done with non-profitability which is a subjective sampling procedure, where each population does not have the same opportunity to be selected as a sample. The technique used is purposive sampling which takes samples with certain criteria determined by the researcher (Leon, 2018).
The specific criteria of respondents used in this study are as follows:
1. Respondents are still at productive age
2. Respondents are private employees who are still actively working
The data used in this study is primary data, namely data collected directly by researchers to answer the problem or purpose of the study. The questionnaire used is a closed questionnaire where respondents can answer questions according to a predetermined scale.
Research Instrument Test Validity test
Validity is the level of reliability and validity of the measuring instrument used where the instrument is said to be valid means that the measuring instrument used to obtain the data is valid or can be used to measure what should be measured (Sugiyono, 2013). Validity aims to determine whether the statement item measures the concepts referred to in this study correctly (valid) to measure the variables examined (Hair et al., 2013). Thus the test is conducted to find out whether all questions the research proposed to measure research indicators are valid.
The analytical tool in the test is use factor analysis is a measurement that is related to the extent to which a measurement scale or instrument represents the overall characteristics of the content being measured (Now and Boguie, 2015), Based on the testing the validity test is as follows:
1. If the Factor Loading <α (0.5), then the item statement is NOT VALID 2. If the Factor Loading >α (0.5), then the item is a Valid statement
Table 1: Test the Validity of Pension Planning
Indicator Loading Factor Decision
You believe planning for pension 0.900 Valid
You believe pension planning is very important for the future of financial security
0.898 Valid
I have enough money to live safely on a pension 0.593 Valid
Source: data processed
Based on the results of testing the validity for retirement planning, it can be seen that the factor values for each indicator are 0.900, 0.898, and 0.593.
These three indicators have a factor loading value greater than 0.5 so it can be concluded that the three indicators used to measure the retirement planning variable are valid and can be used for further analysis.
Table 2: Test the Validity of Financial Literacy
Indicator Loading Factor Decision
I know have knowledge about health insurance 0.766 Valid I know have knowledge about motor vehicle
insurance 0.681 Valid
I know have knowledge about life insurance 0.793 Valid
I know have knowledge about stocks 0.846 Valid
I know have knowledge about bonds 0.831 Valid
I know have knowledge about mutual funds 0.809 Valid
I know have knowledge about property 0.777 Valid
I know have knowledge about pension funds 0.779 Valid
Source: data processed
Based on the results of testing the validity for financial literacy, it can be seen that the factor values for each indicator are 0.766, 0.681, 0.793, 0.846, 0.831, 0.809, 0.777, 0.779. These eight indicators have a factor loading value greater than 0.5 so it can be concluded that the eight indicators used to measure financial literacy variables are valid and can be used for further analysis.
Reliability Test
Reliability testing is a measurement that shows the stability and consistency of an instrument that measures a concept and is useful for accessing the feasibility of a measurement (Sekaran and Boguie, 2015).
In the research of reliability testing method using Cronbach Alpha which remembers the measuring instrument used to measure the variables in this study is a questionnaire consisting of several statements, it is necessary to test the reliability of each variable used by looking at Cronbach's coefficient Alpha as the coefficient of reliability. According to
Sekaran and Boguie (2015), the sufficient value of the Cronbach's coefficient that is acceptable is that it has a value of 0.06 to 0.07 or more, while the Cronbach's coefficient value is less than 0.06 is not acceptable.
In making decisions, reliability tests are:
• Cronbach's Alpha> 0.60, then Cronbach's coefficient alpha is acceptable.
• Cronbach's Alpha <0.60, then Cronbach's alpha coefficient is not acceptable.
Table 3: Reliability Test
Variable Cronbach Alpha Decision
Pension Planning 0.677 Reliable
Financial Literacy 0.911 Reliable
Source: data processed
From the results of the reliability analysis, the Cronbach alpha value for retirement planning is 0.677 and the value of financial literacy is 0.911. This result shows that the two variables have a Cronbach alpha value greater than 0.6 so that all indicators have good reliability.
Analysis Method
Analysis of partial correlation is used to determine the strength of the relationship between the correlation of the two variables where other variables considered influential are controlled or fixed (as a control variable). Chi-squares are used to approach several factors or evaluate the frequency investigated or frequency of observations with frequency.
expected from the sample whether there is a relationship or a significant difference or not.
In statistics, the chi-square distribution is included in the nonparametric statistics.
Nonparametric distribution is the distribution in which population quantities are unknown.
RESULT AND DISCUSSION
Descriptive statistics
Descriptive statistics aim to provide an overview and description of data using a statistical approach. Descriptive statistics explain the characteristics of the data to be used in the study which are seen from the minimum, maximum, average, and standard deviation values.
The mean is the average value of each variable studied. The minimum value is the lowest value for each variable, while the maximum value is the highest value for each variable in the study. The standard deviation shows the distribution of data used in research that reflects the data is heterogeneous or homogeneous.
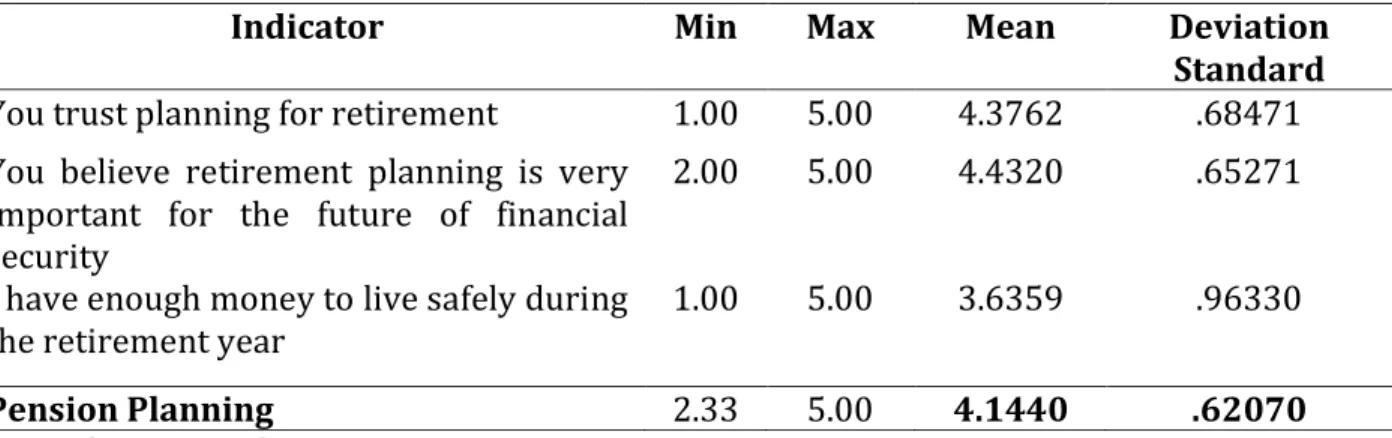
Table 4: Retirement Planning Descriptive Statistics
Indicator Min Max Mean Deviation
Standard You trust planning for retirement 1.00 5.00 4.3762 .68471 You believe retirement planning is very
important for the future of financial security
2.00 5.00 4.4320 .65271
I have enough money to live safely during
the retirement year 1.00 5.00 3.6359 .96330
Pension Planning 2.33 5.00 4.1440 .62070
Source: data processed
Based on descriptive statistics for retirement planning variables have a min value of 2.33 and a maximum value of 5.00 while the average value is 4.1440 where it shows that overall respondents have good retirement planning. The first indicator in retirement planning has a min value of 1.00 and a maximum value of 5.00 while the average value is 4.3762 which indicates that respondents have good trust in retirement planning. The second indicator has a value of min 2 and max 5 with an average of 4.4320 which shows respondents agree that retirement planning is very important for the future of financial security. Meanwhile, for the third indicator, the min value is 1 and the max value is 5 with an average value of 3.6359 which indicates that the respondent has agreed that the respondent has enough money to live safely during the retirement year.
This mean value will be grouped into three parts where the value obtained from the maximum value divided by three where the category for low is the respondent with a mean of 1 - 1.67, enough with the mean 1.68 - 3.35, and good with a mean value of 3.36-5.00.
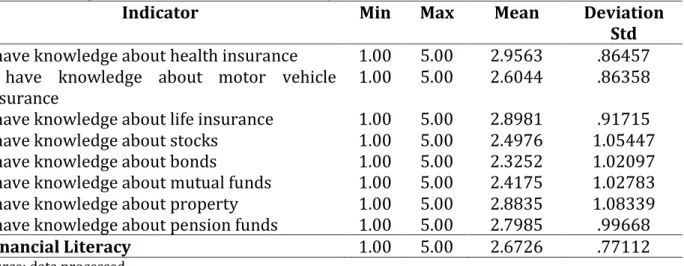
Table 5: Descriptive Statistics of Financial Literacy
Indicator Min Max Mean Deviation
Std I have knowledge about health insurance 1.00 5.00 2.9563 .86457 I have knowledge about motor vehicle
insurance 1.00 5.00 2.6044 .86358
I have knowledge about life insurance 1.00 5.00 2.8981 .91715 I have knowledge about stocks 1.00 5.00 2.4976 1.05447
I have knowledge about bonds 1.00 5.00 2.3252 1.02097
I have knowledge about mutual funds 1.00 5.00 2.4175 1.02783 I have knowledge about property 1.00 5.00 2.8835 1.08339 I have knowledge about pension funds 1.00 5.00 2.7985 .99668
Financial Literacy 1.00 5.00 2.6726 .77112
Source: data processed
Based on descriptive statistics for financial literacy variables have a min value of 1 and a max value of 5 with an average value of 2.6726 where shows that overall respondents have poor literacy.
1. The first indicator has a min value of 1 and a max value of 5 with an average value of 2.9563 which shows overall respondents have sufficient knowledge of health insurance products.
2. The second indicator has a min value of 1 and a max value of 5 with an average value showing a value of 2.6044 which shows respondents have low knowledge about motor vehicle insurance.
3. The third indicator has a min value of 1 and a max value of 5 with an average value of 2.8981 which indicates that respondents have sufficient knowledge about life insurance.
4. The fourth indicator has a min value of 1 and a max value of 5 with an average value of 2.4976 which indicates that respondents have low knowledge about stocks.
5. The fifth indicator has a min value of 1 and a max value of 5 with an average value of 2.3252 which shows respondents have low knowledge about bonds.
6. The sixth indicator has a min value of 1 and a max value of 5 with an average value of 2.4175 which shows respondents have low knowledge about mutual funds.
7. The seventh indicator has a min value of 1 and a max value of 5 with an average value of 2.8835 which shows respondents have sufficient good knowledge about the property, and the seventh indicator has a min value of 1 and a max value of 5 with an average value average for the 2.7985 indicator which shows respondents have sufficient good knowledge about pension funds.
This mean value will be grouped into three parts where the value obtained from the maximum value divided by three where the category for low is the respondent with a mean of 1 - 1.67, enough with the mean 1.68 - 3.35, and good with a mean value of 3.36- 5.00.
Hypothesis testing
In this study, bivariate analysis was conducted to determine the relationship of demographic factors with retirement planning and financial literacy. The statistical test used is chi-square, the chi-square test is used to test hypotheses if the population consists of two or more classes where the data is categorical. Decision making is to use an error of 10% (0,1) where the acceptance decision is:
If the value of sig < 0.1 then H0 is rejected, it means there is no relationship between variables
If sig > 0.1 then H0 is accepted, meaning that there is a relationship between variables
The results of the t-test are as follows:
Table 6: Correlation Test Results of Demographic Factors Against Pension Planning
Variable Sig Decision
Gender 0.757 Not Significant
Education 0.068 Significant
Age 0.844 Not Significant
Marital Status 0.021 Significant
Income 0.026 Significant
Source: data processed
H1: There is a relationship between Demographic Factors on Pension Planning
The results of the testing show that there is a correlation between demographic factors on retirement planning. From the demographic factors included in this study, it can be seen that the level of education, marital status, and income is a factor that has a relationship with retirement planning. Meanwhile, gender and age factors have no relationship with retirement planning.
Higher education certainly has a good understanding of retirement planning because with higher education it will be more important to know about financial management and how to plan for retirement and also can understand the ways that must be done in retirement planning.
Respondents with marital status naturally think more about the future because they also think of the future of the offspring of married individuals so they are more willing to prepare themselves in old age. Added to that many married individuals ultimately have a double income from households with double income and that of course makes family income increase and can increase the space for investment in retirement preparation efforts.
The income factor is also found to have a relationship with retirement planning where this can occur, the higher a person's income, there will be income remaining in addition to meeting personal or family needs. The excess income can ultimately be used to invest in retirement planning.
Meanwhile, the sex factor was found to have no relationship with retirement planning. This is because at present the income of the family is not only dominated by men, but also women today have high careers and also good financial conditions and also have more decisions in financial matters in the family so that it encourages the absence of gender relations to retirement planning.
The age factor was also found to have no relationship with retirement planning where could be due to the majority of respondents in this study is relatively young, i.e.
under 30 years. Under 30 years of age, most individuals are still in the early stages of their careers, so they don't think too much or plan for retirement. The results of this study support the results of previous studies conducted by Onduko et al (2015) which showed that demographic factors consisting of education level and monthly income had a relationship with retirement planning. This research is also in line with the research of Githui and Ngare (2014) who found a relationship between demographic factors on retirement planning where the results showed that demographic factors consisting of gender, age, marital status, education, employment, income had a relationship with retirement planning.
Table 7: Demographic Factor Correlation Test Results Against Financial Literacy
Variable Sig Decision
Gender 0.326 Not Significant
Education 0.070 Significant
Age 0.080 Significant
Marital Status 0.087 Significant
Income 0.003 Significant
Source: data processed
H2: There is a relationship between Demographic factors on Financial Literacy
The results of the testing show that there is a correlation between demographic factors towards financial literacy.
From the demographic factors included in this study, it can be seen that the factors of education, age, marital status, and income have a relationship with financial literacy.
Meanwhile, gender factors have no relationship with financial literacy.
The results of the study show that the level of education has a relationship with financial literacy where it shows that the higher the level of education the higher the financial literacy of the individual. Wherewith higher education, individuals will have more access to higher information and knowledge, especially about financial literacy.
Income factors were also found to have a positive correlation with financial literacy.
This is because individuals with large incomes have excess funds that can be invested. The existence of these excess funds certainly makes individuals try to find information about financial literacy in terms of investment to improve their prosperity.
The results of the study also show that age factors also have a relationship to financial literacy. This can occur because, with increasing age, the information obtained by individuals about financial literacy will increase. And also, in general, as we get older, it will be envied by increasing income. With this, the individual will also try to invest so that they can find out things related to financial products so that they can improve their financial literacy.
Another factor is marital status, where the results of the study show that there is a relationship between marital status and financial literacy. This is because respondents who are married will focus more on the future such as preparing for the future of the child and also retiring. And these things encourage individuals to look for information relating to investments and their products and this will increase financial literacy.
The test results show that there is no influence of gender on financial literacy. This can happen because currently, access to education and information related to financial literacy is as open to both men and women as possible. High and low financial literacy ultimately depends on individuals regardless of gender.
The results of this study support the results of a study from Taft et al (2013) which showed that age demographic factors and marital status have a relationship with financial literacy. The results of this study also support the research of Maimoneh et al (2014) which
shows that there is a relationship between age, marital status, employment, education, and financial conditions on financial literacy.
CONCLUSION. MANAGERIAL IMPLICATION, AND SUGGESTION
Conclusion
Based on the results of the analysis from the previous chapter, the conclusions from this research are:
1. The results of the testing show that there is a correlation between demographic factors towards retirement planning. From the demographic factors included in this study, it can be seen that education factors, marital status, and income have a significant relationship to retirement planning. Meanwhile, gender factors have no relationship with retirement planning
2. The results of the testing show that there is a correlation between demographic factors towards financial literacy. From the demographic factors included in this study, it can be seen that education factors, as well as income, have a significant relationship to financial literacy. Meanwhile, gender, age, and marital status factors have no relationship with financial literacy.
Managerial Implications
This research has implications for decision-makers especially those relating to retirement planning and financial literacy. The implications that can be taken are:
For Financial Institutions
Financial service providers related to retirement planning should provide more information to customers and the public in general on the importance of retirement plans.
Management can also design a program from a relatively young age to attract young employees to begin preparing for their retirement years well.
For the Government
The results of this study show how demographic factors influence financial literacy.
However, financial literacy, in general, is still relatively low.
This can be an input to be learning from the IDX where this can be used as a material consideration for the strategies used to be able to improve the financial literacy of the Indonesian people. campus or other educational institutions by holding seminars or workshops related to financial literacy.
Suggestion
Suggestions for further research are:
This research only researches private employees, it is hoped that further research adds or expands the research sample is not limited to private employees as well as sample locations not only in Jakarta
Variables in research only consist of demographic factors, retirement planning.
Isomidinova and Singh (2017) conducted a study of the determinants of financial literacy and the results of the study showed that social agents such as mass media, and also government financial institutions as one of the factors that can improve financial literacy.
Therefore, further research can add social agent variables (media as a variable that can influence financial literacy).
Questionnaire questions for further research are expected to increase and also develop to convince researchers of the results of the hypotheses taken.
REFERENCES
Andres, Masilo (2014) Fundamental Concept to Perform A Business Financial Planning in Latin America, Europian Journal fo Business and Social Sciences vol 4 no 4 pp 80-92 http://www.ejbss.com/Data/Sites/1/vol3no4july2014/ejbss-1419-14-
fundamentalconceptstoperform.pdf
Folk, J.Y., Beh, L.S., Baranovich, D.L (2012) Determinant of Retirement Planning in Malaysia.Journal
of Business Management Vol 3.no 2. PP 69-78
https://umexpert.um.edu.my/file/publication/00007019_77401.pdf
Githui, T, Ngare, P (2014) Financial Literacy and Retirement Planning in the Informal Sector in Kenya. International Journal of Education and Research Vol 2 no 1 http://www.researchjournali.com/view.php?id=3651
Hair, J.F., Hult, G.T.M., Ringle, C.M., Sarstedt, M., (2013). A Primer on Partial Least Squares Structural Equation Modeling (PLS-SEM). Sage, Thousand Oaks
Heenkenda, S. (2016). The Determinants of Dropouts from Voluntary Pension Scheme: Evidence from Sri Lanka, International Journal of Business and Management Society, 1(1), 10-22.
https://mpra.ub.uni-muenchen.de/72481/1/MPRA_paper_72481.pdf
Irving, K. (2012). The financial life well-lived: Psychological benefits of financial planning.
Australasian Accounting Business & Finance Journal, 6(4), 47–59
Isomidinova, G., Singh, J.S (2017) Determinant of Financial Literacy: a quantitative study among young students in Tashkent, Uzbekistan. Electronic Journal of Business and Management Vol 2 no 1 http://ro.uow.edu.au/cgi/viewcontent.cgi?article=1385&context=aabfj
Lee, W. K. M., & Law, K. W.K. (2004). Planning for retirement in Hong Kong: An analysis of age, education, and income differences, Social Development Issues, Vol 26 no2, PP 109-126.
https://commons.ln.edu.hk/sw_master/3815/
Leon, Farah Margaretha , 2018, Mengelola Keuangan Pribadi, Jakarta, Penerbit Salemba Empat Lusardi A., Mithcell, O.S (2014) The Economic Importance of Financial Literacy: Theory and
Evidence, J Econ Lit. Vol 52(1), PP 5–44 http://gflec.org/wp- content/uploads/2014/12/economic-importance-financial-literacy-theory-evidence.pdf Lusardi, A, Mitchell, O. & Curto, V. (2010), “Financial Literacy among the Young”, Journal of
Consumer Affairs, Vol 44 no 2, PP 358 – 380 https://www.jstor.org/stable/23859796 Maimoneh, S.K., Moeinadin, M., Nayebzadeh, S (2014) A Survey to The Influence of Demographic
Characteristic on The Level of Financial Literacy of Iranian Student. Interdisciplinacry Journal of Contemporary Research in Business Vol 5 no 11 https://journal-archieves36.webs.com/64- 72mar14.pdf
Margaretha, Farah dan Siti May, (2015), Analisis Faktor-faktor Yang Mempengaruhi Tingkat Literasi Para Pengguna Kartu Kredit, Jurnal Akuntansi dan Investasi, Vol 16 Juli OI:
10.18196/JAI.2015.0038; 132-144.
Margaretha, Farah, and Yosephine Artiani, (2016), Financial Literacy on Post Graduated students Trisakti University, Business Enterpreneur Review, Vol.14, No.2, April, 97-110.
Moorthy, MK., T, Durai, L., Sien and Leong (2012) A Study on the retirement planning behaviour of working individuals in Malaysia. Int J Acad Res Econ, Manage, Econ, 42: 508-613 http://hrmars.com/admin/pics/696.pdf
Mouna, Amari., Jarboui, Anis, (2015) Financial literacy and portfolio diversification: an observation from the Tunisian stock market, International Journal of Bank Marketing, Vol. 33 No 6, PP 808-822 https://www.emeraldinsight.com/doi/full/10.1108/IJBM-03-2015-0032
Onduko, E.M., Gweyi, M.O., Nyawira, J. (2015) Analysis of the Determinant on Retirement Planning in Kenya: A Survey of Registered pension Scheme in Nairobi. Journal of Finance and
Accounting Vol 6 no 3. PP 208-2016
https://www.iiste.org/Journals/index.php/RJFA/article/viewFile/19961/20489
Pinto, M., Escalona-Fernández, M.I. and Pulgarín, A. (2015), “Information literacy in social sciences and health sciences: A bibliometric study (1974–2011)”, Scientometrics, Vol. 95 No. 3, pp.
1071-1094. https://link.springer.com/article/10.1007/s11192-012-0899-y
Rita, M. R. & Kusumawati, R. (2010). Pengaruh variabel sosio demografi dan karakteristik finansial terhadap sikap, norma subyektif dan control perilaku menggunakan kartu kredit : Studi pada pegawai di UKSW Salatiga. Jurnal Management dan Keuangan Vol 6 no 2, PP 109-128.
https://jurnal.darmajaya.ac.id/index.php/jmk/article/view/320
Sekaran, U. and Bougie, R. (2015) Research Methods for Business—A Skill Building Approach. 7th Edition, John Wiley and Sons
Shaari, N.A., Hasa, N.A., Mohamed, R, K, M., Sabri, M, A, J (2013) Financial Literacy: A Study Among the University Students, Interdisciplinary Journal of Contemporary Research in Business, Vol 5 no 2, PP 279-299 https://journal-archieves33.webs.com/279-299.pdf
Shultz, K. S., & Wang, M. (2007). The influence of specific physical health conditions on retirement decisions. The International Journal of Aging and Human Development, Vol 65 No 2, PP 149- 161. https://www.ncbi.nlm.nih.gov/pubmed/17957985
Sugiyono. (2013). Metode Penelitian Pendidikan (Pendekatan Kuantitatif,. Kualitatif, dan R&D).
Bandung : Alfabeta
Taft, M. K. Housein, Z. Z., Mehrizi, S. M. T., Roshan, A (2013) The Relation Between Financial Literacy, financial wellbeing and financial concern. International Journal of Business
Management Vol 8 No 11, pp 63-75
http://www.ccsenet.org/journal/index.php/ijbm/article/download/24940/16664
Wang, M., & Shi, J. (2013). Psychological research on retirement. Annual Review of Psychology, Vol 65 No 1, pp 209-233, https://www.ncbi.nlm.nih.gov/pubmed/23751036
Xiao, J. J., Chen, C., & Chen, F. (2013). Consumer financial capability and financial satisfaction. Social
Indicators Research. On Vol 18 No 1, PP 414-432
https://link.springer.com/article/10.1007/s11205-013-0414-8