Dessy Eka Putri, Central Office of KPP Pratama Cikarang Selatan, who assisted the researcher during the research activities. The scholar's family for all the countless efforts they have made to help each scholar's needs and equip her to become what she is now.
INTRODUCTION
- Research Background
- Research Question
- Research Objectives
- Significance of the Study
- Writing System
This study shows that tax compliance can be increased through the influence of the Tax and Customs Administration. Perception of fiscal justice and income tax compliance in ken saro-wiwa polytechnic, bori.
REVIEW
Tax
Tax knowledge is a process by which taxpayers have knowledge of taxation and apply that knowledge when paying taxes. Based on the above insights, it can be concluded that tax knowledge is everything that is known about taxation.
Function of Tax
The definition of tax according to Law Republic of Indonesia number 28 year 2007 article 1 is mandatory contribution to the state that is forced under the law from individuals that is used for the country's needs for the prosperity of the people and without direct repayment.
Tax Compliance
Tax Fairness
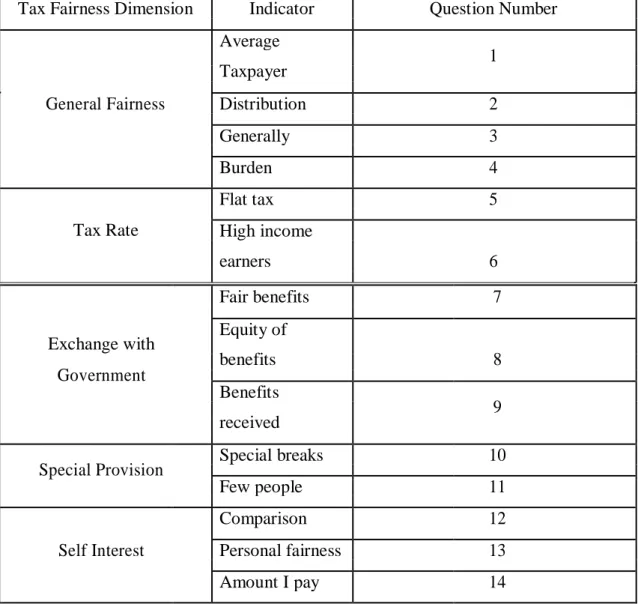
General fairness and distribution of the tax burden (discusses whether the tax system has so far covered fairness in a comprehensive and fair distribution of the tax burden) Preferred tax rate structure (discusses the progressive / flat / proportional tax rates preferred by the public). Exchange equity is a taxable equity compared to the services or services provided by the government.
Tax Complexity
Hypothesis development
- Effect of Tax Fairness Towards Tax Compliance
- Effect of Tax Complexity Towards Tax Compliance
The result shows that taxpayers are increasingly reluctant to pay taxes if the level of complexity increases. Saad (2014) stated that the factors behind the non-compliance of taxpayers in New Zealand were due to tax knowledge and the complexity of the tax system. Many taxpayers lack knowledge of the tax system, which is understandable, as the tax system in New Zealand is very complex and subject to many criticisms.
According to Borrego et al. 2016), critical problems can arise in the complexity of the tax system.
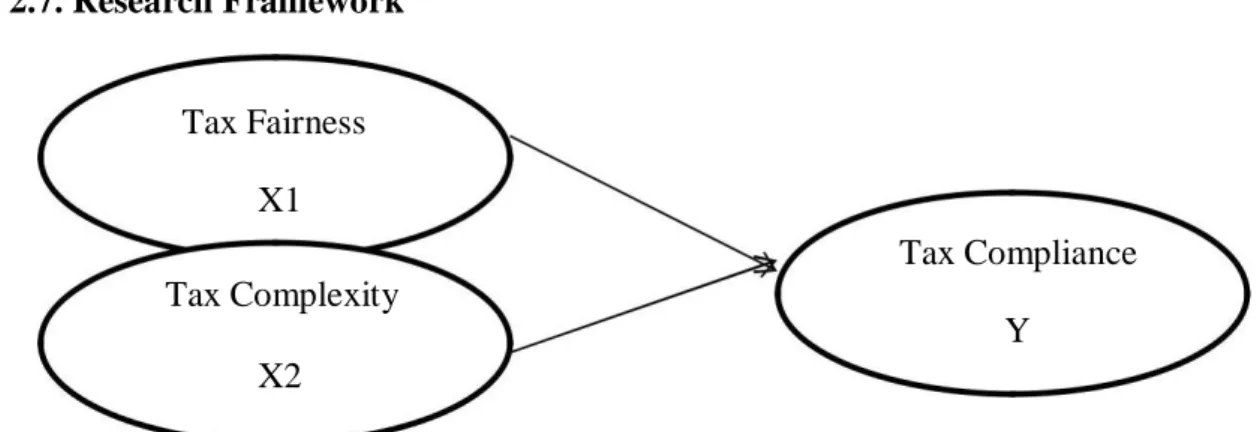
Research Framework
The dependent variable in this study is about tax compliance and has 10 questionnaire items. The output of the above table has obtained a significance value of 0.000, where the significance value is < 0.05, so that it can be concluded that tax fairness and tax complexity together influence tax compliance. Based on regression equations, it appears that tax fairness and tax complexity have a positive influence on tax compliance.
The higher the level of tax fairness and tax complexity, the higher the level of tax compliance. Based on t-test (determines the effect of partial independent variable), the tax fairness significantly influenced the tax compliance (significance value 0.008 < 0.05). This indicates that the higher the tax fairness, then the tax compliance will be high for SMEs in Cikarang.
The effect of tax justice, tax knowledge and tax complexity on tax compliance: the case of SME entrepreneurs. The impact of tax fairness dimensions on tax compliance behavior in an Asian jurisdiction: the case of Hong Kong.
METHODOLOGY
Research Design
- Independent Variable
- Dependent Variable
This study has three variables, consisting of two independent variables (Tax Complexity and Tax Fairness) and one dependent variable (Tax Compliance). Data was collected using a questionnaire survey of individual taxpayers.). There are two independent variables in this study which are tax fairness and tax complexity. The tax fairness questionnaire survey provided is an adaptation and modification of the questionnaire used in Giligan (2005).
Tax complexity questions consist of 12 questions in the second part. The questionnaire survey for tax complexity provided is modification of the questionnaire used in Wasesa (2006). To test these two variables, the researcher distributed the questionnaire to be answered by choosing one of five points scale. According to Indriantoro (1999), the dependent variable means variable that is influenced by an independent variable. To test this variable, the researcher distributed the questionnaire to be answered by choosing one of five point scale.
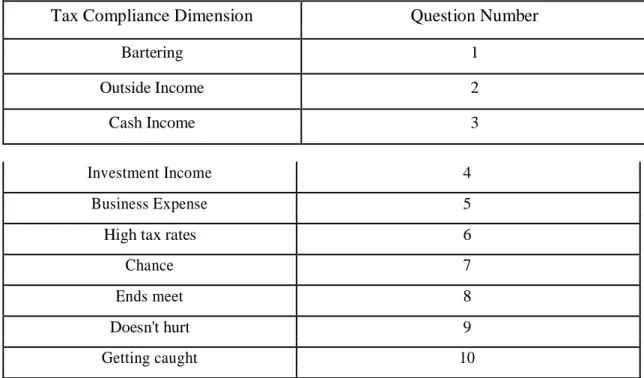
The tax compliance question consists of ten questions from Gilligan (2005) in the last part.
Sampling Design
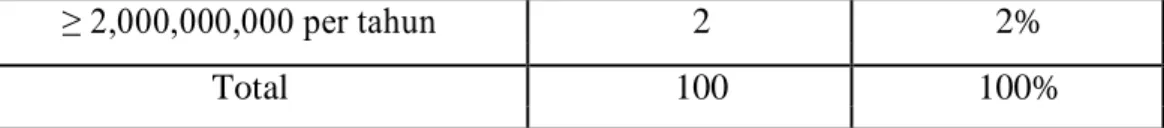
For the sampling method, the author chose a convenience sampling method, where data can be obtained easily, so that the researcher can select the sample very quickly (Indriantoro, 2002). Based on the above calculation, the total number of samples in this study amounts to no less than 99.1 rounded to 100 individual taxpayers.
Research Instrument
Statistical Analysis
- Validity Test
- Reliability Test
- Classical Assumption Test
- Multiple Regression Analysis
- F-Test
- T-Test
- Coefficient of Determinant (R2)
In the above equation, the value of the constant is obtained for 43.038, which means that it has positive influence on the independent variable (Tax Fairness and Tax Complexity). It can be concluded that tax compliance will increase if the independent variable increases. From the table of t-test output, it shows that the value of t counts at X1 = 2.708>1.984 (t-table) so that tax fairness has a significant effect on tax compliance. The value of t counts at X2 = 1.951<1.984 (t-table), so that Tax Complexity does not significantly affect tax compliance.
The result regarding tax fairness and tax compliance is supported by Davies (2015) in Bori, Nigeria, showing that there is a significant relationship between the perception of tax fairness and income tax compliance. The result indicates that exchange with self-interest and government influences income tax compliance behavior. Authors tested the exchange with the government dimension, which reflects the tax fairness dimension that is not significantly affected by tax compliance behavior.
In other words, tax compliance behavior is not influenced by the taxpayer's feelings of fairness in the exchange with the governmental dimension. This shows the higher complexity of taxes, then tax compliance has no impact on SMEs in Cikarang.
RESULT AND DISCUSSION
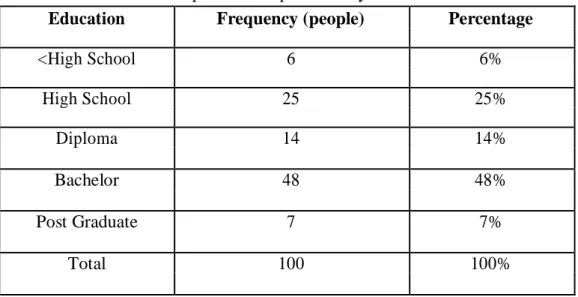
Characteristics of respondent
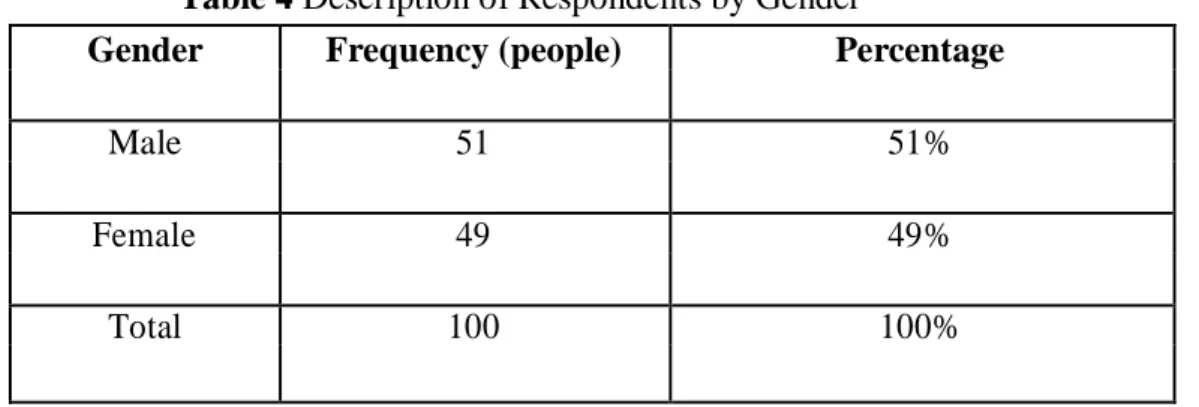
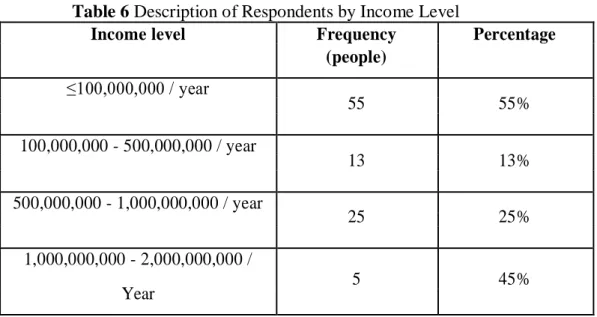
This data retrieval technique is done by distributing questionnaires to taxpayers who have NPWP and own businesses. Twenty-five taxpayers or 25 percent of respondents have a high school education, 14 taxpayers or 14 percent of respondents have a college degree.
Descriptive Analysis
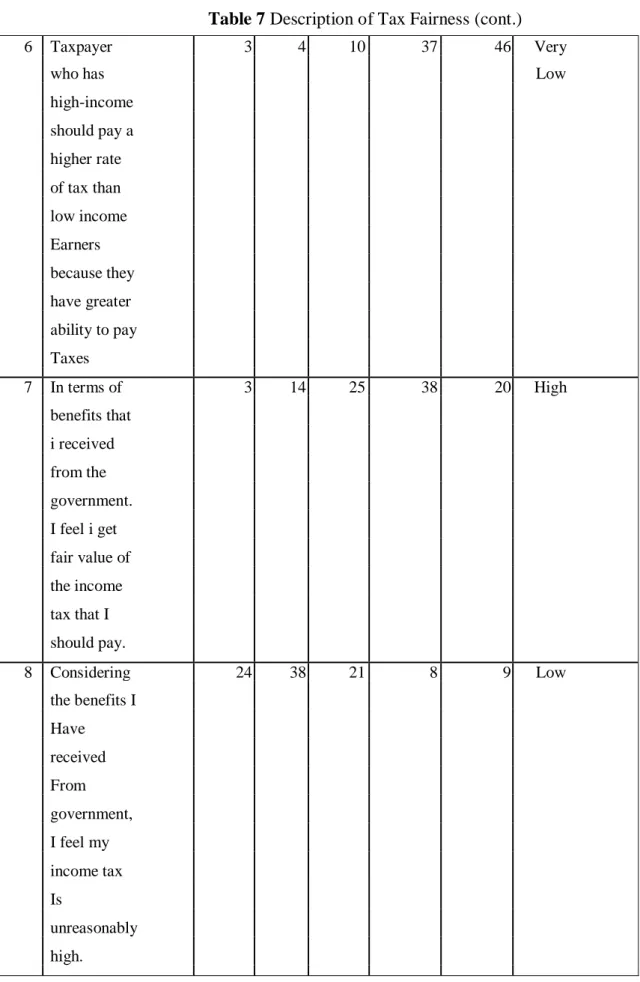
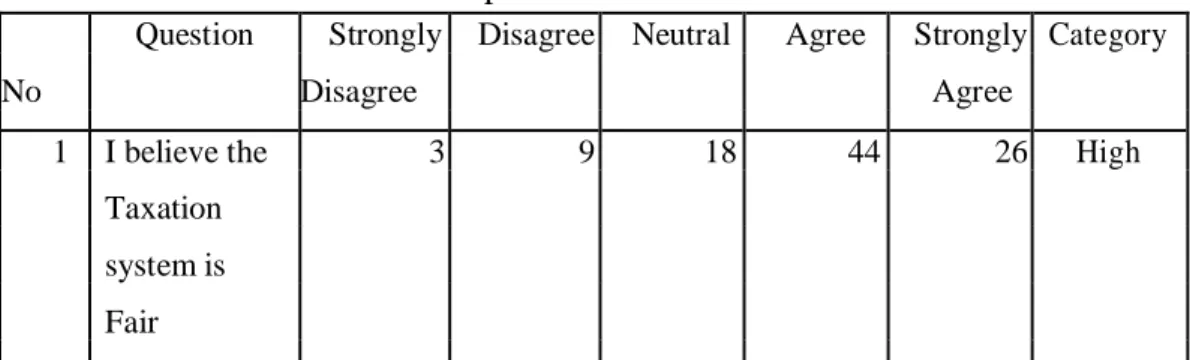
From the table above, questions number 6 and 8 have low scores and question number 7 has high scores in relation to tax fairness perception. From table above question number 9 and 10 have high score but question number 11 and 12 have low score in relation to tax justice perception. For tax fairness, based on table 4.4 above, it shows that the result of tax fairness variable for 100 Cikarang taxpayers has a high score.
It can be seen how the taxpayers' perception of the tax justice system applied in Cikarang based on the questions asked. But in question and 12, there are some respondents who still believe that the income tax is unreasonably high and not reasonable. For tax complexity, based on table 4.5 above, it shows that the tax complexity variable for 100 Cikarang taxpayers has a high score.
It can be seen how the taxpayer's perception about the complexity of tax system in Cikarang is applied from the question given. Most respondents still struggle to fill and calculate income tax and also feel that the tax system is complex. For tax compliance, based on Table 4.6 above, it shows that taxpayer compliance variable for 100 respondents in Cikarang has a high score regarding SMEs' tax compliance in Cikarang.
Statistical Analysis
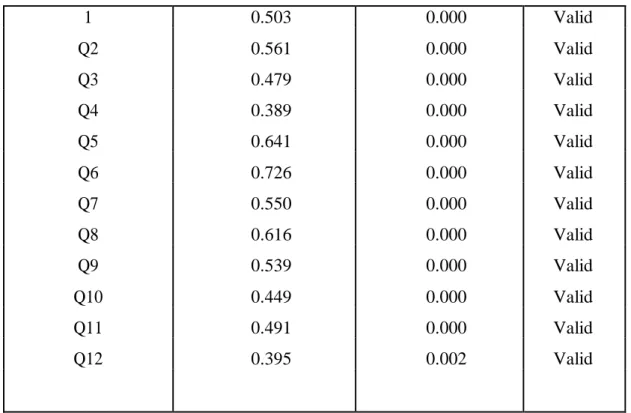
- Result of Validity Test
- Result of Reliability Test
So all items of statement instruments for each variable can be used in this research.
Result of Classical Assumption Test
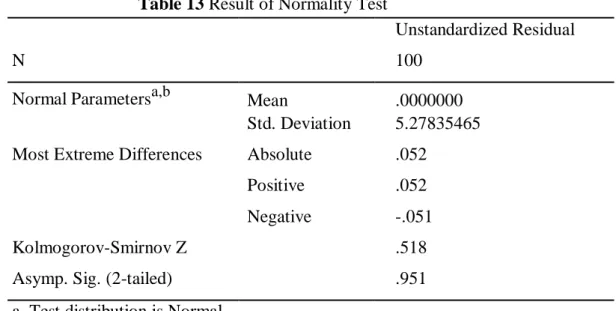
- Normality Test
- Heterocedasticity Test
And the variable Sig of Tax Complexity is 0.570, which means there is no heteroskedasticity. The result is supported by the research of Richardson (2006), the research was conducted in 45 countries, of the many variables that affect tax compliance, such as education, tax morale and fairness, the research showed that non-compliance is the biggest factor of tax complexity. . Tax compliance behavior is most influenced by tax fairness, as expressed by Richardson (2005) when he examines perceptions of tax fairness in Hong Kong and Australia.
Next, tax complexity is not significantly affected by tax compliance (sig. 0.054), so hypothesis H2: There is an influence between tax complexity towards tax compliance is not accepted. Although the respondents in this study have a high level of education, which means having a wider knowledge, but still has no significant effect on increasing tax compliance. The significant negative effect is done by Oyewole (2014), the study investigated the effect of tax complexity and tax compliance in African self-assessment environment. The result indicates that a tax complexity has a significant negative impact on tax compliance in Africa.
This study uses only two independent variables, which are the impact of tax justice and tax complexity. Tax compliance in a social environment: the influence of social norms, trust in government, and perceived fairness on taxpayer compliance.
Hypothesis Test
- Result of Multiple Regression Analysis
- Result of F test
- Result of t test
- Result of Determination of Coefficient (R2)
Discussion
The value of exchange with governmental dimension on the payment of tax does not become the reason for the taxpayer to comply by paying tax. The result can be explained based on the level of education of the respondents, where 69% of the respondents are diploma, bachelor and postgraduate, so the respondent who has a higher knowledge did not have difficulty in following the tax procedure or filling in the tax form, and it does not affect their compliance with to pay taxes. The various findings in research reported by the findings of Brainnyah (2013) revealed that at the same time taxpayers' compliance decision to pay tax is affected by tax complexity.
This survey is only conducted on SME taxpayers registered with the Tax Office (KPP) Pratama Cikarang Selatan. For KPP Pratama Cikarang Selatan, it should maintain integrity and fairness, support the tax itself to protect society's perception so that the taxpayer will continue to pay income tax voluntarily. In addition, researchers can use independent variables with more specific dimensions, such as the impact of the complexity of the tax return form, which were not used in this study.
CONCLUSION, LIMITATION AND
Conclusion
Limitation and Recommendation
- Limitation
- Recommendation
- Multicollinearity Test
Untuk penelitian lebih lanjut, Anda dapat mempertimbangkan untuk memilih sampel di beberapa daerah yang lebih besar, seperti Jawa Barat, untuk mendapatkan lebih banyak informasi dan memberikan kontribusi yang lebih besar. Persepsi wajib pajak: dampak konflik diametris terhadap penghindaran pajak wajib pajak dari sudut pandang deteksi penipuan, keadilan, ketepatan alokasi, teknologi sistem pajak dan kecenderungan pribadi (studi tentang wajib pajak orang pribadi).