Knowing and working with him all these years has been a truly inspiring and enlightening experience, which for me has been one of the most important lessons of my graduate education. One of the essential studies in neuroscience is the nature of this representation of information in the brain.
List of Figures
List of Tables
Chapter 1 Introduction
- The Neural Coding Conundrum
- Membrane Noise Sources and Neural Codes
- Organization of the Thesis
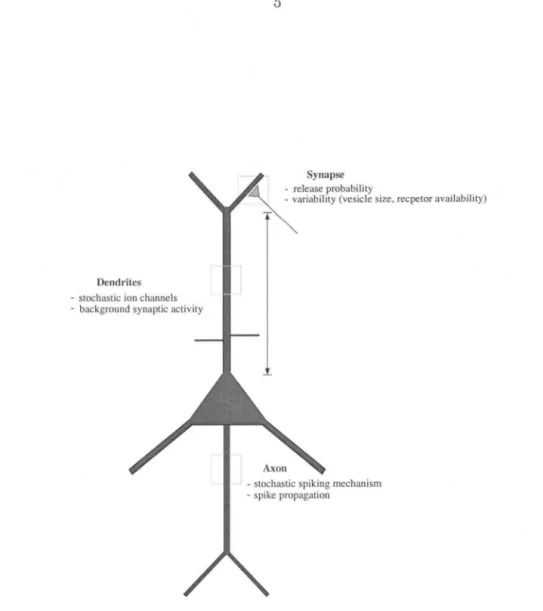
All these sources of noise cause jitter in the temporal structure of the inputs and limit the reliability and information transfer capability of the neural connection. In Chapter 7, we explore the role of neural firing abnormalities observed in vivo in information processing.
Chapter 2 Information-theoretic Analysis of Synaptic Transmission
- Introduction
- The Stochastic Nature of Synaptic Transmission in Cor- tical Neurons
- Channel Model of Synaptic Transmission
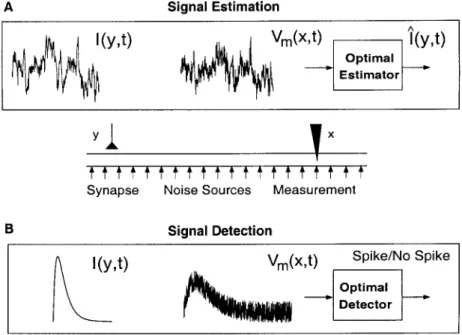
- The Signal Estimation Paradigm
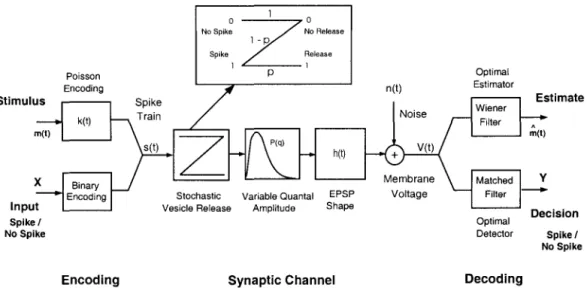
Thus, synaptic unreliability could lead to an increase in the bandwidth of modulation of the postsynaptic response. The binary channel (inset, p = Probability [vesicle release], 1 - p = Probability [error]) models probabilistic vesicle release, and the random variable q models the variability in the magnitude of the postsynaptic response of a single quanta observed in central synapses.
Estimation Channel Detection Channel
The Signal Detection Paradigm
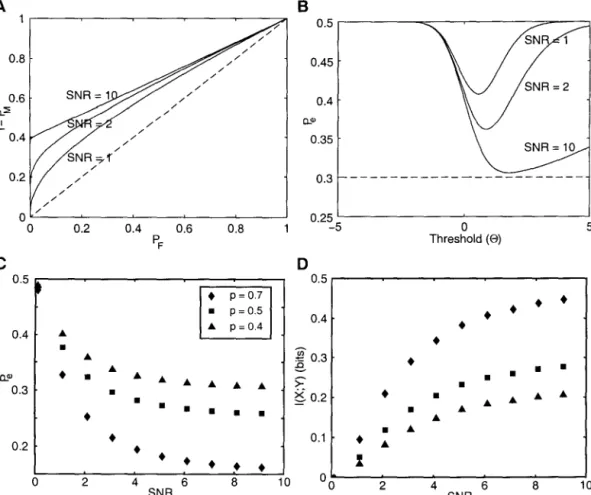
Using Bayes' rule, the peak conditional probabilities of the membrane voltage can be expressed in terms of release conditional probabilities as. By plotting Pe as a function of the threshold, we can graphically obtain the optimal value of 8 that minimizes Pe (Fig. 2.5).
SNR= 2
SNR = 10
Discussion
By evaluating the performance of this model in the signal estimation and signal detection tasks, we showed that a single synapse (intended to mimic a central synapse in cortex) was relatively inefficient in transferring information between neurons. This is a consequence of our assumption that the encoding relationship between the mean firing rate of the presynaptic neuron and the input is linear.
Chapter 3 Subthreshold Noise Sources in Biological Membranes
- Introduction
- Sources of Subthreshold Membrane Noise
- Thermal Noise
The power spectral density of the voltage fluctuations due to thermal noise (denoted by SYth) in a conductor of resistance R in equilibrium (no current flows through the conductor) is given by,. Cm arises due to the capacitance of the thin, insulating, phospholipid bilayer membrane, which separates the intracellular cytoplasm and the external solution.
2kTR
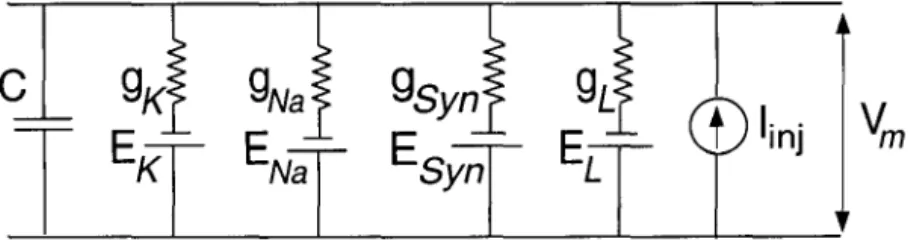
Voltage Noise Model
Current Noise Model
Noise Due to Background Synaptic Activity
A commonly used function to represent the time course of the postsynaptic change in response to a presynaptic spike is the alpha function ( RaIl, 1967 ; Koch, 1999 ). This means that each peak causes the same conductivity change and that the conduction change due to a series of peaks is the sum of the changes due to individual peaks in the train. If the spike train of the presynaptic neuron can be modeled as a homogeneous Poisson process with an average firing rate An, one can calculate the mean and variance of the synaptic current reaching the membrane.
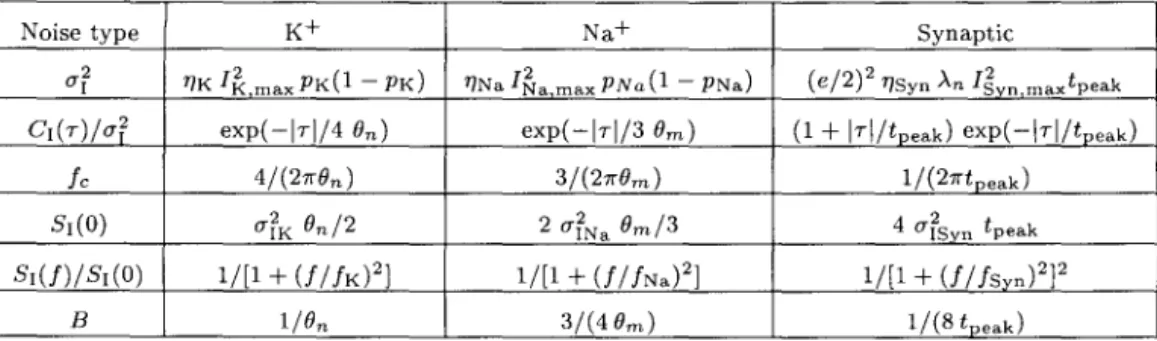
It has been shown that if the density of synaptic innervation is high or if the firing rates of presynaptic neurons are high and the change in conductance due to a single impulse is small, the synaptic current tends to a Gaussian process (Thickwell & Wan, 1980). If 'T]Syn denotes the synaptic density, the variance, autocovariance, and power spectral density are the noise of the synaptic current.
- Summary of Parameter Values Used
G is the deterministic conductance of the patch at rest and 9 is the random component due to conductance fluctuations. If the approximation is valid, the deviations (V) of the membrane voltage from the resting voltage should be small. Our perturbative approximation means that the statistical properties of processes 6 and In are evaluated at V = O.
Equation 3.55 cannot be solved analytically because of the non-linear (multiplicative) relationship between 6 and V. However, since the membrane voltage does not change significantly, in most cases the conductance deviations are small compared to the resting conductance of the cell3, which means 6 « 1, which allows us , to further simplify equation 3.55 to.
Results
The number of synapses in the soma is usually small, which leads us to 'fJSyn = 0.01 synapses/p,m2, i.e. 10 synapses. Synaptic transmission errors are not taken into account, but see Chapter 2 for an analysis of synaptic unreliability and variability. For comparison, the power spectrum of the voltage fluctuations due to thermal noise SYth (1) alone is also shown.
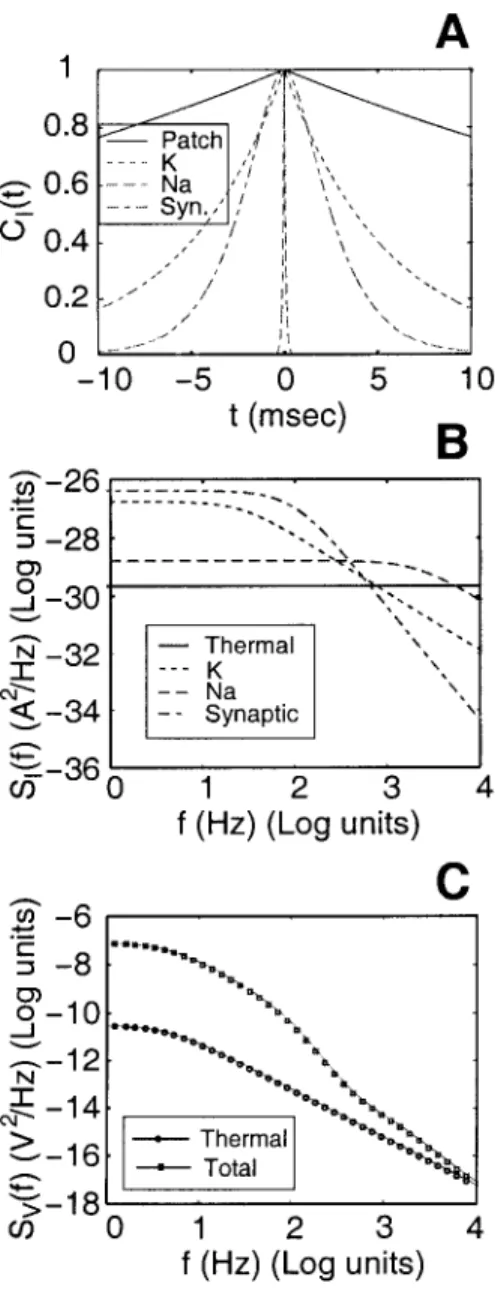
Total Syn
Dependence on Channel Densities
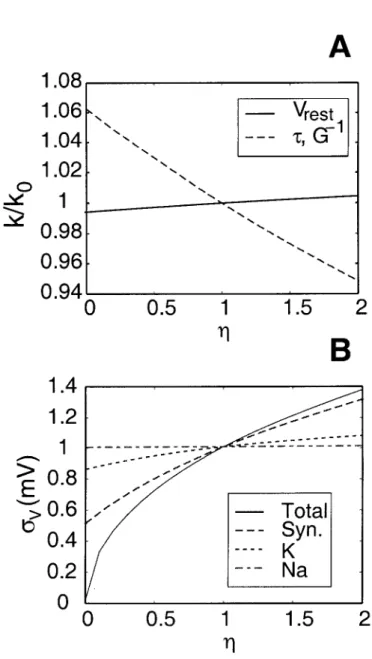
7] = 0 corresponds to a purely passive patch containing only leakage channels and 7] = 1 corresponds to the membrane patch scenario considered above (also called the nominal case). Despite the nonlinearities due to the active K+ and Na+ conductances, it is notable that the quantities vary almost linearly with 'T}, further justifying our perturbative approach. To consider the contribution of a given process to the noise magnitude, we vary its associated density in a similar manner to above ('T} goes from 0 to 2), while keeping the others at their nominal values.
We also compare the individual profiles with the case when all densities are scaled by the same factor. T} = 2) with respect to its nominal values, but the increase to about 1.07 mV due to the doubling of the K+ density is much smaller.
Discussion
It is clear from the figure that the synaptic noise is the dominant sound source. The noise magnitude drops approximately from 1 mV to 0.5 mV in the absence of synaptic input (since 'T} varies from 1 to 0), but only to approximately 0.85 mV in the absence of K+ channels. This approach allowed us to write the stochastic differential equation 3.55 for the dynamics of voltage fluctuations.
However, under the simplifying assumption that the conductance fluctuations are small compared to the total resting conductance, equation 3.55 reduces to a linear stochastic differential equation which is straightforward to analyze. We will show in Chapter 4 that a similar calculation can be applied when noise sources are distributed in complex one-dimensional neuronal cable structures.
Chapter 4 Information-theoretic Analysis of Electrotonic Propagation in Weakly-Active
- Introduction
- The One-Dimensional Cable Equation
- Subthreshold Noise in Linear Cables
- Electrotonic Signal Propagation in Linear Cables
- The Signal Estimation Paradigm
- The Signal Detection Paradigm
Details of the derivation of the cable equation can be found in the literature (RaIl, 1969a; Tuckwell, 1988a). This can be seen by changing the bounds of the time variable to (-00, t) in Equation 4.15. G Fn depends on the factors (geometry, boundary conditions, etc.) that determine the Green's function of the cable.
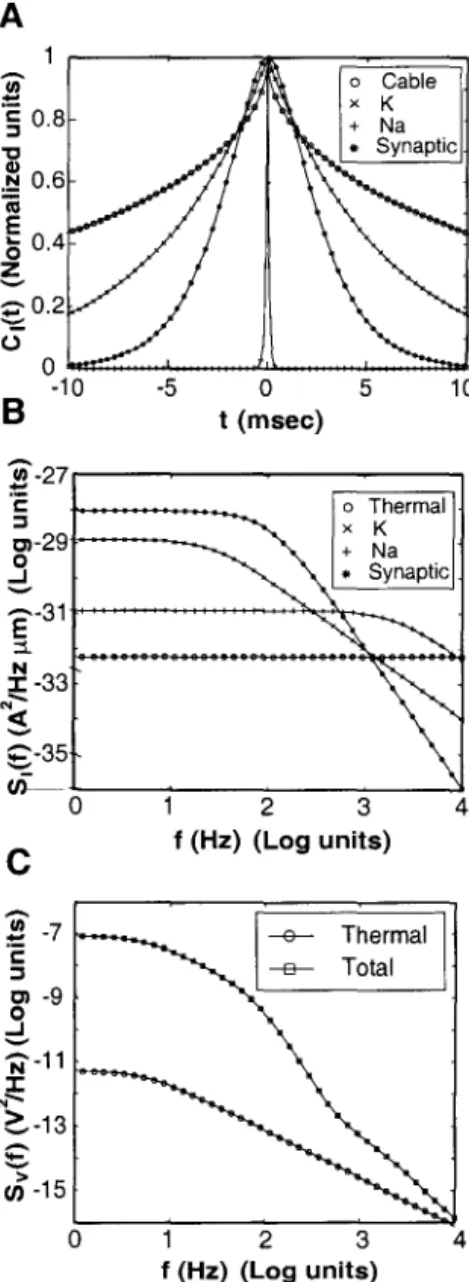
Similarly, the power spectrum of the noise component, Vn(x, t), defined as Sy(x, y, j), is given by. Note that the calculation of £ only requires knowledge of the signal and noise spectra (Ss(f) and Sn(f) respectively) and the Green function g(x, y, t) of the cable.
- Results
- Signal Propagation in a Weakly-Active Dendrite
- Efficacy of Signal Detection
- Comparing Cable Theory and Information Theory
- Dependence on Biophysical Parameters
- Discussion
The optimal value of the threshold e depends on the standard deviation (J and prior probability Po. The normalized autocorrelation functions of the noise sources and the Green's function of the cable are compared in Fig. The power spectrum of the voltage fluctuations due to thermal noise alone SVth (1) is also shown for comparison.
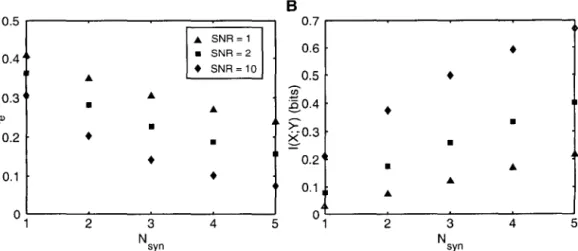
This critical distance depends on the signal-to-noise ratio of the detection task and increases with Nsyn. This threshold behavior is due to the non-linear threshold decision rule of the signal detection task.
Chapter 5 Data
Analysis of Preliminary Experimental
5 .1 Introduction
Proposed Plan of Experiments
Before performing any pharmacological manipulations, it is important to determine the impedance and time constant of the membrane. The three-dimensional morphology of the neurons recorded from can be reconstructed by staining and used to construct detailed compartment models (see Fig. 5.2). Characteristics of the noise in the apical tuft can thus be expected to be different from the noise at the soma.
Dual recordings from the soma and dendrite are also very useful for constraining the passive cable properties of the measured neuron. Together with the morphological data obtained from the reconstruction, the properties of the cable can be used to produce a faithful compartmental representation of the neuron.
Summary of Performed Experiments
- Preparation and Recordings
- Measurement of Instrumental Noise
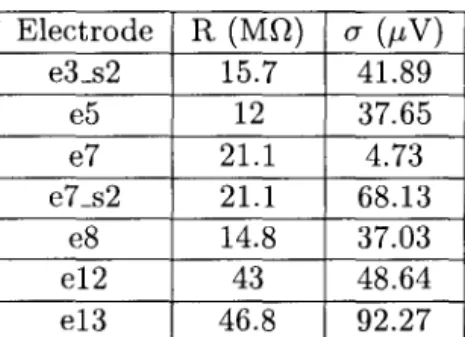
The duration of the experimental recording determines the smallest frequency difference that can be resolved. In order to accurately estimate the power spectrum of the noise, 20 different sample records were collected. An example of the voltage response in these epochs is shown in the third row of Fig.
The voltage responses are compared to assess the recording stability during the session. Instrumental noise power spectral density measured by placing the electrode in saline is also shown (black line).
Chapter 6 Subthreshold Membrane Noise due to Channel Fluctuations
- Introduction
- Methods
- Results
- Discussion
G is the sum of the steady-state conductances due to the active ion channels and the passive leakage. The power spectrum for In is calculated from the Markov model of the channel kinetics. Circles indicate simulations and the solid curves represent the results of the quasi-active linearized model.
Standard deviation of the voltage noise av in a range of 1000 p,m 2 as a function of the stable membrane voltage V~. For the kinetic schemes examined here, the distribution of the voltage noise also simplifies in a way that is conducive to large-scale modeling.
Chapter 7 Variability and Coding Efficiency of Noisy Neural Spike Encoders
- Introduction
- Models of Spike Encoding
- Integrate-and-fire Models
- Optimal Linear Estimation
- Results
- Discussion
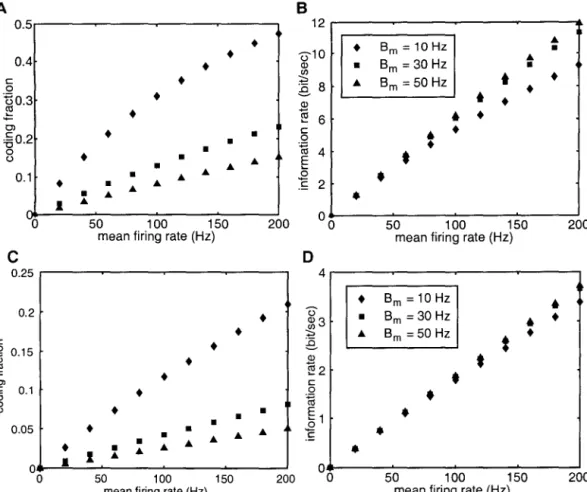
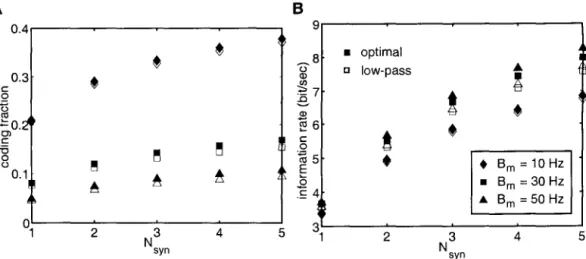
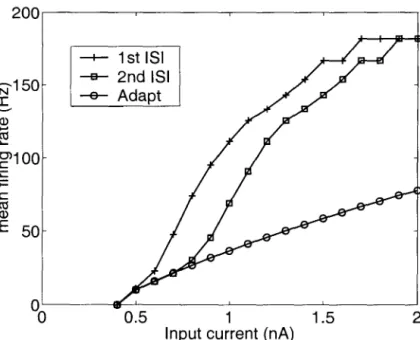
The membrane voltage of the perfect integrator in response to an input current i(t) is given by. The dependence of the average firing rate of a model (in response to constant current injection) on the magnitude of the injected current is called the f-I curve. Panels C and D show the dependence of the encoding fraction ~ in the signal estimation task for the two types of spike models on the mean firing rate.
Next, we investigated the dependence of the mutual information rates on the mean firing rate and input bandwidth. Thus, estimating the input is equivalent to estimating the instantaneous firing rate of model from the spike train.
Chapter 8 Conclusions
Thus, it is still unclear which of the above is the most important source of biological noise. Information theory provides us with measures that can be used to study the relevance of different sources of membrane noise to biological signal processing. We showed that depending on the nature of the task, variability can either represent a faithful encoding of the input and lead to an improvement in performance or represent noise in the spike generation mechanism and lead to a significant loss of performance.
We are currently analyzing these noise sources using detailed biophysical models and studying the effect of the measured noise on the temporal precision of spike firing in anatomically and physiologically characterized neuronal models. As we began this investigation in the search for a solution to the neural coding problem, it is appropriate that, in closing, we leave the reader with this point to ponder: "Is noise a bug or a feature?" That is, does neuronal noise simply impair the ability of neurons to detect weak signals and impose a limit on the brain's computing and communication capabilities, or can noise also play a positive functional role (Koch, 1999).
Chapter 9 Appendix
It also provides a model-independent measure of the similarity between arbitrary covarying quantities a and b, the so-called mutual information (denoted J(a; b)) between a and b. In general, the information rate depends on the joint probability distribution of the two processes. The calculations only required knowledge of the power spectra and the cross spectra of the two processes (second-order statistics).
The Gaussian assumption allows us to derive closed-form expressions for the information rate as well. In an experiment, the choice of input is usually up to the experimenter, and so m(t) can be assumed to be Gaussian by design.
B Estimation With Multiple Synapses
Assuming that the second term in the above expression is negligible, the shot noise is multiplied by a factor compared to the ideal case. In the signal estimation paradigm, both the signal and the noise were continuous random processes. This indicates the functional utility of the system to perform a signal detection task such as the one studied here.
We restrict ourselves to the binary case, where the array has two elements, ie, signal (denoted by m(t)) and noise (denoted by n(t)). Thus, a signal detection task involves making a decision about the presence or absence of a known signal m(t) buried in noise n(t) based on s(t) observations.