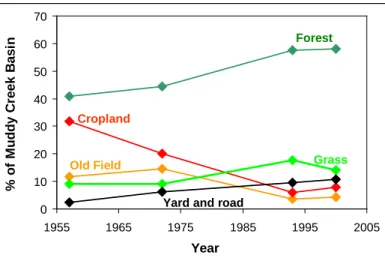
Donald Weller describes an analysis of land use change from within the Muddy Creek drainage of the Rhode River watershed. They then compared the distribution of Phragmites in 2007 with that in 1971-2 on developed and forested sides of the Rhode River. Finally, Hines and colleagues report on long-term sampling of living resources in the Rhode River in Chapter 6.
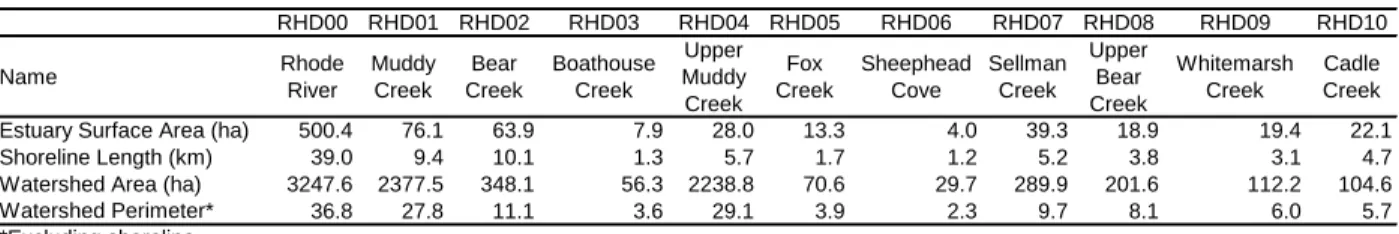
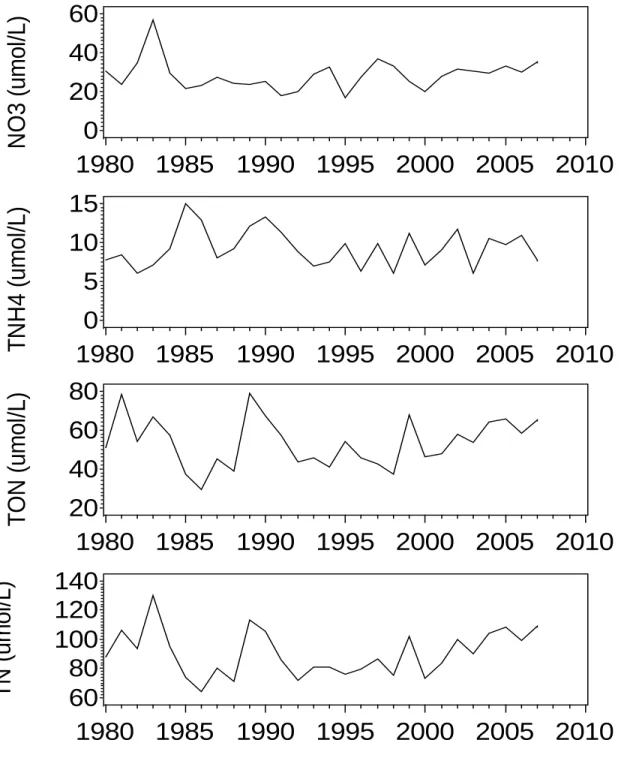
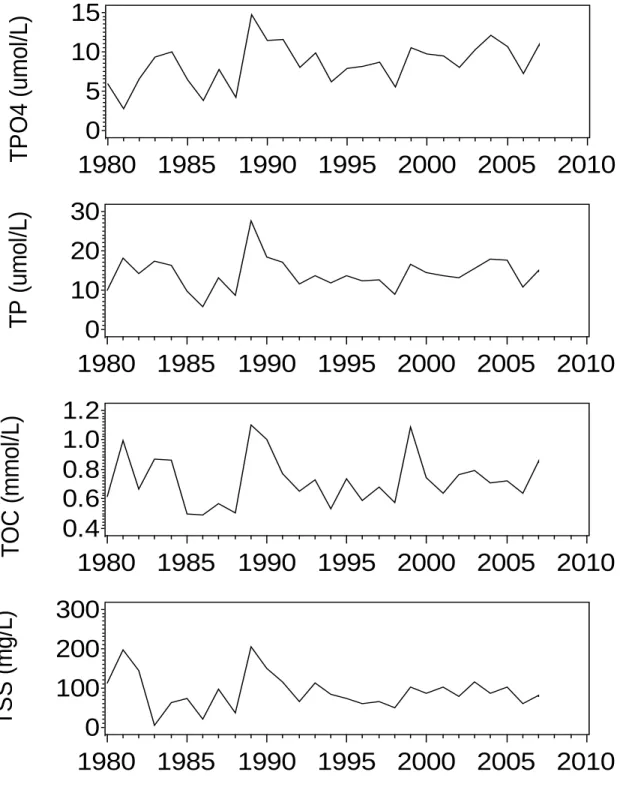
In contrast, atmospheric inputs of P and organic C are trivial compared to other sources in the Rhode River estuary (Jordan et al. 1991a). SERC monitors watershed discharges into Muddy Creek, the largest tributary of the Rhode River estuary. SERC has monitored water quality in the Rhode River Estuary since the early 1970s, but most intensively since 1980.
Detailed time series analyzes have resolved the separate influences of the Susquhanna and local watersheds on nutrients and chlA in the Rhode River (Jordan et al. 1991b). Phragmites covers on developed and forested sides of the Rhode River and compared the genetic variation in patches on both sides. The genetic similarity between gene phenotypes was compared within patches and with other patches in the Rhode River using F and R statistics.
Definition and mapping of patches: We identified 212 Phragmites patches in the Rhode River subestuary in 2007, 49 on the developed and 159 on the forested side of the subestuary. The distribution of Phragmites in the Rhode River subestuary has been significant since McCormick and Somes (1984) mapped tidal wetland vegetation in 1971–2. Variation in seed viability, genetic diversity, and leaf nutrients of non-native Phragmites australis in the Rhode River, a subestuary of Chesapeake Bay.
INTERANNUAL VARIATION IN GELATINOUS ZOOPLANKTON AND THEIR PREY IN THE RHODE RIVER, MARYLAND
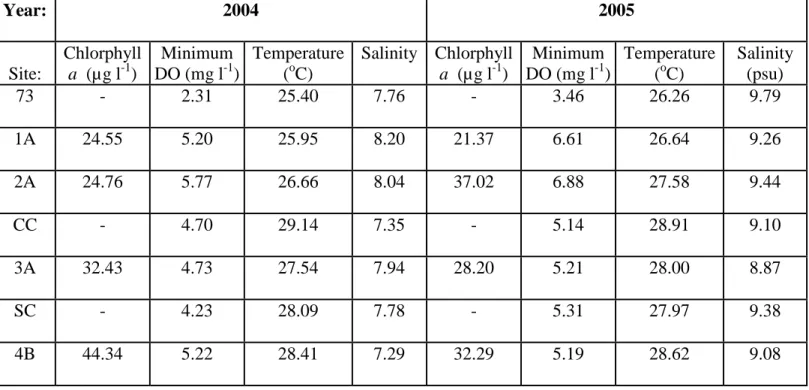
We sampled seven sites: six within the Rhode River and one just outside the river's mouth in the mainstem Chesapeake Bay. The sites were chosen based on previous research conducted in the Rhode River and designed to cover its entire length. Additional temperature, DO, and salinity data were available from the monitoring station located at the pier of the Smithsonian Environmental Research Center (SERC) in Rhode River, which was equipped with a YSI 6600 meter (C. Gallegos, SERC, unpublished).
Surface salinity also varied significantly among sites (F = 3.55, p < 0.01), and was generally highest at the bay site (site 73) and at sites near the mouth of the Rhode River. Salinity remained below 8 except for a brief period in 2004, but exceeded 8 for most of the summer in 2005. However, the previous week's chl a concentration explained a larger percentage of the variation in both of these measures for M .
With an average depth of 2 m, the shallow bathymetry of the Rhode River may limit the possibility of coexistence of M. Mnemiopsis leidyi in the Rhode River, egg production was similar to that of eggs collected in the field from elsewhere in the Chesapeake Bay (Purcell). et al., 2001), including the Patuxent River (D. Breitburg and R. Burrell, unpublished). These characteristics of the Rhode River allowed us to examine the gelatinous zooplankton food web in the river in two different years: one with a strong influence of a top predator and one without.
Changes in the lower Chesapeake Bay food chain in the presence of the sea nettle Chrysaora quinquecirrha (Scyphomedusa). Timing and size of blooms of the ctenophore Mnemiopsis leidyi in relation to temperature in Narragansett Bay, RI. For very large estuaries, phase II of the female's spawning migration out of the bay mouth is not well documented or understood.
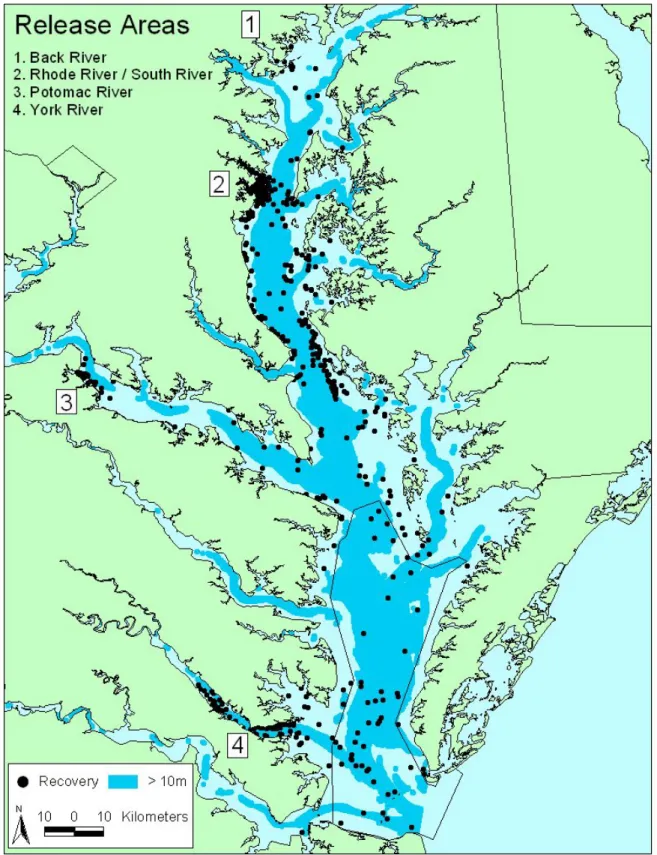
The markings were attached to the back surface of the armor with ductile aluminum wire or annealed stainless steel wire. Department of Natural Resources to seasonally close Maryland's mature female fishery under two proposed legislative changes. Most females (6,393 or 76.1%) were released near the Rhode River; 1,507 females were released into the York River; 271 females in the Potomac River; and 169 females in the back river of the upper Chesapeake Bay.
OCT 10
Chesapeake Bay, although all release locations were only on the western shore of the bay (Figure 3). Most migrating females were recaptured along the shallow edges of deeper tributaries (Potomac and York Rivers) and the main trunk of the bay. In the Chesapeake Bay, our fishery-dependent data indicate that mature females migrate along the shallow edges of deep tributaries and the main body of the bay.
Importance of blue crab life history for stock improvement and spatial management of the fishery in. Evaluating the effectiveness of the blue crab spawning stock reserve in Chesapeake Bay using tag return methodology. This research tracks seasonal, annual and decadal variation in species composition and abundance of all fish and macroinvertebrates of the system.
These fish, blue crabs and other epibenthic species are sampled with triple otter trawls at 4 stations spread along the axis of the Rhode River. For nearly 30 years (since 1979), we sampled community dynamics with cores at 4 stations along the Rhode River axis. For nearly 30 years (since 1980), we sampled the summer abundance and species composition of coastal fish communities using seines towed at 13 stations distributed throughout major Rhode River riparian habitats.
Major long-term patterns of species composition and fish assemblage dynamics on the Rhode River coast are described below. term Species composition and dynamics of the coastal fish assemblage. As in many parts of the Chesapeake Bay and the temperate eastern United States, the water temperature of the Rhode River can vary widely between seasons, from 0 to 33°C. The species composition of the coastal fish assemblage showed significant temporal variation during this study period. variations.
The coastal fish assemblage showed a significant spatio-temporal interaction, as the species composition of the spatial groups of stations differed in their patterns of temporal variation (Figure 5). These fluctuations showed general decadal patterns of variation between dry years in the 1980s, wetter years in the 1990s, and more variable periods of precipitation in the 2000s. However, many subestuary-dwelling estuarine species (e.g., mummichog) have varied with no clear temporal pattern as they are adapted to withstand large fluctuations in environmental conditions.
The species composition of the coastal assemblage showed considerable spatial variation from the low salinity areas of the creek to the more open and higher salinity shores of the main stem of the Rhode River subestuary. Summary of the catch composition of the inshore fish community in the Rhode River sampled by summer seine surveys at 13 stations during the 28-year period, 1980–2007.
CP CHB
Annual variation in the similarity of fish species composition at 13 inshore seine stations in the Rhode River Basin, Maryland. The figure shows a two-dimensional MDS plot of the annual mean abundance of inshore fish species during summer sampling for the 28-year period from 1980 to 2007. Symbols indicate statically significant groups of similar species composition identified by the SIMPROF procedure.
Long-term variation in abundance (mean CPUE) at 13 stations for the eight most common fish species captured by the Rhode River inshore trawl survey over a 28-year period, 1980–2007. The figure shows a two-dimensional MDS plot of mean abundance by nearshore summer sampling stations of fish species in the Rhode River over the 28-year period 1980–2007. Symbols represent SIMPROF spatial groups: red. triangles indicate major stations; blue squares indicate Creek stations; and green inverted triangles indicate stations in the upper part of the water.
The line represents the linear trajectory from the mouth of the Rhode River to the headwaters. -D) shows the 1st-stage MDS plots of temporal change for the Headwater, Creek, and Mainstem assemblages, respectively.