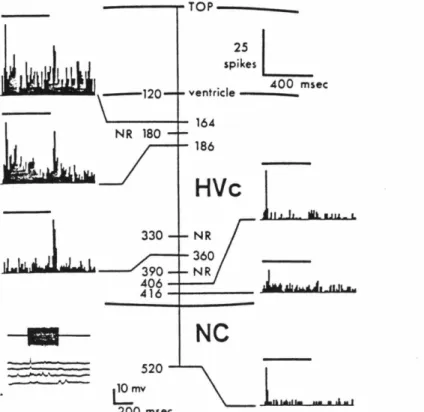
A retrogradely transported fluorescent tracer is injected, in vivo, into a specific efferent target of neurons in area 17 (A 17) of the cat. In general, most of the response properties are explicable based on the known physiology of layer VI. Subsequent penetrations, made at several other positions (usually at least 6), generally mapped the extent of the LGN.
Dorsal (top) and medial (bottom) views of the cat's brain; shading indicates the area used for making cortical slices. In the lower part of the field, the slices are separated from the piece and are in an ACSF-filled petri dish, awaiting transfer to the holding chamber. Cells were penetrated by applying large (90 mV) positive voltage pulses (duration of 200 msec) to the stimulus input port of the amplifier.
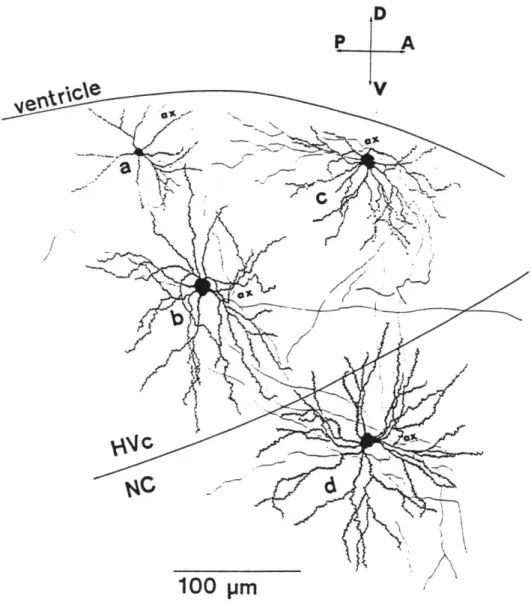
Therefore, no corrections were made for tissue shrinkage in any of the data presented below. Most cells showed very dense, granular labeling in the soma extending halfway into the proximal part of the apical dendrite (Fig. 5c). LeVay and Sherk (1981a) described the projection from A 17 to the claustrum as originating from cells in the middle of lamina VI and comprising less than 5% of the cells in the layer.
They also noted that more cells were labeled in the part of A17 that serves the peripheral parts of the visual field than in the areas that serve central vision.

ACTION POTENTIALS
All three cells show many of the characteristic features of claustrum-projecting cells: the thick, asymmetric basal dendritic process (indicated by open arrows in [a] and [c]), dense-tipped apical dendrite with short lateral branches (most clearly seen in [ a] and [c]). a] and [b]), and axons with thin, horizontally oriented intrinsic collaterals (indicated by solid arrows in [a] and [b]). A claustrum projection cell with an extreme example of the basal dendritic asymmetry, and the difference in horizontal extent of basal and apical dendrites. Sector Sholl analysis of the basal dendritic arbors of LGN and claustrum projecting cells, as described in the text.
As a rule, the horizontal range of apical dendritic arborization was much narrower than that of basal dendrites. Interestingly, such processes always had about twice the horizontal extent of the main apical dendritic ridge. The density of spines of the basal dendrites, although high, did not reach the density of the most spiny part of the apical dendrite.
The structure of the intrinsic axonal arbor formed the most obvious, consistent feature of claustrum-projecting cells. Significant portions of the basal dendrite arborize in the white matter adjacent to layer VI. Close-up of the efferent axon and horizontal collaterals of the cell shown in Fig.
The thicker process at the top of the figure, a dendritic process of the same neuron, also abortes in the white matter. In the detailed descriptions given below, the properties of the class I and II cells are considered together as they make up the bulk of the geniculate protruding cells; The shapes of the basal dendritic arbor were analyzed by the sector Sholl method as described for claustra.
As with the claustrum projecting cells, the appearance of the intrinsic axonal arbor formed the most consistent and obvious feature of the geniculate projecting cells. In terms of axonal arborization, class I and II cells mainly differ in the thickness and horizontal spread of the ascending collaterals. These cells had a range of soma sizes and shapes indistinguishable from those of the class I and II cells.
Similarly, class III cells had a dendritic field structure virtually identical to the class I and II cells, with 6–8 thin basal dendritic arms, of the same length, arranged radially around the soma ( Fig. 30 ). Within layer VI, the apical dendrite gave rise to several short side branches, with a horizontal extent less than that of the cell's basal dendrite (Figs. 29-31).
LGN PROJECTING CELLS
Histogram of the number of cells with efferent and recurrent axon collaterals in the smallest intervals distinguishable by light microscopy. Statistical comparison of cell body area distributions for claustrum and LGN projecting cells showed no significant difference (Fig. 10). The smallest cells of the geniculate class (<80 llm2), however, were smaller than the smallest claustrum protruding cells.
The horizontal extent of these branches is often considerably greater than that of the basal dendrites. Sholl analysis of the apical dendritic arbors of LGN- and claustrum-projecting cells (using a distance of 20 µfi between concentric circles), each point shows the mean of 7 cells, ± S.E.M. Both the larger horizontal and vertical extent of the apical dendritic arbor of LGN-projecting cells are evident.
Large, widespread injections of various retrograde tracers into the nucleus of the lateral geniculate label as many as 6096 cells in layer VI (Gilbert and Kelly 1975, LeVay and Sherk 1981). The overall pattern of the inner axonal arbor closely resembled that of projection cells of class I or II generation: thick, vertically oriented axons with only very sparse collateralization within layer VI. The axon also shows characteristic features of claustrum projecting cells; in addition to the horizontal orientation of the processes, the axon occasionally sends short, vertically oriented subcollaterals.
At least in layer VI of the adult cat, they appear to be quite common. Their definition of the direction of a projection rests on the anatomical relationships between two areas. Ablation of the claustrum (by kainic acid injections) has rather mild effects on the responsiveness of cells in A 17, reducing end stops.
However, O'Leary's (1941) group of pyramidal cells in layer Va, which lies just above the surface of the large pyramids of layer V, has many of the characteristics of retrograde cells. As described in the results, the characteristics of the axons of different types of geniculate projecting cells in layer VI show a certain morphological association with the characteristics of the specific afferent. In monkeys, where X- and Y-like cells can be separated into the parvi- and magnocellular layers of the geniculate (Hubel and Wiesel 1972), apparently different morphological types of cells in layer VI project to one or the other geniculate layer (Lund and Boothe 1975).
For example, Guillery (1966) observed changes in the morphology of the different classes of LGN neurons. between young animals and adults;. The only cell that showed a significant apical dendritic arbor in layer I was an intrinsic pyramidal cell of the claustrum-projecting type (Fig. 39).
Le Yay (1978) Axonal arborization of lateral geniculate neurons in the striate cortex of the cat. 1967) Pattern of fiber degeneration in the dorsal lateral geniculate nucleus of the cat following lesions in the visual cortex. In The Use of Axonal Transport for Studies of Neuronal Connectivity, W. 1973) Synaptic patterns in the visual cortex of the cat and monkey.
Hirsch (1978) Receptive field properties of neurons in different laminae of visual cortex of the cat. 1967) Receptive fields and firing characteristics of ganglion cells in the visual stria of the rabbit retina. Studies on the structure of the cerebral cortex. 1973) Organization of neurons in the visual cortex, area 17, of the monkey (Macaca mulatta). Boothe (1975) Interlaminar connections and pyramidal neuron organization in the visual cortex, area 17, of the Macaque monkey.
Identification of corticotectal cells of the cat visual cortex by horseradish peroxidase. 1983) Activity of cells in area 17 of the cat in the absence of input from layer A of the lateral geniculate nucleus. Van Essen (1983a) Functional properties of neurons in the middle temporal visual area of the Macaque monkey.
Van Essen (1983b) Functional properties of neurons in the middle temporal visual area of the Macaque monkey. Visual field projection to the lateral geniculate and medial interlaminar nuclei in the cat. Stryker (1978) Ocular dominance in layer IV of visual food cortex and the effects of monocular deprivation.
Rakic (1981) The emergence of efferent connections from the visual cortex of the fetal rhesus monkey. Legendy (1978) Functional organization of the corticofugal system from visual cortex to lateral geniculate nucleus in the cat. 197 5) The patterns of projection of cortical areas 17, 18 and 19 onto the laminae of the dorsal lateral geniculate nucleus in the cat.