Thank you Matthew Shum for being consistently sweet and supportive through what have been sometimes difficult times. Antonio Rangel, thank you for being the biggest fan of my academic presentations and communication style.
INTRODUCTION
The Benefits of Field Data as a Compliment to Lab and Survey Measures The pros and cons of data collected from laboratory experimentsThe pros and cons of data collected from laboratory experiments
Yet other "games" of social preferences. the main target of criticism of Levitt and List, 2007) may not be replicated in real-world situations. The main advantage of research using field data is the ability to test whether theoretically and/or experimentally informed research findings are replicated in natural selection settings.
Obtaining Lab-Level Control in a Field Experiment Running experiments in the fieldRunning experiments in the field
Once the machine was installed, we were given a series of tutorials (followed by several weeks of trial and error) to learn how to use the machine's hardware and software. In addition to the hardware, we had to become familiar with the software that would allow us to operate the machine remotely.
Embracing an Interdisciplinary Approach Seeing the same behavior from more than one lensSeeing the same behavior from more than one lens
In some fields, including economics, there are still authorship norms that create strong incentives against interdisciplinary work (ie, an emphasis on stand-alone articles). A review and analysis of the use of 'habit' in understanding, predicting and influencing health-related behaviour.
IDENTIFYING SELF-REGULATION FAILURES IN THE FIELD
ABSTRACT
Introduction
We find field evidence of such spillovers, and particularly of self-regulatory (or self-control) failures, where positive exercise behavior leads to more indulgent food behavior. When asked directly, only 24% of the surveyed population (which is a subset of the population for which we have empirical data) believe that the reason for their unhealthy lunch choice is due to fatigue at the beginning of the day.
Theoretical Framework
Some studies have looked at how consumers believe they have "earned the right to indulge." In a series of studies, Kivetz and Simonson, 2002 found that when consumers put a lot of effort into earning their frequent flyer points, they were more likely to choose an indulgent luxury reward (and more likely to choose a frequent flyer offering a luxury reward). Therefore, self-licensing theory predicts that morning exercise—a behavior that requires a lot of restraint and effort on the part of the individual—should lead to more indulgent behavior later on.
Data
3Less than 1% of the data set consisted of cash or credit/debit card transactions. 4We used the university's students rather than an outside population because some lunch items require you to have experienced them in the cafeteria.
Behavioral Results
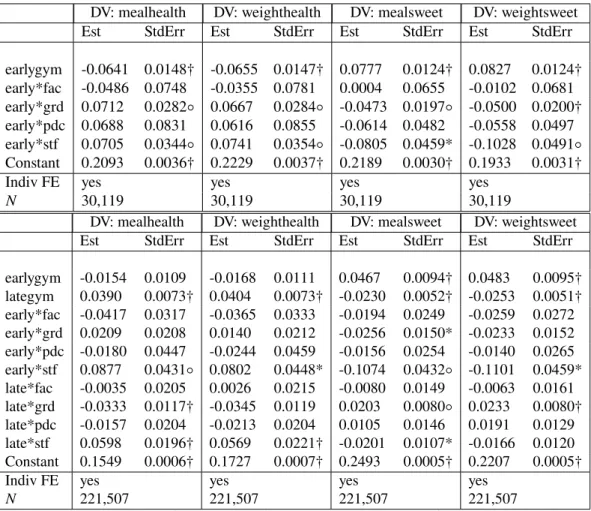
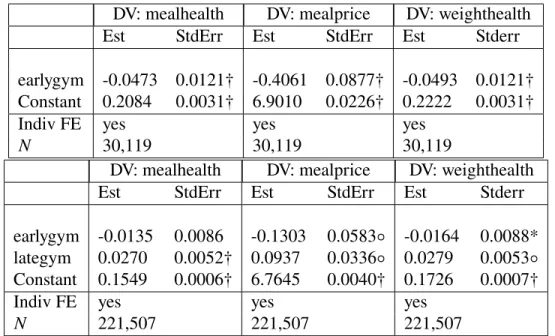
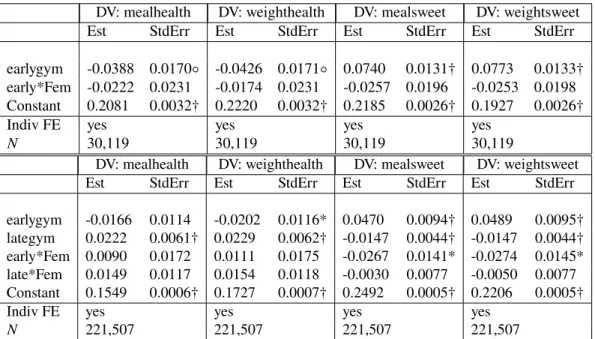
Health at lunch is typically 2.7-2.8% higher for people who go to the gym in the afternoon. In Table 2.7, based on two measures of meal sweetness (a pure average of the sweet scores associated with all items purchased, and a weighted average of the sweet scores of lunch items, weighted by price), we see that sweeter items are purchased by individuals. when they go to the gym in the morning.
Mechanism
As the bottom panel in this table shows, the time difference between gym use and lunch is quite large: on average, early gym goers eat lunch 3.49 hours after starting their morning gym session (mean, not reported, it is 3.1 hours). Such a long delay between gym use and lunch casts doubt on a biological mechanism as an explanation for our results.

Discussion
First, our evidence confirms that self-licensing is an empirically relevant feature of behavior "in the wild" and that well-intentioned policies that promote virtuous or healthy behavior can backfire, not realizing that the benefits of that behavior can be offset by compensating for unvirtuous behavior. or unhealthy behavior. The relationship between substrate metabolism, exercise, and appetite control: Does glycogen availability affect motivation to eat, energy intake, or food choice? In: Sports Medicine 41.6, pp.
PREDICTING CONTEXT-SENSITIVITY OF BEHAVIOR IN FIELD DATA
Introduction
Therefore, many habitual behaviors have two main hallmarks: predictable context sensitivity (Ji and Wood, 2007, Danner, Vries, and Aarts, 2008) and automaticity (Orbell and Verplanken, 2010, Gardner, Abraham, et al., 2012). . To our knowledge, only three observational studies have studied habit formation over time in nature, all of which relied on research volunteers completing daily self-report questionnaires. The earliest of these is Lally et al., 2010, in which 96 university volunteers were asked to perform an eating, drinking or exercise behavior every day in the same context for 12 weeks and self-report the strength of the habit every day .
This potential for misattribution has raised concerns about the exclusive use of self-report methods to study natural habit formation processes ( Harrington, 2017 , Rebar et al., 2018 ).
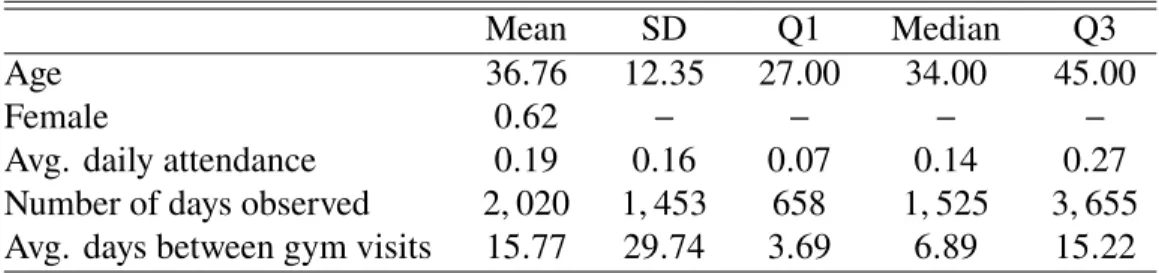
Study 1: Gym Attendance Human Subjects ProtectionsHuman Subjects Protections
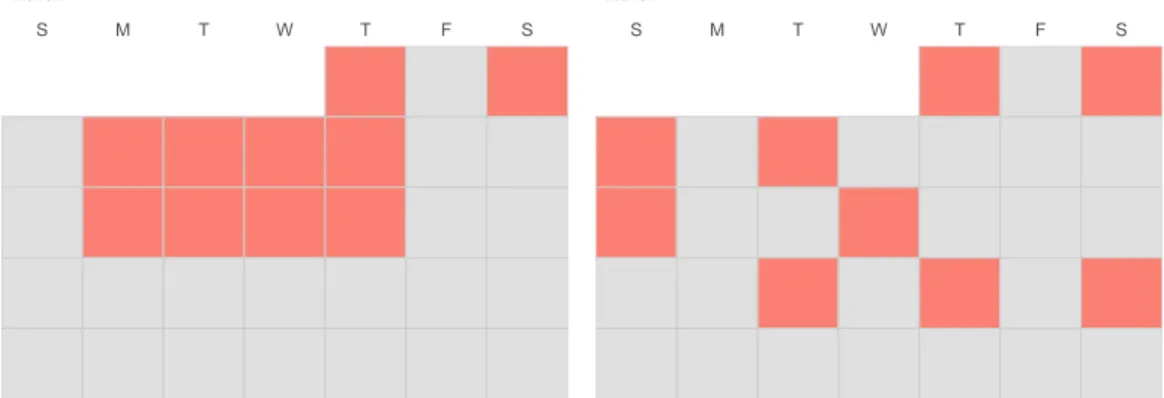
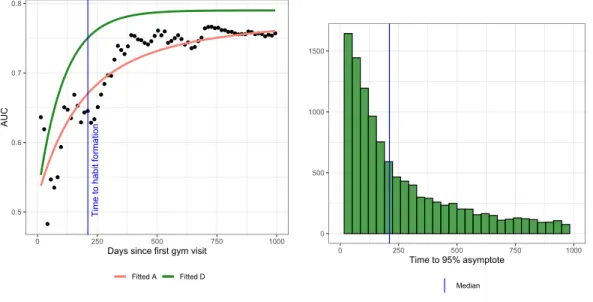
We use five-fold cross-validation, training the model on 85% of the full time series data for each individual (see Appendix C). Finally, days of the week were significant predictors for more than half of the gym goers in the data (illustrated by the examples in Figure 1), but varied in homogeneity. The time to habit formation is determined by when the individual reaches 95% of the asymptote and is marked by the blue line.
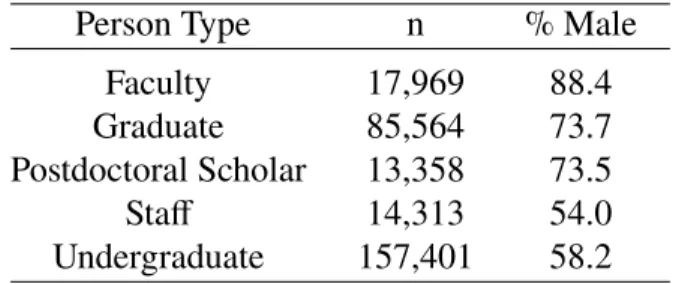
Finally, we take advantage of the size and diversity of the gym-goer sample to investigate whether demographic and SES characteristics are associated with predictability.
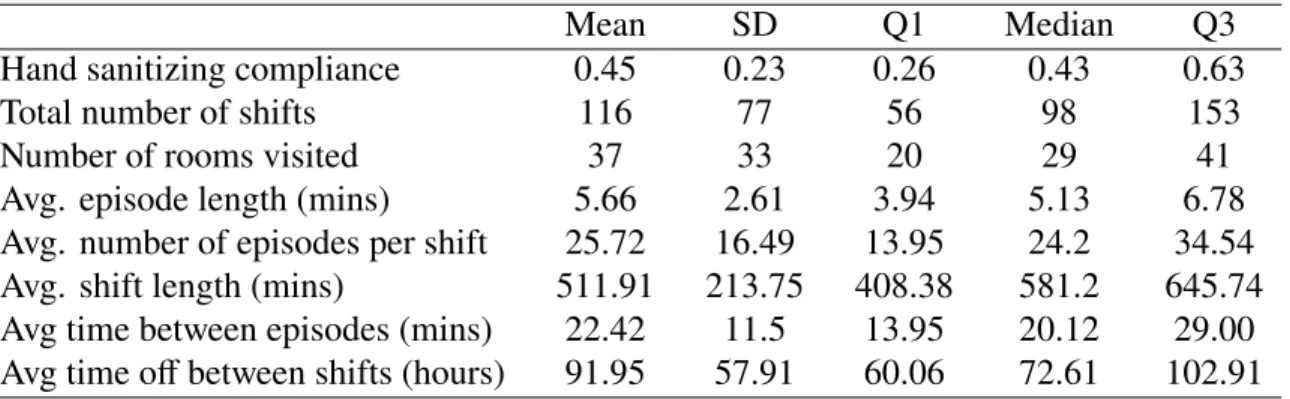
Study 2: Hand Washing among Hospital Workers Human Subjects ProtectionsHuman Subjects Protections
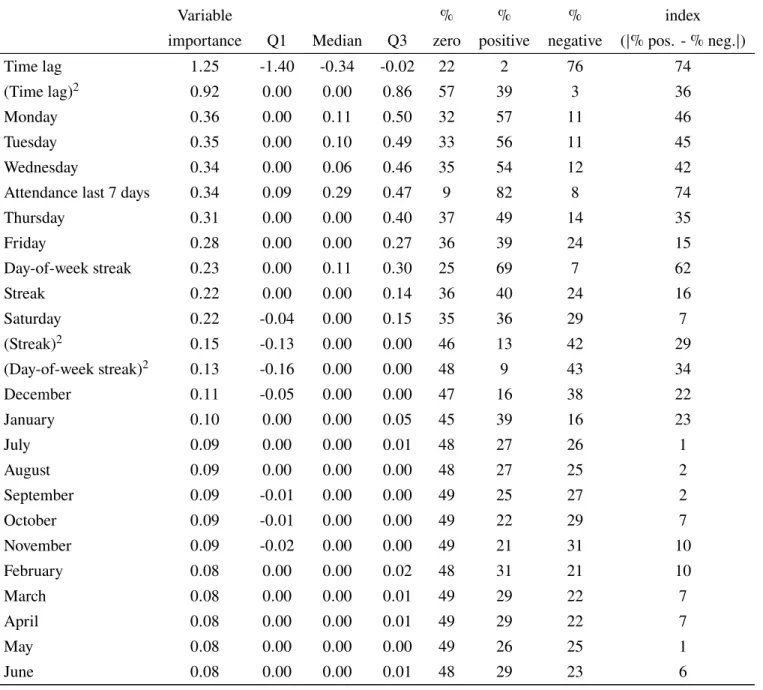
While our LASSO models have slightly less predictive power in this area (compared to gym attendance), they still outperform random chance in predicting the handwashing behavior of hospital caregivers. Furthermore, the PCS is again able to narrow down the set of context variables that are the most important predictors of handwashing at the aggregate level (see Table 3.5). Time intervals of the day were not selected by the LASSO model as predictors of most people's handwashing behavior.
The most heterogeneous predictors are room frequency (the rate at which a specific room is visited by the hospital worker, relative to other rooms) and time off work (ie, rest between shifts), both of which had the same were likely to be positive. or negative predictors of handwashing when they predict at all.
Discussion
For some characteristics – such as the time to learn habits – there is not yet a gold standard. One of the best studies demonstrating insensitivity to reward devaluation in humans is a psychological study. As can be seen from the table, there are no significant differences in the age of the two groups.
This figure shows the empirical cumulative distributions in absolute values of (i) (right side) the interaction terms between pre-habit/post-habit and extreme weather indicators and (ii) (left side) the. This figure shows the empirical cumulative distributions in absolute values of (i) (right side) the interaction terms between pre-habit/post-habit and last episode exit indicators and (ii) (left side) the. Robust habit learning in the absence of awareness and independent of the medial temporal lobe”.

USING A VENDING MACHINE “RETAILER" TO STUDY REPEAT PURCHASES IN CONSUMER BEHAVIOR
Introduction
Research suggests that there may even be vertical differentiation in how companies think about price promotions (Marom and Seidmann, 2011, Bar-Isaac, Caruana and Cuñat, 2012). Many articles in the marketing literature have examined the impact of price promotions on consumer behavior. Other studies have focused on the broader implication that price promotions have on subsequent consumer behavior.
The focus of this paper is to understand what happens to consumer behavior during the price promotion as well as several weeks to one month after it.6 This objective is in line with recent interest in the marketing literature on the long-term impact of price promotions (and other marketing activities). (see Hanseens, 2018 for a compendium).
Literature Review
While we do not measure brand associations in our data, a habit formation model from economics is similar to brand loyalty in the sense that a researcher would look to empirically observe repeat purchases in retail behavior. But if the subjective value suddenly changes, I will experience a large RPE, which will increase my stock of doubt (reducing my "belief" in the reliability of A's reward). The implication for behavior after a price promotion is that the neuro-autopilot model would predict that there are some consumers for whom the stock of suspicion is too high at the time of their first purchase after a price promotion, so that they do not buy repeatedly. second. in the post-sale period.
Benchmarking has been studied in the context of how price increases also affect consumer choice (see Mazumdar, Raj, & Sinha, 2005 for a review).
Experimental Design
The selection of products was informed by ratings from Caltech undergraduates collected using a pretest survey11 administered prior to the start of the experiment. Finally, during weeks 7-10 of the experiment (hereafter the "Post-Sales" period), we tracked consumer behavior after the treatment. The interface of the machine was programmed to be just as it was during the pre-treatment period, with prices and photos identical to the pre-treatment phase.
14A copy of the sales banner used to advertise the price promotion is available in Appendix C.

Theoretical Predictions
The price promotion will increase purchases of discounted items during the Sale period
Although this behavior may be partly due to an income effect (ie, consumers have more money to spend because some products are now cheaper), it has also been shown to be a successful strategy for retailers to increase consumer traffic and overall consumer spend (Hosken and Reiffen, 2004, Chevalier, Anil, & Rossi, 2003).
The price promotion will increase purchases of non-discounted items during the Sale period
The total number of unique customers will increase during the Sale period
- Data
- Results
- Discussion
Hypothesis 4b: Purchases of discounted items will decrease in the post-sale period compared to pre-sale behavior. The number of unique customers is likely to decrease in the post-sale period compared to the pre-sale period. We run this regression including interaction terms for discounted items (“SaleItem” . in our regression) to see if the sale had a disproportionate impact on discounted items relative to non-discounted items.
Marketing a Destination Brand Image to Muslim Tourists: Does Access to Cultural Needs Matter in Developing Brand Loyalty?” In: Journal of Hospitality & Tourism Research.

BIBLIOGRAPHY
In: Psychological Science in the Public Interest 19.3, p. 1949). Income, saving and the theory of consumer behavior. The Post-Promotion Puzzle: What Does the Data Say?” In: Quantitative Marketing and Economics1, p. The appeal of the past: When do habits persist despite conflict with motives?” In: Bulletin of Personality and Social Psychology37.11, p.
Determining Typical Smartphone Use: What Data Do We Need?" In: Cyberpsychology, Behavior, and Social Networks21.6, p.