&
Journal of Government Civil Society
Journal of Government
and Civil Society Volume 8 No. 1 Pages 1 - 160 April 2024 ISSN 2579-4396
&
1 – 20
Assessing the Challenges and Opportunities for Implementing New and Renewable Energy Policy in Indonesia: A Qualitative Study
Asep Nurjaman Nurjaman1, Vina Salviana Darvina Soedarwo2, Djoko Sigit Sayogo3, Rachmad K. Dwi Susilo2
(1 Department of Governmental Science, Universitas Muhammadiyah Malang, Indonesia) (2 Department of Sociology, Universitas Muhammadiyah Malang, Indonesia)
(3 Department of Management, Universitas Muhammadiyah Malang, Indonesia)
21 – 42
Relationship Between E-Government, E-Participation, Human Development, and Its Effect on Democracy in Asia
Jaka Raharja1, Zuly Qodir1
(1 Department of Government Affairs and Administration, Universitas Muhammadiyah Yogyakarta, Indonesia)
43 – 57
How Is E-Government Readiness and Its Impact on Muhammadiyah Citizens? (An Analysis of Ponorogo Internet Program Enters RT) Dian Suluh Kusuma Dewi1, Dwiana Binti Yulianti2, Ekapti Wahjuni Djuwitaningsih3
(1,2,3 Department of Government Studies, Faculty of Social and Political Science, Universitas Muhammadiyah Ponorogo)
58 – 76
Makassar City Climate Change Handling Policy Aswar Annas1, Resky Amalia P1
(1 State Administration Science Study Program, Faculty of Administrative Sciences, Universitas Pepabri Makassar, Indonesia)
77 – 90
The Phenomenon of Ambivalence in Policy Implementation: How Muhammadiyah Universities Protect Women against Sexual Violence Ria Angin1, Fauziah Fauziah2, Kahar Haerah3
(1,3 Government Studies, Faculty of Social and Political Sciences, Universitas Muhammadiyah Jember)
(2 Legal Studies, Faculty of Law, Universitas Muhammadiyah Jember)
Journal of Government
Civil Society
91 – 108 Kisman Karinda1, Tawakkal Baharuddin2, Kittisak Jermsittiparsert3 (1 Department of Government Science, Universitas Muhammadiyah Luwuk, Indonesia) (2 Department of Government Science, Universitas Muhammadiyah Makassar, Indonesia) (3 Faculty of Education, University of City Island, Cyprus)
109 – 134
Investigating E-Government Adoption: The Intention to Use MyASN Application by Indonesian National Civil Service Agency (NCSA)
Silfa Kurnia Aditya1, Husna Alfiani2, Dana Indra Sensuse3, Sofian Lusa4, Prasetyo Adi Wibowo Putro5, Sofianti Indriasari6
(1,2,3,5,6 Faculty of Computer Science, University of Indonesia, Depok, Indonesia) (4 Master’s Degree of Tourism Department, Trisakti Institute of Tourism, Indonesia)
135 – 160
Analysing the Urban Housing Challenge in Harare, Zimbabwe through the Wicked Policy Problems Framework
Leon Poshai1, Alouis Chilunjika2, Kudakwashe Intauno3
(1 Governance and Public Management, Midlands State University, Zimbabwe) (2 School of Public Management, Governance and Public Policy, University of Johannesburg, South Africa)
(3 Department of Development & Governance, University of Duisburg-Essen, Germany)
Investigating E-Government Adoption: The Intention
to Use MyASN Application by Indonesian National Civil Service Agency (NCSA)
Silfa Kurnia Aditya1*, Husna Alfiani2, Dana Indra Sensuse3, Sofian Lusa4, Prasetyo Adi Wibowo Putro5, Sofianti Indriasari6
1,2,3,5,6 Faculty of Computer Science, University of Indonesia, Depok, Indonesia
4 Master’s Degree of Tourism Department, Trisakti Institute of Tourism, Indonesia
* Email Correspondence: [email protected]
ABSTRACT
This study investigates the implementation of e-government initiatives in Indonesia, specifically focusing on the MyASN application designed for civil servants. Despite the introduction of MyASN, challenges persist in terms of user acceptance, and its complete utilization among civil servants throughout Indonesia is yet to be achieved.
The primary goal of this research is to comprehensively identify the factors influencing the adoption of MyASN among civil servants using Unified Theory of Acceptance and Use of The Technology (UTAUT) conceptual model. The target population is respondents who use the MyASN application. The target population is respondents who use the MyASN application. This research obtained a total of 182 respondents who filled out the questionnaire via Google Forms, which were then analyzed using the Structural Equation Model (SEM) approach with SmartPLS software. The findings highlight that behavioral intention, performance expectation, and social influence are factors influencing users’ intention to use the My-ASN application. On the other hand, effort expectancy and facilitating condition don’t affect users’ intention and behavior in adopting MyASN. Furthermore, concerning moderating variables, only working experience and voluntariness of use influence user behavior, although their impacts are not very significant.
Keywords: E-government, user acceptance, UTAUT, developing countries, civil servant ABSTRAK
Penelitian ini mengkaji terkait implementasi e-government di Indonesia, khususnya berfokus pada aplikasi MyASN yang dirancang untuk Aparatur Sipil Negara (ASN). Meskipun aplikasi MyASN ini telah disosialisasikan, namun pada implementasinya masih terdapat tantangan dalam penerimaan penggunanya dan pemanfaatannya yang belum maksimal di kalangan ASN di seluruh Indonesia.
Tujuan utama dari penelitian ini adalah mengidentifikasi faktor apa saja yang mempengaruhi niat pengguna untuk menggunakan aplikasi MyASN menggunakan metode UTAUT (Unified Theory of Acceptance and Use of The Technology). Target populasi adalah responden yang menggunakan aplikasi MyASN. Penelitian ini memperoleh sebanyak 182 responden yang mengisi kuisioner melalui Google Forms, kemudian dilakukan analisis menggunakan pendekatan SEM (Structural Equation Model) dengan perangkat lunak SmartPLS. Temuan penelitian ini menjelaskan bahwa behavioral intention, performance expectation, dan social influence merupakan faktor yang mempengaruhi niat pengguna dalam menggunakan aplikasi My-ASN. Disisi lain, effort expectancy dan facilitating condition tidak mempengaruhi niat dan perilaku pengguna dalam mengadopsi MyASN. Selain itu, pada moderating varible, hanya working experience dan voluntariness of use yang mempengaruhi perilaku pengguna, meskipun dampaknya tidak terlalu signifikan.
Kata Kunci: E-Government, penerimaan pengguna, UTAUT, negara berkembang, aparatur sipil negara
INTRODUCTION
E-government is defined as the application of information and communication technologies, with a specific emphasis on the Internet, to improve the effectiveness of government processes (OECD, 2003; Nookhao & Kiattisin, 2023). The utilization of technology in the context of e-government is crucial as it can improve public governance by making public services more accessible and efficient, managing shared resources effectively, and enhancing administration (Dwivedi et al., 2017; Kaya et al., 2020; Kirat Rai et al., 2020). Additionally, e-government can help build trust by enhancing transparency and reducing corruption in the delivery of public services (Kumar et al., 2023). Due to the numerous benefits derived from the implementation of e-government, many countries, are actively working to implement e-government initiatives (Abdullah et al., 2022; Al Sayegh et al., 2023; Chohan & Hu, 2020).
Indonesia has implemented e-government initiatives to improve the management of civil servants with the implementation of the MyASN application. MyASN, pioneered by The National Civil Service Agency (Indonesian: Badan Kepegawaian Nasional, BKN), can be accessed through web and mobile platforms. The MyASN service is a rebranding of the previous National Civil Service Agency (NCSA) service, namely MySAPK, with the addition of the latest personnel service features. MyASN is a step towards creating a more inclusive service and simplifying the personnel service processes in line with the goals of reforming and mainstreaming electronic-based government systems.
Through the MyASN application, a civil servant can directly submit their personal information to the NCSA database. Furthermore, the primary function of the MyASN application is to provide access to personnel data, including employee profile information, obtain virtual employee cards, receive notifications for promotion and retirement services, as well as information related to health assurance and pension funds. MyASN is in line with Law of The Republic Indonesia No. 20 of 2023 on State Civil Apparatus, specifically in Article 63, paragraph (1), which states that the digitalization of civil service management is carried out to ensure the efficiency, effectiveness, and accuracy of the implementation of processes and decision-making in the civil service management and to create a comprehensive ecosystem for civil service management, thereby supporting nationally integrated civil service management (State Civil Apparatus Regulation 2023/21, 2023).
In accordance with Regulation No. 87 of 2021 from the Head of the National Civil Service Agency (NCSA), every civil servant is obligated to complete personal information, educational and employment history, family details, and supporting documents from the beginning of their tenure (NCSA Regulation 2021/87, 2021). However, based on data from December 2022, there are still 5,753 civil servants with unresolved issues related to data anomalies (Cahyaningsih, 2017). Consequently, many civil servants have not updated their data, resulting in multiple versions and inconsistencies when strategic levels require
information about civil servants. However, the completeness of civil servant data contributes to accurate and accountable records, enhancing the quality and integrity of data to support the realization of the one civil servant data and government policies in civil service management. This data serves as one of the foundations for policy-making and decision-making processes, such as formulating recruitment quotas for civil servants in the upcoming years. Thus, it can be concluded that the MyASN application is not fully accepted and utilized by civil servants throughout Indonesia.
The implementation of e-government is not easy, it is undeniable that its application still faces many obstacles (Puspitasari & Kurniawan, 2021). Several studies have indicated that there are factors influencing barriers in the implementation of e-government, especially in developing countries, such as limited awareness (Sabani, 2020), resistance to change (Kirat Rai et al., 2020; Mustaf et al., 2020) and lack of technical skills (Bojang, 2021). In the context of adopting new technologies, specifically the MyASN application, most civil servants are not aware of the importance of this technology. Civil servants are not fully aware of the benefits or relevance of the e-performance application, thus tending to be less motivated to use it (Alshaher, 2021).
Therefore, this study is needed to understand the factors influencing users to utilize the MyASN application. By understanding user acceptance, it is hoped that the utilization of MyASN among civil servants can be optimized. Without knowing the factors driving user acceptance of an application, the application may be abandoned (Althunibat et al., 2021). Moreover, understanding user acceptance is crucial for ensuring the effective adoption of technology, which impacts how well the technology is utilized and perceived in terms of quality (Kirat Rai et al., 2020). Consequently, there is an expectation for MyASN to be utilized to its fullest potential in the future. This optimal utilization of MyASN can contribute to enhancing the quality and integrity of data to support the implementation of civil servant data and the establishment of accurate personnel management policies.
UTAUT (Unified Theory of Acceptance and Use of Technology) is a theoretical framework used in technology adoption and acceptance (Venkatesh, 2022; Venkatesh et al., 2003). TAUT is also a commonly used model to understand technology usage in the context of government. Previous studies employed the UTAUT to assess the acceptance of applications from citizen and public perspective, primarily focusing on its core variables.
Sabani (2020) has successfully measured the influence of transparency on the implementation of e-government from the public’s perspective. Syamsudin et al. (2018) have investigated the factors influencing citizens behavioral intention to use e-government services to provide a comprehensive analysis and insights into potential improvements for e-government services. Prawati et al. (2022) assessed the use of E-Government SIDJP Nine in tax offices in Indonesia to determine factors affecting interest and behavior in
Considering the restricted scope of research on evaluating e-government services from the perspective of employees, particularly civil servants, and involving factors such as age, gender, experience, and willingness in system usage, this creates opportunities for more extensive and thorough research. This study aims to identify factors that can be improved to optimize the use of the MyASN application by its users using the UTAUT model. The results of this study can be used as a reference for improving the quality of the MyASN application. Consequently, this study formulates the subsequent research questions:
(RQ1) What factors can affect the adoption of the MyASN application so that it can be used more optimally by civil servant?
(RQ2) Do moderating variables affect user behavior when using the MyASN application?
This paper is structured as follows. The next section (section 2) will provide the proposed model, hypotheses, study design, survey distribution method, and demographic distribution of respondents. It also includes an overview of the research planning, data collection, analysis procedures, and demographic data analysis methods. The following section (section 3) deals with result and discussion including the measurement model and the structural model for the proposed model, including its model fit summary and the path coefficients for the hypothesized relationships. Section 4, the concluding section, encapsulates the findings of the study, discusses its limitations, and proposes avenues for future research. Section 5 is dedicated to acknowledgments, expressing gratitude towards individuals, institutions, or organizations that have contributed to the completion of the study.
RESEARCH METHOD
Research Model
The research model utilized the UTAUT, initially introduced by Venkatesh et al. (2003).
The UTAUT model consists of four primary components: Performance Expectancy (PE), Effort Expectancy (EE), Social Influence (SI) and Facilitating Conditions (FC). These components are critical determinants that directly impact usage behavior and user acceptance. Gender, age, experience, and voluntary use serve as moderating variables, influencing the impact of these components (Venkatesh et al., 2003; Shahab et al., 2021).
In this study, UTAUT was chosen as the model to investigate the acceptance of the MyASN application because it has several advantages that make it one of the most widely used models in technology acceptance research. First, UTAUT is a comprehensive model
as it integrates and extends previous models such as the Theory of Reasoned Action (TRA), Theory of Planned Behavior (TPB), Technology Acceptance Model (TAM), and others (Ajzen, 2002; Davis, 1989; Fishbein et al., 1975; Venkatesh et al., 2003). This allows researchers to consider many factors that influence technology acceptance. Second, numerous academics, therefore, regard the UTAUT as the most exhaustive model for forecasting employee behavior within the context of e-government (Sivaji et al., 2019;
Wibowo et al., 2023; Zeebaree et al., 2022).
Hypothesis and Proposed Conceptual Model
Performance Expectancy (PE) is characterized as the extent to which an individual perceives that utilizing the system will contribute to achieving improvements in job performance (Venkatesh et al., 2003; Venkatesh, 2022). Many scholars have successfully verified the correlation between PE and behavioral intention (Rabaa’i, 2017; Talib et al., 2013; Prawati et al., 2022). In accordance with that, the authors propose hypothesis: PE positively influences behavioral intention to use the MyASN application (H1).
Effort Expectancy (EE) is the level of ease in using a system that can reduce the energy and time required to perform tasks (Isaac, 2007; Jacob & Darmawan, 2019). The easier a system is to use, the lower the effort required by the user to accomplish their tasks. In this variable, several authors found that EE has a significant and positive effect on behavioral intention (Nookhao & Kiattisin, 2023; Wibowo et al., 2023). For this aspect, the authors also articulate the hypothesis: EE positively influences the behavioral intention to use the MyASN application (H2).
Social Influence (SI) is characterized by the extent to which an individual perceives that significant others believe he or she should use the new system (Venkatesh et al., 2012; Maulidya Izzati, 2020; Saputra et al., 2021). (Jacob & Darmawan, 2019) propose evidence from their findings point to the connection between SI and behavioral intention while in the research conducted by Prawati et al. (2022), it is stated that social influence has no significant effect on behavioral intention.Top of Form In line with this, the authors propose hypothesis: SI positively influences the behavioral intention to use the MyASN application (H3).
Facilitating Conditions (FC) construct illustrates the extent to which an individual believes that the organizational and technological infrastructure supports the system (Isaac, 2007; Wibowo et al., 2023). Many scholars have successfully verified the correlation between FC and use behavior (Mutaqin & Sutoyo, 2020; Zeebaree et al., 2022). In accordance with that, the authors suggest hypothesis: FC positively influences the use behavior to use the MyASN application (H4).
Understanding Behavioral Intention (BI) is vital for forecasting the adoption of technology since it acts as a proximal factor influencing the actual utilization of the system.
The model suggests that the strength of BI directly impacts the real-world utilization of technology. Several studies have shown that ethical issues and behavioral intentions can influence system use (Venkatesh et al., 2012; Zeebaree et al., 2022). In line with this, the authors propose hypothesis: BI positively influences the use behavior to use the MyASN application (H5).
Discussing moderating variables (gender, age, experience, voluntariness of use), some researchers conduct studies by incorporating moderating variables into the model. In study (Akinnuwesi et al., 2022), it is shown that attitudes towards the use of digital technology to address COVID-19 are not influenced by age, gender, or voluntariness of use. However, in study (Tussardi et al., 2021), the acceptance of CeLOE LMS is influenced by all moderating variables.
Gender has a positive and significant influence on SI, PE, and EE (Venkatesh et al., 2003). The study explains that there is a stronger association between men and performance expectancy. To clarify the influence of gender on SI, PE, and EE behaviors in adopting and using the MyASN application, the researchers propose the following hypothesis: gender positively influences the SI’s decision to use the MyASN application (H6), gender positively influences the PE for using the MyASN application (H7) and gender positively influences the EE’s decision to use the MyASN application (H8).
The relationship between the PE and age becomes more significant or stronger for younger workers. The influence of EE and SI is also influenced by age, especially for older workers (Isaac, 2007). The FC effect on usage is only significant or impactful when examined in conjunction with the moderating effects of age and experience (Isaac, 2007).
To clarify the effect of age on the PE, EE, and SI of behavior in adopting and using the MyASN application, the researchers propose the following hypotheses: age positively influences the PE for using the MyASN application (H9), age positively influences the EE’s decision to use the MyASN application (H10), age positively influences the SI’s decision to use the MyASN application (H11) and age positively influences the FC’s decision to use the MyASN application (H12).
The effect of EE on intention tends to diminish or decrease when an individual has longer work experience or a higher level of experience. In other words, as someone becomes more experienced in their job, the impact of EE on their intention becomes less significant or strong (Isaac, 2007). This can be interpreted as, with increasing work experience, the relationship between EE and intention tends to be less dominant or weakened (Isaac, 2007). The effect of FC on usage is only significant when examined in conjunction with the moderating effects of age and experience. To clarify the effect of experience on the FC, EE, and SI of behavior in adopting and using the MyASN application, the researchers
propose the following hypotheses: experience positively influences the FC for using the MyASN application (H13), experience positively influences the EE for using the MyASN application (H14) and experience positively influences the SI for using the MyASN application (H15).
In his research, Venkatesh stated that the level of voluntariness in using an application or service can be influenced or altered when the usage is mandatory. Therefore, certain obligations or requirements can impact how users use the application voluntarily (Isaac, 2007). To clarify the voluntariness of use in adopting and using the MyASN application, the researchers propose the hypothesis: voluntariness of using the SI positively for using the MyASN application (H16).
A study explains that age significantly influences the behavioral intention to adopt and use technology, while gender has no effect at all. In addition, another study states that age, as a demographic factor, has a positive and significant impact on computer self- efficacy, affecting the intention to use e-government services (Zainal et al., 2019). To clarify the effect of gender, age, experience, and voluntariness of use behavior in adopting and using the MyASN application, the researchers propose the following hypotheses:
gender positively influences the UB’s decision to use the MyASN application (H17), age positively influences the UB’s decision to use the MyASN application (H18), experience positively influences the UB for using the MyASN application (H19) and voluntariness of Use positively influences the UB’s use of the MyASN application (H20). Based on the proposed hypotheses in this study, the author then illustrates the proposed research model shown in Figure 1.
Figure 1. The Proposed Conceptual Model
Study Design
The researchers employed a quantitative approach in data collection, utilizing a questionnaire as the primary instrument. To test the relationships between independent and dependent variables, the authors chose Partial Least Squares (PLS) Structural Equation Modeling (SEM) as the modelling technique (Hair et al., 2019). Previous research indicates that PLS-SEM plays a crucial role for researchers in conducting statistical analysis in similar contexts. In addition to using PLS-SEM, other Excel calculations were also conducted to obtain correlations since demographic information about the respondents, which served as moderator variables in UTAUT, did not utilize a Likert scale.
Instrument
The researchers proceeded to gather data through a cross-sectional questionnaire featuring closed-ended questions. The questionnaire employed in this investigation consists of two segments: information about the respondents and their perspectives on the proposed model. The initial section of the questionnaire encompasses 5 questions that solicit demographic details such as gender, age, work experience, and voluntariness to use. The second part includes 26 questions consisting of 5 indicators designed to assess the proposed model. Each item is rated on a seven-point Likert scale with anchors ranging from strongly disagree to strongly agree used for all non-demographic items. Appendix A contains a compilation of all the questionnaire items in this study adopted from the research conducted by (Alabboodi & Shaban, 2019).
In this study, the authors decided to gather data only from users of the application because they wanted to focus on the experiences, their intentions in using the application leading to its usage, and the challenges faced. Furthermore, in the pilot testing phase of the questionnaire, the researchers selected a number of respondents representing the target population, namely 20 respondents from various central institutions in Indonesia. The purpose of this pilot testing was to ensure the clarity and suitability of the questions, as well as to identify potential issues in the questionnaire. After receiving feedback from this pilot testing, the authors then made revisions and finalized the ultimate version of the questionnaire to be used in the main study.
The authors employed Google Forms to distribute a questionnaire to civil servants.
The method utilized for sampling in this research can be categorized as non-probabilistic sampling. Respondents were chosen based on convenience, accessibility to the researchers, and consideration of diverse geographical locations. Following the distribution from November 6th to November 10th, 2023, a total of 210 individuals completed the questionnaire, with 182 respondents having used MyASN, while the rest had never used the application. Thus, the 182 respondents constitute a valid sample for analysis.
Transparency and confidentiality were prioritized during data collection, assuring participants that their responses would be treated confidentially for academic purposes.
The commitment to privacy aimed to instill confidence in respondents.
Respondents
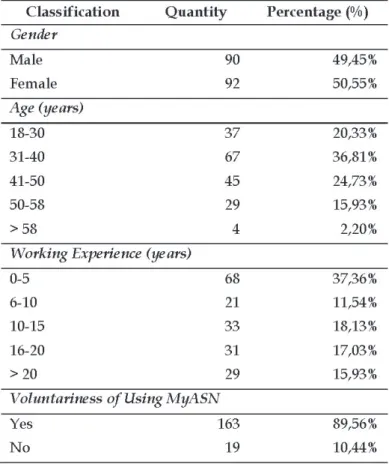
Demographic information, as presented in Table 1, indicates that around 51% of valid respondents are female, nearly 37% fall in the 31-40 age range, 37.36% have 0-5 years of work experience, and 89.56% voluntarily use the MyASN application.
Tabel 1. Demographic Respondents
Within our study, thorough data processing plays a crucial role in extracting valuable insights and forming robust conclusions. We have systematically structured our data processing into three specific phases, each customized to meet the unique demands of the explored hypotheses. These stages involve applying advanced statistical methods, correlation analysis, and thoughtful integration of qualitative data.
For hypotheses 1 to 5, we employ PLS-SEM as our data processing technique. This method allows us to analyze the relationships among variables and test the specified hypotheses within the structural equation modelling framework. Hypotheses 6 to 16 employ the Spearman correlation formula to analyze demographic information. For hypotheses 17 to 20, we will perform a sum of product calculation. This involves multiplying the Likert scale results for all user behavior indicators by the respective outer loading values. This computation allows us to assess and quantify the impact of user behavior indicators on the specified hypotheses.
RESULTS AND DISCUSSION
In the study conducted by (Hair et al., 2019), it is recommended to conduct assessments to evaluate the measurement model, which includes examining reflective indicator loadings, internal consistency, convergent validity, and discriminant validity. The next step is to assess the structural model to measure the significance and relevance of path coefficients, consisting of checking collinearity, path coefficients, and coefficient determination.
Outer Loading
In PLS-SEM, the indicator loadings play a crucial role in assessing the relationship between observable indicators and latent constructs. Aiming for loadings exceeding 0.708 is recommended, indicating that the construct accounts for over 50% of the indicator’s variability, ensuring reliable item measurements. This assessment is pivotal in evaluating the reflective measurement model in PLS-SEM. The suggested threshold for reflective indicator loadings is at least 0.70 (or 0.60 in exploratory research), while a maximum of 0.95 is advised to avoid redundant indicators that could compromise the content validity (Puspitarini & Retnowardhani, 2022).
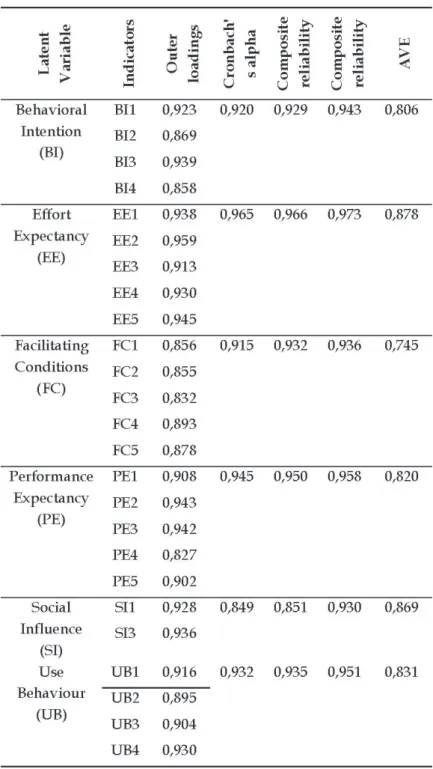
In this study, based on the calculations conducted, there is one latent variable showing an outer loading value below 0.700, labeled as SI2. In response, the researchers initiated an additional test on the reflective indicator loadings by excluding SI2 to assess changes in AVE. The test results indicate that the AVE for the SI variable increased by 0.274.
Consequently, the authors agree on removing SI2 from the proposed model. This decision results in outer loading values exceeding 0.700 for all indicators, as illustrated in Table 2.
Tabel 2. Measurement Model Analysis
Internal Consistency Reliability
The next step in our analysis involves evaluating the Internal Consistency Reliability to determine the extent to which a set of questions in a measurement instrument provides consistent or uniform results using Cronbach’s Alpha. Cronbach’s Alpha yields value
Retnowardhani, 2022). As indicated in Table 2, the results show that the Alpha Reliability and Composite Cronbach meet or exceed the recommended standards, indicating that the questions or items in the instrument mutually support each other and tend to provide more reliable and accurate results.
Convergent Validity
To assess the convergent validity of a construct, the Average Variance Extracted (AVE) is employed. AVE serves as a measure to evaluate the convergent validity in PLS-SEM analysis. Computing the AVE involves squaring the loading of each indicator on a construct and determining the mean value (Puspitarini & Retnowardhani, 2022). An acceptable AVE is 0.50 or higher, indicating that the construct accounts for at least 50% of the variance of its items. As outlined in Table 2, all constructs exhibit AVE values exceeding 0.50.
Discriminant Validity
Discriminant validity refers to how distinct a construct is from other constructs in the structural model, and various metrics, such as the Fornell-Larcker criterion and the Heterotrait-Monotrait (HTMT) ratio of correlations, are used for its assessment (Puspitarini
& Retnowardhani, 2022). The Fornell-Larcker criterion compares the Average Variance Extracted (AVE) of each construct to the squared inter-construct correlation of that same construct and all other reflectively measured constructs in the structural model. According to this criterion, the shared variance among all model constructs should not surpass their respective AVEs. Introduced by Henseler and colleagues in 2005, the HTMT ratio assesses the correlations’ mean value across constructs relative to the (geometric) mean of the average correlations for items measuring the same construct (Kangwansil &
Leelasantitham, 2020). High HTMT values indicate potential issues with discriminant validity. Henseler and colleagues propose a threshold value of 0.90 for structural models with conceptually very similar constructs and a lower, more conservative threshold value of 0.85 for conceptually more distinct constructs (Hair et al., 2019).
Tabel 3. Results for Discriminant Validity Assessment HTMT
According to the statement, Table 3 indicates that the HTMT values for all constructs are below 0.90. This signifies no issues with discriminant validity, as low HTMT values suggest that the constructs are empirically distinct from each other in the structural model.
The results suggest that the shared variance among the constructs is within an acceptable range, indicating clear differentiation between the conceptual boundaries of the constructs in the analysis.
Collinearity
Collinearity refers to the strong correlation between predictor variables in a regression model, which may result in biased and unstable estimates of the regression coefficients.
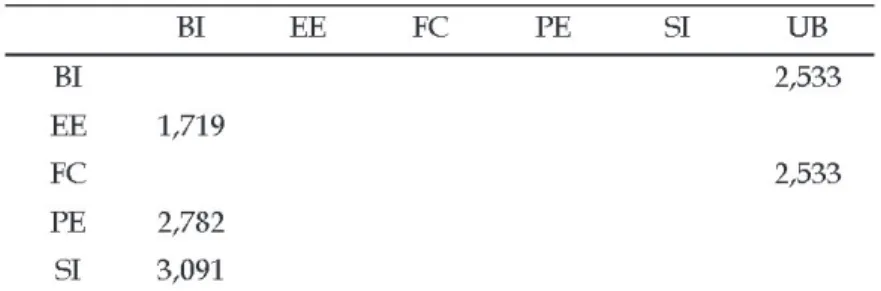
The Variance Inflation Factor (VIF) serves as a measure for assessing collinearity in PLS- SEM analysis (Puspitarini & Retnowardhani, 2022). VIF values exceeding 5 suggest potential issues with collinearity among the predictor constructs, though problems can also arise at lower VIF values within the range of 3-5. Ideally, VIF values should be close to 3 or lower. If collinearity is a concern, a common approach is to develop higher-order models supported by theory. The calculation of VIF involves using the latent variable scores of the predictor constructs in a partial regression. Therefore, the model utilized in this study is not troubled by the presence of collinearity. Table 4 shows the VIF values for each construct; these are considered desirable, indicating a lower likelihood of collinearity concerns among predictor constructs.
Tabel 4. Variance Inflation Factor
Path Coefficient
The Path coefficient is a standardized regression coefficient that represents the strength and direction of the relationship between two constructs in the PLS-SEM model. The interpretation of the path coefficient aligns with the weights of formative indicators. The closer it is to the value of 1, the stronger the influence. A p-value < 0.05 with a t-statistic
> 1.96 indicates a significant relationship (Kangwansil and Leelasantitham, 2020; Sivaji
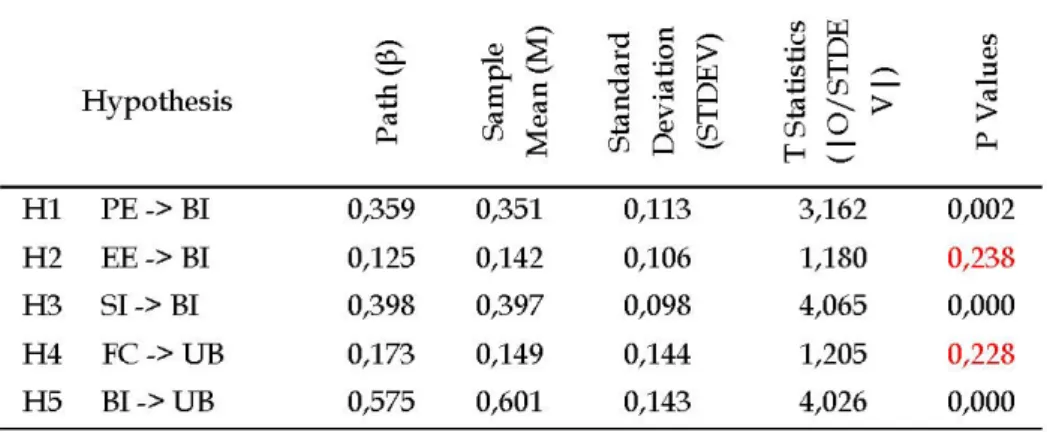
Tabel 5. The estimated results of the proposed hypotheses
Table 5 presents the results of hypothesis testing using the bootstrapping algorithm.
Based on the hypothesis test, hypotheses H2 and H3 are not supported in this study, as the p-values for H2 and H4 are 0.238, which is > 0.05, with t-statistics < 1.96. Meanwhile, the accepted hypotheses are H1 and H4-H5 because they have p-values < 0.05 and t- statistics > 1.96.
Coefficient Determination (R2)
The coefficient of determination (R2) measures the variance explained by the endogenous constructs in a PLS-SEM model (Puspitarini and Retnowardhani, 2022). The R2 ranges from 0 to 1, with higher values indicating a greater explanatory power.
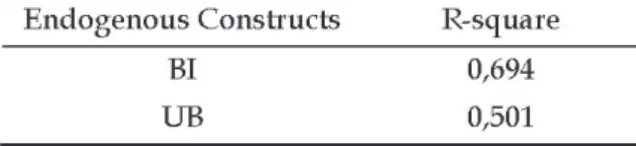
Tabel 6. Coefficient of Determination
Table 6 explains that all endogenous model variables have R2 values above 0.5, indicating that the R2 values in this study are sufficiently robust to explain the model.
The R2 value also elucidates the percentage of independent variables influencing the dependent variable. In the proposed model, the BI variable is directly influenced by the PE, EE, and SI variables with an R2 value of 0.694, meaning that these three variables collectively have a direct impact of 69.4% on the BI variable, while the remaining 30.6%
represents unidentified variables in the model. Similarly, the UB variable is directly influenced by the BI and FC variables, with an R2 value of 0.501. This indicates that 50.1% of these two variables affect the BI variable, while the remaining 49.9% consist of
variables outside the model. Based on the results presented above, it is demonstrated that the proposed and acceptable moderator variables are (H1), (H3), and (H5). The estimation results for the proposed hypotheses can be seen in Table 5.
The first hypothesis test (H1) (â=0.359, t=3.162, p-value=0.002) indicates that PE significantly influences system usage. This finding is consistent with previous research findings stating that PE has a significant positive impact on BI (Shahab et al., 2021; Sivaji et al., 2019). In Sivaji’s study, it is explained that respondents agree that the e-government application, in this case G2E (government to employee), allows users to access government- provided information and services more quickly when needed. The findings of previous research align with this study, indicating that civil servants perceive MyASN as a valuable and impactful application to enhance employee performance. Through the MyASN application, it facilitates civil servants across all agencies to quickly access personnel data.
On the other hand, the subsequent hypotheses, (H2) (â=0.125, t=1.180, p-value=0.238) and H4 (â=0.173, t=1.205, p-value=0.228), suggest that EE and FC do not affect users’
intention and behavior in adopting MyASN. Previous research revealed that EE has an insignificant impact on technology adoption behavior because employees may already have sufficient readiness in using information technology in their daily work (Alkhwaldi et al., 2023). (Alkhwaldi et al., 2023; Venkatesh & Zhang, 2010) stated that EE will be a significant factor in technology adoption if users are not familiar with the technology.
Other studies have revealed that FC does not significantly influence users’ intention to use an application. This may be because users pay more attention to the usability, functionality, interface, and quality of the system that make them interested in using it (Juliarti et al., 2021). In this study, another strong reason is the existence of regulations mandating the use of MyASN, thus FC and EE do not significantly influence the adoption of the application. Therefore, despite the obstacles in facilitating conditions and users’
expectations regarding the ease of use, every user is still required to use MyASN according to the applicable regulations.
The third hypothesis (H3) (â=0.398, t=4.065, p-value=0.000) and the fifth hypothesis (H5) (â=0.575, t=4.026, p-value=0.000) positively impact the usage behavior related to MyASN. Greater social influence (SI) correlates with higher behavioral intention and more positive behavior toward the application (Mutaqin and Sutoyo, 2020; Sivaji et al., 2019). Furthermore, in research conducted by (Nguyen, 2023; Sudirman et al., 2019), it is stated that social influence does indeed have a significant impact on shaping individuals’
perceptions and behaviors, especially when social norms or peer pressure are deemed important by those individuals. In many cases, individuals tend to pay attention to the views and behaviors of their peers as guidance for making decisions or acting in certain situations.
Correlation Between Moderators and Construct
Considering moderators is essential to understand variations in relationships under specific conditions or among certain groups (Isaac, 2007). In this study, we conducted a comprehensive analysis related to the relationships between gender, age, experience, and voluntariness of use with the variables PE, EE, SI, and FC. This analysis was carried out using Spearman’s correlation formula to determine the level of association or test the significance of associative hypotheses when the data for each connected variable are ordinal in nature. Spearman’s correlation is frequently regarded as suitable for assessing the correlation between variables when one or both of the variables are measured on an ordinal scale, such as the Likert scale. This is especially applicable when examining demographic variables like age and gender (Yuliani & Widajati, 2021).
The Spearman’s rank correlation coefficient is also the same, ranging between -1 <
rho < 1. If the value of rho = 0, there is no correlation or relationship between the independent and dependent variables. If the rho value = +1, it indicates a positive relationship between the independent and dependent variables. Conversely, if the rho value = -1, it means a negative relationship between the independent and dependent variables. In other words, the “+” and “-” signs indicate the direction of the relationship between the variables being operated on. Table 9 explains the meaning of the rho values, and Table 10 displays the results of the Correlation Between Moderators and Construct.
Tabel 7. The Spearman’s Rank Correlation
Tabel 8. Correlation Between Moderators and Construct
Based on the results presented in Table 8, it is evident that the highest correlation value is associated with Hypothesis 6, where the correlation value is 0.275. This suggests that voluntariness of use has the most significant influence, albeit weak yet positive, on social influence. This suggests that voluntariness may variably impact social influence, dependent on specific contextual factors and other elements involved (Yuliani and Widajati, 2021).
Leveling the Moderators Variables
Hypothesis analysis for the moderator variables (H17) - (H20) uses the Sum of Product (SoP) method using Microsoft Excel. This involves multiplying Likert scale values with outer loadings obtained from PLS-SEM analysis. The resulting sum-product values provide insights into the relationship between the Likert scale and each variable’s contribution to the measured construct. This approach allows for a personalized examination of how each respondent’s demographic characteristics contribute to or influence the overall outcomes measured in the study. By scrutinizing individual responses, researchers can identify trends, patterns, or variations in the influence of demographic factors on the studied constructs, offering valuable insights into the diverse perspectives within the dataset.
Figure 2. Histogram for Use Behavior
Figure 2 illustrates the distribution of data through a histogram graph, showcasing the frequency of respondents within different SoP value ranges. On the leftmost side, at the first level, there are 5 respondents with sum of product results ranging from 14,58 to 27,58. Moving to the second level, 11 respondents have sum of product results falling between 27,58 and 40,58. In the third section, the following 9 respondents have sum of product results within the range of 40,58 to 53,58. Subsequently, there is a significant increase in frequency in the subsequent sections: 34 respondents, 39 respondents, 40 respondents, and the highest being 44 respondents at the rightmost level. The orderly progression of sum of product results is as follows: 53,58-66,58; 66,58-79.58; 79,58-92,58;
92,58-105,58. Referring to the ultimate construct targeted, which is the UB, this study specifically concentrates on data levels 5, 6, and 7, which inherently tend to exhibit high use behavior. The extraction of data for levels 5, 6, and 7 simultaneously addresses hypotheses (H17) to (H20), as illustrated in Table 9.
Tabel 9. Use Behavior Based on Leveling
The seventeenth hypothesis test (H17) in Table 9 shows that age does not have a positive influence on use behavior. This result corresponds with a research study that proposes no moderating influence of age on relationships among determinants in the UTAUT, as mentioned in reference (Isa and Wong, 2015). The use of MyASN is applicable to anyone without considering age differences. This might be attributed to MyASN being one of the obligations for civil servants to complete documentation, rendering age not positively influencing use behavior.
Likewise with the eighteenth hypothesis test (H18), it was established that gender does not exert a significant impact on use behavior (Mutaqin and Sutoyo, 2020).This study is consistent with the data presented in Table 9, which indicates a relatively balanced distribution of users based on gender, namely, 69 female users and 54 male users. This indicates that there is no difference in behavior between male and female users when
The nineteenth hypothesis test (H19) in Table 9 shows that the working experience variable in the range of 0-5 years shows the highest values for user behavior. This enthusiasm can be attributed to the relatively low volume of uploaded documents in MyASN, leading to quicker completion of filing processes. It can be concluded that working experience significantly influences user behavior. In the voluntariness of use construct, it is evident that individuals with a willingness to use MyASN tend to exhibit better use behavior as indicated by the high level. This finding is in line with literature studies that have found perceived voluntariness to be a significant predictor of the behavioral intention to use technology (Isaac, 2007).
Furthermore, for the twentieth hypotesis test (H20), Venkatesh noted that perceived voluntariness may be an important factor to consider in the context of mandatory technology use, as users who feel forced to use technology may be less motivated to use it effectively (Isaac, 2007). This is also in line with the MyASN case study, which mandates civil servants to complete employee documentation.
CONCLUSION
In conclusion, this study employs the UTAUT model to comprehensively examine the intricate factors influencing MyASN utilization among Civil Servants (ASN). Key determinants, including Behavioral Intention (BI), Performance Expectation (PE), and Social Influence (SI), play crucial roles in shaping users’ engagement with the MyASN application. BI emerges as a significant factor, underscoring its critical role in users’
decisions to adopt MyASN, while PE is recognized for its substantial influence, with users acknowledging MyASN’s value for performance enhancement. Social Influence is identified as a positive force impacting users’ behavior, highlighting the importance of interpersonal factors in shaping attitudes toward MyASN.
The inclusion of moderator variables, particularly working experience and voluntariness of use, enriches the understanding of user behavior. Despite minimal moderating effects from age and gender, the research emphasizes the influential roles of working experience and voluntariness of use, indicating that users with less experience and a voluntary inclination exhibit more favorable behavior when interacting with MyASN.
In summary, the comprehensive analysis of this study provides actionable insights for stakeholders and policymakers, emphasizing the importance of considering contextual factors, organizational requirements, and individual motivations to optimize strategies for enhancing user acceptance and behavior in the implementation and improvement of applications like MyASN. To increase the adoption and usage of the MyASN application among Civil Servants, policymakers can strengthen social influence by mobilizing support from active MyASN users to share their positive experiences with colleagues and management. Campaigns, discussion forums, and regular workplace meetings can be
utilized to reinforce positive attitudes towards MyASN usage. Additionally, it is important to enhance performance expectancy by providing clear information about the benefits of the MyASN application and conducting regular training to improve users’ skills in using it. Thus, policymakers can create a supportive environment that encourages effective adoption and usage of MyASN across government agencies.
However, there are limitations to this study. Firstly, the sample size is restricted to Civil Servants (ASN), limiting the generalizability of the findings to a broader population.
This constraint hinders the representation of diversity within the larger society. Therefore, the research results should be interpreted with caution, and further studies with a more diverse sample group are recommended to obtain a more holistic understanding. Secondly, limitations in data collection methods or measurement tools used can affect the validity and reliability of the findings. Thirdly, focusing on the use of MyASN among civil servants may not fully encompass the perspectives or needs of other users outside that environment, such as users in the private sector or the general public. Therefore, the results of this study may not be fully applicable to different contexts beyond civil servants. Fourth, limitations in the use of variables may not fully reflect the factors influencing the adoption of applications comprehensively.
For future research, considering the regulation requiring every Civil Servant (ASN) and Non-Civil Service High-ranking Official (PPT Non-ASN) to update their data independently, it is recommended to expand the sample size. To enhance the data collection method, implementing an assisted interview method is suggested, as it can assist respondents in better understanding the questions and contribute to a more comprehensive exploration of user perspectives on MyASN utilization. Furthermore, the author encourages future research to broaden the scope of variables studied using the same model to gain a deeper understanding of the model’s performance in diverse situations such as trust and self-efficacy.
This study contributes significantly in its field by comprehensively exploring the factors influencing the utilization of MyASN among Civil Servants (ASN) within the context of e-government, using the UTAUT model. The research also introduces moderator variables, such as age, gender, work experience, and voluntariness of use, which are typically underutilized by other researchers, to enrich the understanding of user behavior. Thus, the UTAUT model can be effectively applied to comprehend technology adoption in government settings.
ACKNOWLEDGEMENT
SKA would like to express sincere appreciation to the Ministry of Communication
the support they received throughout their academic endeavors at the University of Indonesia.
REFERENCES
Abdullah, P. P., Rahmawati, R., Sensuse, D. I., Lusa, S., Arief, A., & Adi, P. (2022).
Evaluasi Kualitas Layanan E-Government Pada Aplikasi Pendaftaran Seleksi Calon Aparatur Sipil Negara Menggunakan Model E-GovQual Berdasarkan Perspektif Pengguna. Jurnal Teknologi Informasi Dan Ilmu Komputer, 9(6), 1297. https://doi.org/
10.25126/jtiik.2022956130
Ajzen, I. (2002). Perceived behavioral control, self-efficacy, locus of control, and the theory of planned behavior. Journal of Applied Social Psychology, 32(4), 665–683. https://
doi.org/10.1111/j.1559-1816.2002.tb00236.x
Akinnuwesi, B. A., Uzoka, F. M. E., Fashoto, S. G., Mbunge, E., Odumabo, A., Amusa, O.
O., Okpeku, M., & Owolabi, O. (2022). A modified UTAUT model for the acceptance and use of digital technology for tackling COVID-19. Sustainable Operations and Computers, 3(December 2021), 118–135. https://doi.org/10.1016/j.susoc.2021.12.001 Al Sayegh, A. J., Ahmad, S. Z., AlFaqeeh, K. M., & Singh, S. K. (2023). Factors affecting e-government adoption in the UAE public sector organisations: the knowledge management perspective. Journal of Knowledge Management, 27(3), 717–737. https://
doi.org/10.1108/JKM-09-2021-0681
Alabboodi, A., & Shaban, N. (2019). The Adoption of E-government Services in the Iraqi Higher Education Context/ : An application of the UTAUT Model in the University of Kufa. Internat Ional Journal of Appl Ied Research.
Alkhwaldi, A. F., Alobidyeen, B., Abdulmuhsin, A. A., & Al-Okaily, M. (2023).
Investigating the antecedents of HRIS adoption in public sector organizations:
integration of UTAUT and TTF. International Journal of Organizational Analysis, 31(7), 3251–3274. https://doi.org/10.1108/IJOA-04-2022-3228
Alshaher, A. (2021). IT capabilities as a fundamental of electronic government system success in developing countries from users perspectives. Transforming Government:
People, Process and Policy, 15(1), 129–149. https://doi.org/10.1108/TG-05-2020-0080 Althunibat, A., Almaiah, M. A., & Altarawneh, F. (2021). Examining the factors influencing the mobile learning applications usage in higher education during the covid-19 pandemic. Electronics (Switzerland), 10(21). https://doi.org/10.3390/
electronics10212676
Bojang, M. B. S. (2021). Critical Factors Influencing e-Government Adoption in The Gambia.
Society & Sustainability, 3(1), 2021. https://doi.org/10.4018/jitr.2016100103
Chohan, S. R., & Hu, G. (2020). Success Factors Influencing Citizens’ Adoption of IoT Service Orchestration for Public Value Creation in Smart Government. IEEE Access, 8, 208427–208448. https://doi.org/10.1109/ACCESS.2020.3036054
Davis, F. D. (1989). Perceived usefulness, perceived ease of use, and user acceptance of information technology. MIS Quarterly: Management Information Systems, 13(3), 319–
339. https://doi.org/10.2307/249008
Dwivedi, Y. K., Rana, N. P., Janssen, M., Lal, B., Williams, M. D., & Clement, M. (2017).
An empirical validation of a unified model of electronic government adoption (UMEGA). Government Information Quarterly, 34(2), 211–230. https://doi.org/10.1016/
j.giq.2017.03.001
Fishbein, M., Ajzen, I., & Hill, R. J. (1975). Belief, Attitude, Intention and Behavior: An Introduction to Theory and Research. Contemporary Sociology, 6(2), 244. https://
doi.org/10.2307/2065853
Hair, J. F., Risher, J. J., Sarstedt, M., & Ringle, C. M. (2019). When to use and how to report the results of PLS-SEM. European Business Review, 31(1), 2–24. https://doi.org/
10.1108/EBR-11-2018-0203
Isa, S. M., & Wong, K. (2015). Age Differences in Behavioral Intention To Use Internet Marketing/ : a Comparative Study. International Journal of Business and Society, 16(3), 386–396.
Isaac, W. C. (2007). Performance measurement for the e-Government initiatives: A comparative study - ProQuest. 604, 203. http://e-resources.perpusnas.go.id:2057/docview/
304716435/abstract?accountid=25704
Jacob, D. W., & Darmawan, I. (2019). Extending the UTAUT Model to Understand the Citizens’ Acceptance and Use of Electronic Government in Developing Country: A Structural Equation Modeling Approach. 2(IcoIESE 2018), 92–96. https://doi.org/10.2991/icoiese- 18.2019.17
Juliarti, H., Nugraha, C. D., Sensuse, D. I., Kautsarina, & Suryono, R. R. (2021). Internal Social Media Acceptance in Government Organizations. 2021 International Conference on Computer Science, Information Technology, and Electrical Engineering, ICOMITEE 2021, 133–140. https://doi.org/10.1109/ICOMITEE53461.2021.9650224
Kangwansil, K., & Leelasantitham, A. (2020). Factors Affecting the Acceptance of Technology Adoption Model in Digital Painting on Tablet of Media Arts Students.
2020 59th Annual Conference of the Society of Instrument and Control Engineers of Japan, SICE 2020, 614–619. https://doi.org/10.23919/sice48898.2020.9240418
Kaya, T., Saðsan, M., Medeni, T., Medeni, T., & Yýldýz, M. (2020). Qualitative analysis to determine decision-makers’ attitudes towards e-government services in a De-Facto state. Journal of Information, Communication and Ethics in Society, 18(4), 609–629. https:/
/doi.org/10.1108/JICES-05-2019-0052
Kirat Rai, S., Ramamritham, K., & Jana, A. (2020). Identifying factors affecting the acceptance of government to government system in developing nations – empirical evidence from Nepal. Transforming Government: People, Process and Policy, 14(2), 283–
303. https://doi.org/10.1108/TG-05-2019-0035
Kumar, R., Sachan, A., & Mukherjee, A. (2023). Adoption of e-government services at different maturity levels: a qualitative study in India. Digital Policy, Regulation and Governance , 25(1), 15–39. https://doi.org/10.1108/DPRG-09-2021-0116
Maulidya Izzati, B. (2020). Analysis of Customer Behaviour in Mobile Food Ordering Application Using UTAUT Model (Case Study: GoFood Application). International Journal of Innovation in Enterprise System, 4(1), 23–34. https://
ijies.sie.telkomuniversity.ac.id/index.php/IJIES/index
Mustaf, A., Ibrahim, O., & Mohammed, F. (2020). E-government adoption: a systematic review in the context of developing nations. International Journal of Innovation, 8(1), 59–76. https://doi.org/10.5585/iji.v8i1.16479
Mutaqin, K. A., & Sutoyo, E. (2020). Analysis of Citizens Acceptance for e-Government Services in Bandung, Indonesia: The Use of the Unified Theory of Acceptance and Use of Technology (UTAUT) Model. Bulletin of Computer Science and Electrical Engineering, 1(1), 19–25. https://doi.org/10.25008/bcsee.v1i1.3
Neagara, B. K. (2021). Keputusan Kepala BKN No: 87 Tahun 2021. 10, 6.
Nguyen, P. (2023). Local Government Employees ’ Technology Acceptance of E-Participation/
: An Empirical Analysis Using Structural Equation Modeling. https://doi.org/10.1177/
00953997231198847
Nookhao, S., & Kiattisin, S. (2023). Achieving a successful e-government: Determinants of behavioral intention from Thai citizens’ perspective. Heliyon, 9(8), e18944. https://
doi.org/10.1016/j.heliyon.2023.e18944
OECD. (2003). The Case of E-Government: The E-Government Imperative. In OECD Journal on Budgeting (Vol. 3).
Prawati, L. D., Setyawan, M. H., Sari, A. L., & Karina, M. (2022). Implementation of Unified Theory of Acceptance and Use of Technology (UTAUT) Model for Evaluating the Use of E- Government SIDJP NINE in Indonesia. 2022 4th International Conference on Cybernetics and Intelligent System, ICORIS 2022, 1–5. https://doi.org/10.1109/
ICORIS56080.2022.10031598
Puspitarini, A., & Retnowardhani, A. (2022). Extended Delone & Mclean Iss Model To Evaluate It Assistance Application Usage Level. Journal of Theoretical and Applied Information Technology, 100(19), 5435–5444.
Puspitasari, D. T., & Kurniawan, T. (2021). Mitigasi Kegagalan Guna Mewujudkan Keberlanjutan E-Government. 4(1).
Rabaa’i, A. A. (2017). The use of UTAUT to investigate the adoption of E-government in Jordan: A cultural perspective. International Journal of Business Information Systems, 24(3), 285–305. https://doi.org/10.1504/IJBIS.2017.10002806
Rakhmawanto, A. (2017). Civil Apparatus. Civil Apparatus Policy Brief, 10, 12–15.
Sabani, A. (2020). Investigating the influence of transparency on the adoption of e- Government in Indonesia. Journal of Science and Technology Policy Management, 12(2), 236–255. https://doi.org/10.1108/JSTPM-03-2020-0046
Saputra, M., Maulidya Izzati, B., & Rahmadiani, J. (2021). The Acceptance of Government Resource Planning System Using Unified Theory of Acceptance and Use of Technology 2. Journal of Information System), 17(1), 1–19.
Shahab, S., Bagheri, B., & Potts, R. (2021). Barriers to employing e-participation in the Iranian planning system. Cities, 116(January), 103281. https://doi.org/10.1016/
j.cities.2021.103281
Sivaji, A., Soo, S. T., Rasidi, S. H., Hashim, S. H., Kuppusamy, A. D. N., Abidin, F. Z., Chuan, N. K., Musa, A., Sazali, N., & Deniel, A. (2019). Unified Theory of Acceptance and Use of Technology of E-Government Services in Malaysia: Validation of Survey Instrument. 2019 IEEE Conference on Open System, ICOS 2019, December, 6–11. https:/
/doi.org/10.1109/ICOS47562.2019.8975688
Sudirman, I., Aisha, A. N., Monang, J., & Prasetyo, I. R. (2019). Civil servant’s e- government adoption levels: Are age and context matters? International Conference on Electrical Engineering, Computer Science and Informatics (EECSI), 235–240. https://
doi.org/10.23919/EECSI48112.2019.8976952
Syamsudin, Meiyanti, R., Satria, D., Wahyuni, R., & Sensuse, D. I. (2018). Exploring factors influence behavioral intention to use E-government services using unified theory of acceptance and use of technology 2 (UTAUT2). 2018 International Seminar on Research of Information Technology and Intelligent Systems, ISRITI 2018, 2, 237–242. https://
doi.org/10.1109/ISRITI.2018.8864474
Tussardi, R. R., Izzati, B. M., & Saputra, M. (2021). Analysis of E-Learning Acceptance During Distance Learning Using Unified Theory Of Acceptance and Use of Technology
Venkatesh, V. (2022). Adoption and use of AI tools: a research agenda grounded in UTAUT. Annals of Operations Research, 308(1–2), 641–652. https://doi.org/10.1007/
s10479-020-03918-9
Venkatesh, V., Morris, M. G., Davis, G. B., & Davis, F. D. (2003). User acceptance of information technology: Toward a unified view. MIS Quarterly: Management Information Systems, 27(3), 425–478. https://doi.org/10.2307/30036540
Venkatesh, V., Thong, J. Y. L., & Xu, X. (2012). Venkatesh_Thong_Xu_MISQ_forthcoming (GENDER AGE EXPERIENCE). MIS Quarterly, 36(1), 157–178.
Venkatesh, V., & Zhang, X. (2010). Unified theory of acceptance and use of technology:
U.S. vs. China. Journal of Global Information Technology Management, 13(1), 5–27. https:/
/doi.org/10.1080/1097198X.2010.10856507
Wibowo, W. S., Fadhil, A., Sensuse, D. I., Lusa, S., Putro, P. A. W., & Yulfitri, A. (2023).
Pinpointing Factors in the Success of Integrated Information System Toward Open Government Data Initiative: A Perspective from Employees. International Journal of Advanced Computer Science and Applications, 14(1), 94–109. https://doi.org/10.14569/
IJACSA.2023.0140111
Yuliani, S. D., & Widajati, N. (2021). Correlation of Individual Factors and Subjective Workload with Work Stress on Spinning Workers. The Indonesian Journal Of Occupational Safety and Health, 10(1), 117. https://doi.org/10.20473/ijosh.v10i1.2021.117-127 Zainal, N., Hussin, H., Rahim, N., Nazri, M., & Suhaimi, M. A. (2019). Open Government
Data Use by Malaysian Researchers. Some empirical evidence. https://doi.org/10.1109/
ICRIIS48246.2019.9073640
Zeebaree, M., Agoyi, M., & Aqel, M. (2022). Sustainable Adoption of E-Government from the UTAUT Perspective. Sustainability (Switzerland), 14(9). https://doi.org/10.3390/
su14095370