Disclaimer: The World Economic Outlook (WEO) is a survey by IMF staff that is published twice a year, in spring and autumn. A number of assumptions have been adopted for the projections presented in the World Economic Outlook (WEO).
Corrections and Revisions
Print and Digital Editions
Copyright and Reuse
This version of the World Economic Outlook (WEO) is available in its entirety from the IMF e-library (www.elibrary.imf.org) and the IMF website (www.imf.org). The data appearing in the WEO are collected by IMF staff during the implementation of the WEO.
Resilient Global Economy Is Limping Along, with Growing Divergences
While some of the extreme risks - such as severe banking volatility - have moderated since April, the balance remains tilted to the downside. Some reflect the long-term consequences of the pandemic, the war in Ukraine and increasing geo-economic fragmentation.
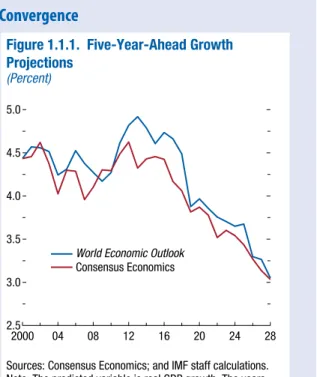
Growing Global Divergences
GLOBAL PROSPECTS AND POLICIES
Growth slowed from 8.9 percent in the first quarter of 2023 (seasonally adjusted quarterly annualized figures) to 4.0 percent in the second quarter. Among major economies, it ranged from 0.3 percent in China (quarterly annualized) to 4.6 percent in the eurozone and 4.7 percent in the United States in the second quarter of 2023.
Outlook: Stable but Slow
Growth in the United Kingdom is expected to decline from 4.1 percent in 2022 to 0.5 percent in 2023, with an upward revision of 0.1 percentage point. In Latin America and the Caribbean, growth is expected to decline from 4.1 percent in 2022.
Risks to the Outlook: Tilted to the Downside but More Balanced
In the most fiscally vulnerable provinces, the financial tension in the real estate sector could spread to the rest of the financial sector through the link between state-owned banks and companies. 4As reported in Box 1.3 of the October 2022 WEO, a 30 percent increase in oil prices from baseline could reduce the level of global GDP by about 0.5 percent and global inflation by about 1.2 percentage points increase compared to the base scenario.
Policy Priorities: From Disinflation to Sustained Growth
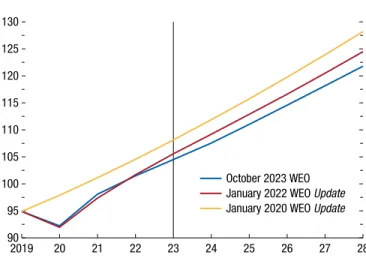
An examination of the bias in WEO forecast errors over time—the average difference between actual outcomes and forecasts—suggests that the answer is no. The inflation responses initially differ across country groups—the disinflation is initially subdued in emerging market economies, whose currencies depreciate, and is more pronounced in advanced economies, whose currencies appreciate—.
Commodity Market Developments
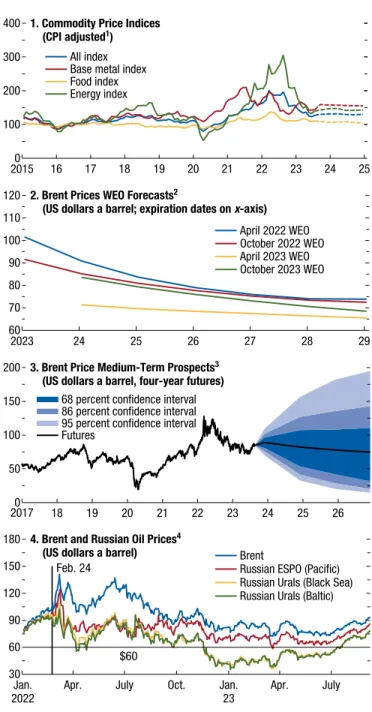
The widespread decline was led by base metals, with prices down 15.7 percent, and European natural gas prices down 36.0 percent.
Commodity Special Feature: Market Developments and the Commodity Price Channel of Monetary Policy
After a brief recovery over the winter, base metal prices fell 15.7 percent from February to August as China's reopening lost steam and its real estate sector, which along with construction accounts for about 20 percent of global metal consumption, continued to falter . (Figure 1.SF.1, panel 1). As a result of a strong supply response in the 2022–23 season, grain prices fell consistently, standing 20.7 percent lower in August than in February.
Forecasts for base metal prices have also been revised down since the April 2023 World Economic Outlook, with prices now expected to fall by 4.7 percent in 2023 and 7.1 percent in 2024. How quantitatively important is the commodity price channel of monetary policy – especially the US monetary policy policy - to drive inflation in the US and worldwide.
A Conceptual Framework
Empirical analysis of this question has been limited.1 This particular feature contributes to filling the gap by assessing the effects of US monetary policy shocks on commodity prices and, through this channel, their spillovers into the US economy and spillovers to consumer prices in other countries. It also examines the transition from commodity prices to consumer prices and potential asymmetries.
The Effects of Monetary Policy Shocks on Commodity Prices: A High-Frequency Approach
The Effects of Monetary Policy Shocks on Commodity Prices, Spillbacks, and Spillovers
The Spillbacks
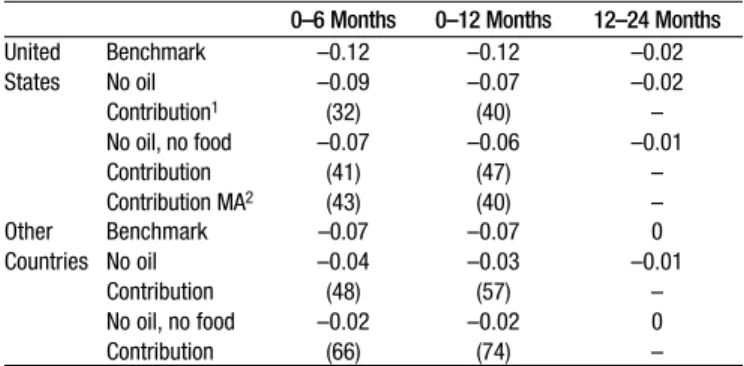
To isolate the commodity price channel of US monetary policy, in the spirit of Bernanke, Gertler, and Watson (1997), the impulse response functions are estimated again with the condition that US monetary policy has no effect on (1) oil prices and (2) both oil and food prices. If the commodity price channel is shut down, US monetary policy has smaller effects on the CPI.
The Spillovers
As table 1.SF.1 shows, absent oil and food price reactions, headline CPI would have fallen by 0.07 percentage point in the first half of the year rather than by 0.12 percentage point, implying a contribution of 41 percent from the commodity price channel. An instrumental variable-local projection mediation analysis tends to confirm these results, with an average commodity price contribution of 43 percent over a half-year period (see Table 1.SF.1 and Online Appendix 1.1).
Asymmetric Pass-Through
The contribution is the same for the first year, but it declines over time as core inflation becomes the main driver (see Figure 1.SF.4, panel 4). However, some evidence shows that the impact of large oil price shocks on domestic energy inflation can be twice that of small ones (Figure 1.SF.6, panel 1).
Conclusions
See the country-specific notes for Argentina and Venezuela in the “Country Notes” section of the Statistical Appendix. See the country-specific note for Lebanon in the “Country Notes” section of the Statistical Appendix.
Evidence and Implications for Policymakers.” In The Asian Monetary Policy Forum: Insights for Central Banking, edited by Steven J. This chapter unfolds recent patterns in inflation expectations and examines their role in driving inflation, and the implications for monetary policy.
Introduction
Historical episodes in which inflation expectations rose for a sustained period of at least one year suggest that it takes about three years for inflation and short-term expectations (within the next 12 months) to return on average to pre-episode levels. , starting from the historical reactions of the monetary policy. Although long-term (five years into the future) inflation expectations have generally remained anchored on average, short-term expectations have risen sharply across all economies since 2022.
MANAGING EXPECTATIONS: INFLATION AND MONETARY POLICY
Whether the prevailing inflation rate (high or low) affects the explanatory power of inflation expectations. Among the important recent empirical and theoretical contributions on the topic of inflation expectations in the academic literature, see Bems et al. (2021), Binder (2017), Coibion et al. (2020) and Reis (2020), among many others.
Recent Patterns in Inflation Expectations
Long-Term and Term Inflation Expectations (Percentage points in relation to the level at the end of the episode). Inclusion as a historical episode requires four quarters in which both short-term and long-term inflation expectations are rising.
The Role of Expectations in Inflation Dynamics
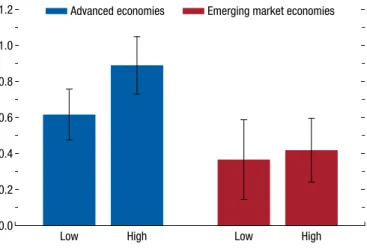
Near-term inflation expectations play a greater role in explaining current inflation in advanced economies than in emerging market economies. A decomposition of the recent dynamics of headline inflation reveals the increasing importance of short-term inflation expectations.
Expectations Formation and Monetary Policymaking
The main reason for this increased sacrifice ratio is the weaker channel of inflationary expectations to monetary policy when there are more backward learners in the economy. Improvements in the monetary policy framework and communication strategy that increase the share of forward-looking learners in the economy improve the trade-off between reducing inflation and promoting growth through their effects on the expectations channel.

VULNERABILITIES AND RISKS
There is no consensus in the rapidly growing literature on the economic costs of fragmentation. The fragmentation of agricultural commodity markets could increase food insecurity in low-income countries, resulting in high social and humanitarian costs that are not included in the model simulations in the chapter.
What Makes Commodities Vulnerable in the Event of Fragmentation?
The price elasticity of supply, which measures how output responds to price changes, is relatively low for commodities in the short run (Figure 3.2, panel 2). This is reflected in their low price elasticity of demand, especially in the short term.
Fragmentation in Commodity Markets
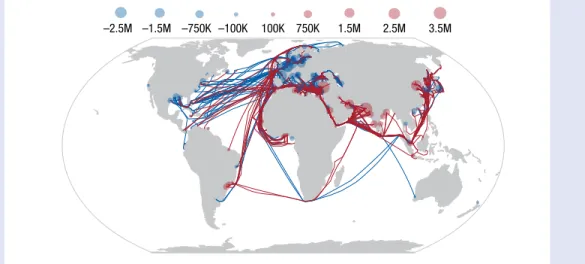
Gravity equations, estimated for the commodities in the sample and augmented to include the similarity between countries' portfolios of military alliances, show that bilateral commodity trade flows are negatively associated with military distance (Figure 3.3).9 However, striking differences are evident in the strength of the relationship across types of commodities: a one-standard-deviation increase in the distance of military alliances (roughly the distance between India and Morocco in 2018) is. The exercise suggests that changes in military alliances due to rising geopolitical tensions may go hand in hand with disruption of trade flows and fuel fragmentation of commodity trade.
Which Commodities Are Most Vulnerable?
Production of these minerals is said to be concentrated in a handful of countries in the US-Europe+ bloc, but they are largely used as raw materials in the China-Russia+ bloc (see online appendix Figure 3.2.6). In contrast, potential price changes for energy and most agricultural commodities are more moderate in the main simulation.
Economic Impacts of Commodity Market Fragmentation
The bloc that includes the countries that voted for Russia's withdrawal from Ukraine in the UN vote in 2022 is labeled the. The bloc that includes the countries that voted for Russia's withdrawal from Ukraine in the UN vote in 2022 is labeled the "US-Europe+ bloc".
Implications for the Clean Energy Transition
Third, the model does not take into account the costs of a more volatile inflation regime, which could make monetary policy more difficult. This metric takes into account the greater emissions intensity of activities in the China-Russia+ bloc and thus the greater effort required to achieve global emissions reduction targets.30 Decarbonizing the global economy would be more difficult if the market for minerals is fragmented.
Summary and Policy Implications
During the Cold War, trade between the two blocs led by the US and the Soviet Union was restricted due to the Soviet strategy of self-sufficiency.2 The Soviet Union traded crude oil, natural gas, and some metals for industrial and agricultural products. goods, especially wheat. For example, after the Soviet invasion of Afghanistan, US President Jimmy Carter imposed a partial embargo on US grain exports to the Soviet Union.3 However, the embargo was ineffective due to the global nature of grain markets.
Assumptions
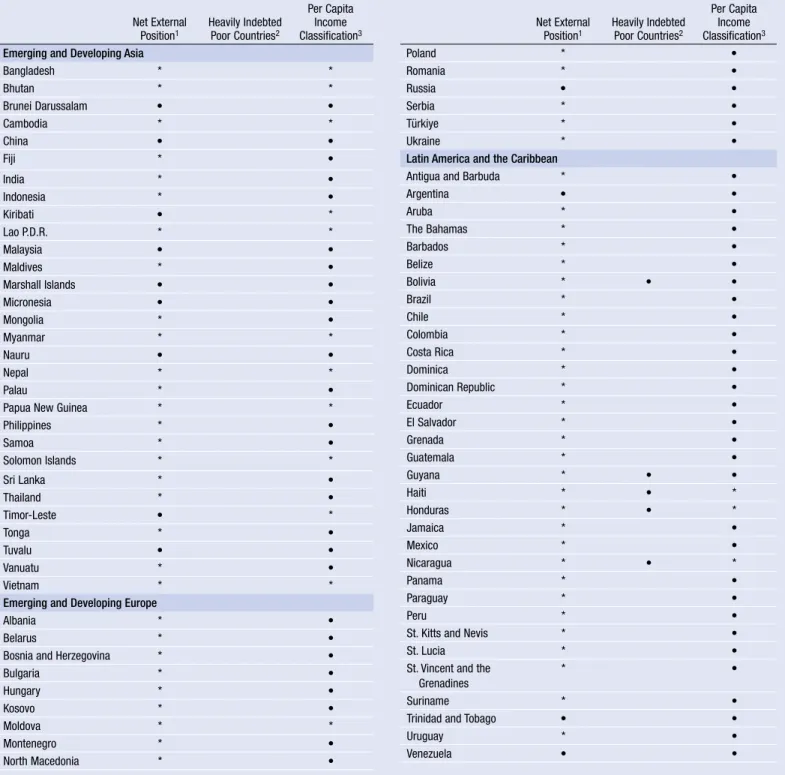
It includes eight sections: Assumptions, What's New, Data and Conventions, Country Notes, Country Classification, General Characteristics and Composition of Groups in the World Economic Outlook Classification, Key Data Documentation, and Statistical Tables. The fifth section summarizes the classification of countries into the various groups presented in the WEO, and the sixth section explains that classification in further detail.
What’s New
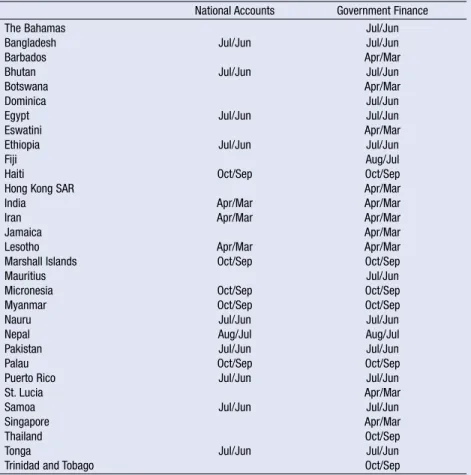
The seventh section provides information on methods and reporting standards for the national accounts and public finance indicators of the Member States included in the report. For convenience only, the 2023-2024 figures are presented with the same accuracy as the historical figures; because they are projections, the same degree of accuracy cannot be derived.
Data and Conventions
Composites for fiscal data are sums of individual country data after conversion to US dollars at the average market exchange rate in the years indicated. Composites related to external sector statistics are sums of individual country data after conversion to US dollars at the average market exchange rate in the years indicated for the balance of payments data and at market exchange rates at the end of the year for debt denominated in currencies other than US dollars.
Country Notes
Sierra Leone: Although the currency was renamed on 1 July 2022, local currency data is expressed in the old leone for the October 2023 WEO. Estimates and projections for the fiscal balance exclude receipts from domestic bond issues as well as privatization operations, in line with the GFSM 2014.
Classification of Countries
General Features and Composition of Groups in the World Economic Outlook Classification
Methodology—Aggregation, Modeling, and Forecasting
Global growth forecasting: assumptions about policy, financial conditions and commodity prices, April 2019, Box 1.2 On the underlying source of changes in capital goods prices: a model-based analysis, April 2019, Box 3.3 Global growth forecasting: assumptions about policy, financial conditions and commodity prices October 2019, Box 1.3. Risk assessment around the baseline projection of the World Economic Outlook, October 2022, Box 1.3 Risk assessment around the baseline projections of the World Economic Outlook April 2023, Box 1.3 Risk assessment around the baseline projections of the World Economic Outlook, October 2023, Box 1.2.
Historical Surveys
Economic Growth—Sources and Patterns
The Great Lockdown: Dissecting the Economic Effects October 2020, Chapter 2 An overview of the literature on the economic impact of lockdowns October 2020, Box 2.1 Global Manufacturing: V-Shaped Recovery and Implications for the Global Outlook April 2021, Box 1.1 After-Effects of The COVID-19 Pandemic: Prospects for Medium-Term Economic Damage April 2021, Chapter 2.
Inflation and Deflation and Commodity Markets
Monetary Policy Challenges in Emerging Markets as Global Financial Conditions Normalize October 2018, Chapter 3 Inflation Dynamics in a Broader Group of Emerging Markets and Developing Economies October 2018, Box 3.1. Commodity Prices and Monetary Policy: High Frequency Analysis October 2023 Commodity Special Feature Online Appendix 1.1 Corporate Inflation Expectations, Attention and the Effectiveness of Monetary Policy October 2023 Box 2.1 Energy Subsidy, Inflation and Expectations: Unpacking Euro Area Measures October 2023 2.3 Fragmentation and Commodity Markets: Vulnerabilities and Risks October 2023 , chapter 3.
Fiscal Policy
Macroeconomic Impact of Corporate Tax Policy Changes April 2018, Box 1.5 Place-Based Policies: Rethinking Fiscal Policies to Tackle Inequalities within Countries October 2019, Box 2.4.
Monetary Policy, Financial Markets, and Flow of Funds
Labor Markets, Poverty, and Inequality
Labor market dynamics by skill level October 2017, Box 2.1 Worker contracts and nominal wage rigidities in Europe: firm-level evidence October 2017, Box 2.2 Wage and employment adjustment after the global financial crisis: firm-level evidence October 2017, Box 2.3 Labor force participation in advanced economies: drivers and prospects April 2018, Chapter 2 Youth labor force participation in emerging market and developing economies versus. Inclusiveness in emerging markets and developing economies and the impact of COVID-19 October 2020, Box 1.2 Recessions and recovery in labor markets: patterns, policies and responses to the.
Exchange Rate Issues
A Greener Labor Market: Employment, Policies and Economic Transformation April 2022, Chapter 3 The Geography of Green and Pollution-Intensive Work: Evidence from the United States April 2022, Box 3.1.
External Payments, Trade, Capital Movements, and Foreign Debt
April 2019, Chapter 3 Evidence from Big Data: Capital Goods Prices Across Countries April 2019, Box 3.2 Capital Benefit Tariffs and Investment: Firm-Level Evidence from Colombia April 2019, Box 3.4 Drivers of Bilateral Trade and the Spillovers from Tariffs April 2019, Chapter 4. The Impact of shutdowns on trade: Evidence from shipping data April 2022, Box 4.2 Firm-level trade adaptation to the COVID-19 pandemic in France April 2022, Box 4.3.
Regional Issues
Country-Specific Analyses
Climate Change Issues
Breaking the gridlock: Identifying the political economy drivers of structural reforms April 2016, Box 3.1 Can reform tides turn the tide. Technological Progress and Labor Shares: A Historical Overview April 2017, Box 3.1 Elasticity of Substitution between Capital and Labor: Concept and Evaluation April 2017, Box 3.2 Routine Tasks, Automation, and Worldwide Economic Dislocation April 2017, Box 3.