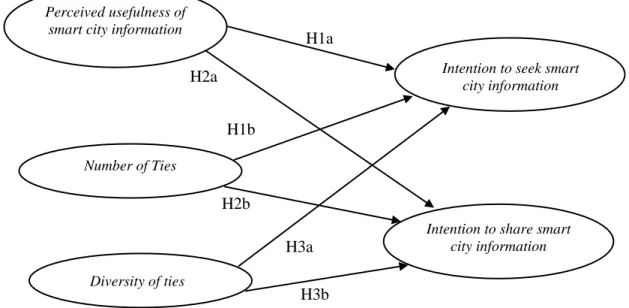
H1a: Perceived usefulness of smart city information has a positive effect on intention to seek information on smart city websites/apps. H1b: Perceived usefulness of smart city information has a positive effect on intention to share information on smart city websites/apps and online social networks. H2a: The number of links has a positive effect on the intention to seek information on the smart city website/apps.
H2b: Number of ties has a positive effect on the intention to share information on smart city websites/applications and online social networks. H3a: Diversity of ties has a positive effect on the intention to search for information on smart city websites/applications. H3b: Diversity of ties has a positive effect on intention to share information on smart city websites/applications and online social networks.
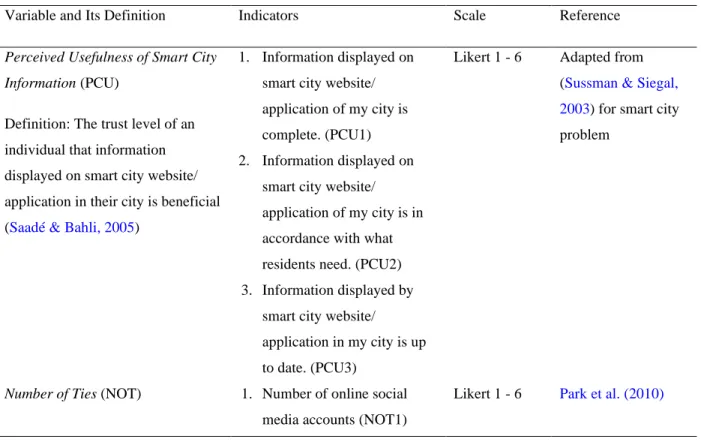
The independent variables included the perceived usefulness of smart city information, the number of tires and the diversity of the tires. I plan to access my city's Smart City website/application to look up the latest city information. If requested, I will place the city information on the smart city website/application of my city.
Data analysis method
DOI: https://doi.org/10.7454/jessd.v4i1.1063 13 value of the cross-loading factor, where the factor loadings of the indicators of the latent variable must be greater than the factor loadings of the indicators of the other latent variables. In addition, reliability and validity tests of the latent variables are performed by referring to Cronbach's alpha value and composite reliability (for reliability tests) and average variance extracted (AVE) (for validity tests). A latent variable is said to have good reliability if the value of Cronbach's alpha and composite reliability is ≥ 0.7, and valid if the value of AVE.
The purpose of the internal model analysis in this study was to see the relationship between the latent variables by using the R-squared of the research model. The higher the value obtained from the R-squared analysis, the better the prediction model from the proposed research model (Hair et al., 2017).
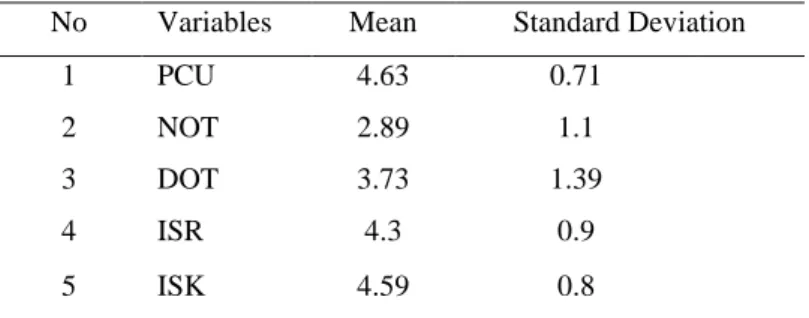
Results and Discussions 1 Descriptive statistics
Outer model analysis
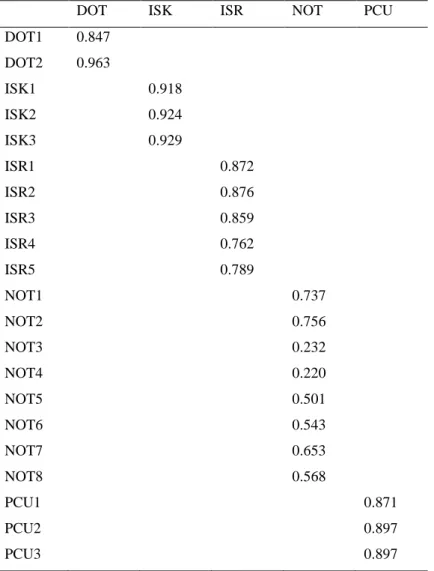
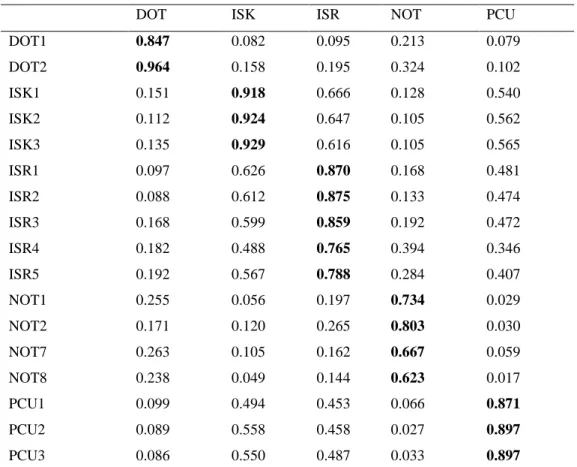
In the external model analysis, convergent and discriminant validity tests of all indicators were performed, and validity and reliability tests of all latent variables were performed. This was done by looking at the value of the external load factor or standardized load factor (SLF) (see Table 4). As can be seen in Table 4, most of the indicators have a load factor value greater than 0.5.
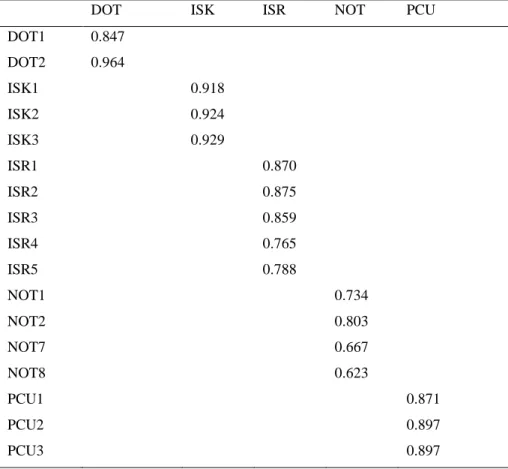
When the indicator with the lowest loading factor, NOT4, is removed, the other loading factor values will increase and so will the values for the other tests, except for the Average Variance Extracted (AVE) value, which is still below 0.5. The next step is to test the discriminant validity by observing the cross-loading factor values. The table explains that the factor loading of each indicator directed at the latent variable is greater than the factor loading of these indicators when directed at other latent variables.
The final stage of the external model analysis is to test the validity and reliability of each latent variable. The reliability test is measured by the Composite Reliability (CR) value, while the validity test is measured by the Average Variance Extracted (AVE) value. The values in Table 7 show that all variables have a composite confidence value ≥ 0.7. Therefore, it can be concluded that all latent variables in this study are reliable.
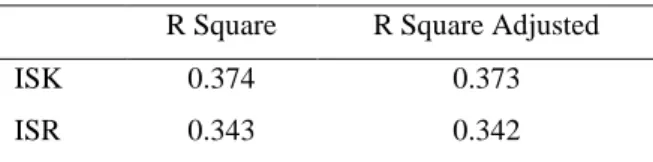
The AVE values of all variables are also more than 0.5, indicating that all variables have good validity. The R-squared value of variable ISK is 0.374, indicating that 37.4% of the data variation can be explained by the ISK model (a model showing the influence of PCU, NOT and DOT variables on the ISK variable ), while the rest is explained by other variables. The same also happens for the ISR variable, where the value of 0.343 indicates that 34.3% of the data variation can be explained by the ISR model (a model showing the effects of PCU, NOT and DOT variables on the ISR variable) . and the rest is explained by other variables.
In general, the higher the R-squared value, the better the model will explain the association between variables. This research takes place in the field of social and behavioral sciences. Therefore, the R-squared value of 37.4% in the ISK model and 34.3% in the ISR model indicates that both are good models to explain the association between variables.
Hypothesis testing
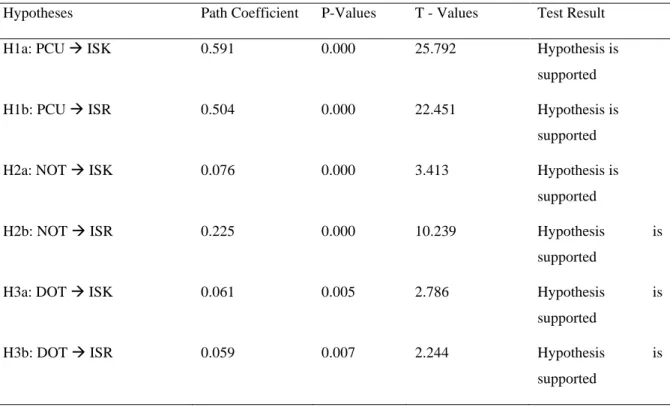
Inner model analysis or structural model is intended to test the relationship between the dependent variable and the independent variables based on R-squared concept and all research hypotheses. However, Cohen (2013) states that specifically for the field of social and behavioral sciences, R-squared = 2% is classified as a weak effect, R-squared = 13% is classified as a moderate effect and R-squared = 26% is classified as a strong effect. The p-values are and the path coefficient is positive in the relationship between perceived usefulness and intention to search and intention to share.
This indicates that the perceived usefulness has a positive and significant effect on the intention to seek and share smart city information. This also means that the better the city residents' perception of the benefits of smart city information, the more they plan to search and share information on smart city websites/applications and on their online social network. The p-value obtained by testing the effect of the number of tires on the intention to search and share smart city information is both 0.000 with positive path coefficients.
This indicates that perceived usefulness has a positive and significant effect on search intention and sharing intention. In other words, the more the number of online social network accounts and the number of friends on Facebook and WhatsApp and WhatsApp groups owned by urban residents, the higher their intentions to search for information on smart city websites/apps and share it on the platform. and with your friends on social media. At the end, the hypotheses are tested on the positive influence of the diversity of ties on the intention to search and the intention to share information about the smart city.
The test results show p-values of 0.005 for the intent to search and 0.007 for the intent to share, with the path coefficients both positive. DOI: https://doi.org/10.7454/jessd.v4i1.1063 21 networks, the intent of senior citizens to search and share information on smart city websites/applications and their online social network.
Discussion
However, the number of friends on FB has the highest loading factor, which means that the number of connections is mainly determined by this indicator. Therefore, it can be concluded that the number of Facebook friends allows a person to have more sources of information as well as greater coverage. These two things have driven the intention to seek information from the smart city digital platform and the intention to share the information on the smart city websites/apps in their cities.
Moreover, the analysis results also indicate that other characteristics of online social networks, namely the diversity of online social network friends (diversity of ties), have a positive effect on the intention to search and share information on smart city websites/applications (H3a and H3b are supported ). Band diversity shows the diversity of friend backgrounds city dwellers have on FB and WAG. The diversity of friends you have on the online social network provides an advantage because they can choose from more information options (Sanz-Cruzado & Castells, 2018; Isaac & Matous, 2017).
The diversity of friends on the online social network also makes city residents' sources of information more diverse, so that they can be tailored to the needs of city residents. These increase the intentions of city residents to find and share information on the smart city website/application in their city or to share smart city information on their online social network.
Conclusion
DOI: https://doi.org/10.7454/jessd.v4i1.1063 23 The results of this study can be used by city governments to manage the information provided through the smart city website and application, where the displayed information must have direct benefits for the daily life of the city's citizens. The findings also suggest that online social networks play an important role in information seeking and sharing. Therefore, the city government can better utilize online social networks to introduce or promote urban development programs as well as raise awareness of the smart cities' digital platforms.
Research aiming to determine people's perceptions of the benefits of information should be conducted using the longitudinal method so that an increase in perception can be observed from period to period. For example, when it comes to the number of friends on Facebook, the scale used is a multiple of 100. This interval should be reduced so that there is a clear difference between groups with a large number of friends and a few.
Influence of the importance of the social responsibility norm: Effects of past helping on the response to dependency relationships. Belief, attitude, intention, and behavior: An introduction to theory and research (Vol. 27).https://www.scinapse.io/papers/2036389121. Sage publications.https://us.sagepub.com/en-us/nam/a-primer-on-partial-least-squares-structural-equation-modeling-pls-.
Social network ties predict land use diversity and land use change: a case study in Ghana. An empirical study of the growth of advertising on the Big Four (Facebook, Twitter, Instagram, WhatsApp). Intention to live in a smart city based on its characteristics in the perception of the young public.
The impact of cognitive absorption on perceived usefulness and perceived ease of use in on-line learning: An extension of the technology acceptance model. The Smart City Vision: How Innovation and ICT Can Build Smart, in Livable, “Sustainable Cities.