The Maslach-Trisni Burnout Inventory: Adaptation for Indonesia
Article in JP3I (Jurnal Pengukuran Psikologi dan Pendidikan Indonesia) · May 2022
DOI: 10.15408/jp3i.v11i1.24400
CITATIONS
6
READS
2,376
2 authors:
Lucia Trisni Widhianingtanti Soegijapranata Catholic University 21PUBLICATIONS 32CITATIONS
SEE PROFILE
Gilles van Luijtelaar Radboud University
415PUBLICATIONS 13,880CITATIONS SEE PROFILE
All content following this page was uploaded by Lucia Trisni Widhianingtanti on 19 May 2022.
The user has requested enhancement of the downloaded file.
DOI: http://dx.doi.org/10.15408/jp3i.v11i1.24400 http://journal.uinjkt.ac.id/index.php/jp3i
JP3I (Jurnal Pengukuran Psikologi dan Pendidikan Indonesia), p-ISSN: 2089-6247, e-ISSN: 2654-5713 This is an open access article under CC-BY-SA license (https://creativecommons.org/licenses/by-sa/4.0/)
The Maslach-Trisni Burnout Inventory: Adaptation for Indonesia
Lucia Trisni Widhianingtanti1, Gilles van Luijtelaar2
Psychology Department, Soegijapranata Catholic University, Semarang, Indonesia1 Donders Institute for Brain, Cognition, and Behavior, Radboud University, Nijmegen, The
Netherlands 2 [email protected]
Abstract
Burnout is commonly measured with the Maslach Burnout Inventory (MBI), which consists of three subscales measuring emotional exhaustion, personal accomplishment, and cynicism. We adapted the scale and then explored and confirmed the three dimensions on the Indonesian version named The Maslach-Trisni Burnout Inventory (M-TBI) with an exploratory analysis followed by Confirmatory Factor Analysis (CFA) from 822 workforces. The sensitivity for different job characteristics and demographic factors was established with analyses of variance and based on percentile scores of the subscales, three categories for burnout tendency were proposed. The scores on the three subscales were compared with those of Western countries. There are similar scores for emotional exhaustion and cynicism, but the sample score for personal accomplishment tends to be lower than the western countries.
It can be concluded that the M-TBI scale is a reliable, sensitive, and efficient tool to measure the burnout tendency in the workforce in Indonesia.
Keywords: adaptation scale, burnout, factor analysis
Abstrak
Burnout biasanya diukur menggunakan Maslach Burnout Inventory (MBI) yang terdiri dari tiga subskala yang mengukur kelelahan emosional, pencapaian pribadi, dan sinisme. Studi ini mengadaptasi skala tersebut dan mengeksplorasi serta mengonfirmasi tiga dimensi pada versi Indonesia bernama The Maslach-Trisni Burnout Inventory (M-TBI) dengan analisis eksploratif diikuti oleh Analisis Faktor Konfirmatori dari 822 tenaga kerja.
Sensitivitas untuk karakteristik pekerjaan yang berbeda dan faktor demografis diolah dengan analisis varians serta berdasar skor persentil dari subskala tiga kategori untuk kecenderungan kelelahan. Skor pada tiga subskala dibandingkan dengan negara-negara Barat. Terdapat skor yang sama untuk kelelahan emosional dan sinisme, tetapi skor sampel untuk pencapaian pribadi cenderung lebih rendah daripada negara-negara Barat. Dapat disimpulkan bahwa skala M-TBI merupakan alat yang andal, sensitif, dan efisien untuk mengukur kecenderungan burnout pada tenaga kerja di Indonesia.
Kata kunci: adaptasi skala, analisis faktor, burnout
2-21
http://journal.uinjkt.ac.id/index.php/jp3i This is an open access article under CC-BY-SA license (https://creativecommons.org/licenses/by-sa/4.0/)Introduction
Workforces from Indonesia are among the most dissatisfied workers in the world. According to a recent study, Indonesia ranked the lowest, with only 18 percent of respondents saying they were satisfied with their work. A survey among 17,623 Indonesians regarding their job satisfaction showed that 73% of the workforce were not satisfied with their work, 54% experienced an incompatibility regarding their educational background and current position, and 85% admitted that they do not have a proper balance between work and personal life. Research from the Master of Occupational Medicine Study Program, Faculty of Medicine, University of Indonesia (MKK FKUI) shows that there are 83% of health workers in Indonesia experience moderate and severe burnout syndrome, which is psychologically at risk of disrupting the quality of life and work productivity (Virdani, 2022). It is obvious that all this may have a severe impact on work productivity, career perspective, and health and that work-related stress is widely spread among workforces in Indonesia. It is commonly acknowledged that chronic work stress may lead to burnout. The exact prevalence of burnout in Indonesia is unknown, and only limited data is available.
Pre pandemic data from three Javanese public hospitals showed that 48% of the nurses in the medical surgery rooms have symptoms of burnout (Setyowati et al., 2019; Nursalam et al., 2018), while the percentages of nurses in private hospitals with burnout symptoms were even higher (Sudrajat et al., 2021).
The concept of burnout was introduced in the mid-1970s; it is a psychological syndrome emerging as a prolonged response to chronic interpersonal stressors on the job. It took a long time before burnout was recognized, considering that physicians could not identify physical causes for the complaints (Maslach &
Leiter 1997). A lack of biomarkers also caused this long road to its recognition, and the diagnosis of burnout was based mainly on the outcomes of a questionnaire. However, burnout was recently recognized by the WHO as witnessed by its inclusion in the International Classification of Diseases (ICD- 11) as “a syndrome conceptualized as resulting from chronic workplace stress that has not been successfully managed”. Moreover, brain correlates of burnout were identified: Electroencephalography (EEG) studies in burnout patients repeatedly reported changes in Event-Related Potentials pointing toward brain-related disturbances in information processing (van Luijtelaar et al., 2010; Sokka et al., 2014; 2016), while neuroimaging studies indicated changes in the Hypothalamus-Pituitary-Adrenal (HPA) axis and alterations in size and volume in limbic brain structures affected by the stress-activated system (Chow et al., 2018).
A leading measurement tool for burnout is the Maslach Burnout Inventory (MBI; Maslach & Jackson, 1986; Maslach et al., 1996), developed to measure occupational stress reactions among human service professionals. The items of the MBI, written in the form of statements about personal feelings or attitudes, are answered on a fully anchored 7-point Likert scale in terms of the frequency with which the respondent has experienced them (Maslach et al., 1996). The MBI consists of three subscales or dimensions that measure emotional exhaustion, lack of personal accomplishment, and depersonalization/cynicism. The nine items of the emotional exhaustion scale measure the depletion of emotional resources, as distinct from physical exhaustion or mental fatigue (Maslach & Leiter, 2016; Leiter & Maslach, 2016). The eight items of the personal accomplishment scale assess feelings of competence and achievements in one's work with people negatively. The five items encompassing the depersonalization scale measure the development of negative, cynical, low empathy, and impersonal response attitudes toward the recipients of one’s services. Excessive distancing may be detrimental to the quality of people providing services to humans. The scale was also adopted for other services or care (Maslach & Leiter, 2016; Nantsupawat et al., 2016; Hajar & Hudan, 2018; Lo et al., 2018) because the empathic concern is an essential attribute in many helping relationships (Leiter & Schaufeli, 1996).
The MBI was developed to measure burnout in various occupational groups such as teachers, nurses, and front office staff, and differences between occupations were found. This illustrated the apparent need for a burnout scale independent of vocational aspects, which can be used in non-service professions. The MBI-General Survey (Maslach & Jackson, 1996; Choi et al., 2019) was developed and adapted for occupations without direct or only casual contact with people. The MBI-GS defines burnout as a crisis
http://journal.uinjkt.ac.id/index.php/jp3i
3-21
This is an open access article under CC-BY-SA license (https://creativecommons.org/licenses/by-sa/4.0/)
in one’s relationship with work, not necessarily as a crisis in one's relationships with people at work. The MBI-GS has the same three subscales as the original MBI. The exhaustion items became more generic, without the MBI’s emphasis on emotions and direct reference to service recipients (Maslach et.al., 1996;
Maslach et.al., 2001). The accomplishment items got a somewhat broader focus and covered both social and nonsocial aspects of occupational accomplishments. The third subscale, depersonalization, was mainly changed from items reflecting distancing oneself emotionally from service recipients and cynical attitudes toward them to distancing oneself from work itself and to negative attitudes toward work in general (Bakker et al., 2002; Matejic et al., 2015; Wickramasinghe et al., 2018).
Even though the first MBI was constructed through a statistical rather than a theoretical approach (Maslach & Schaufeli, 1993; Schaufeli & van Dierendonck, 1993), factor analyses regarding the proposed factor structure on earlier versions of the MBI or scales with a different number of items did sometimes give only modest support for the three subscales. However, several studies using various types of confirmatory factor analysis (CFA) models and procedures have found that a non-hierarchical three- factor structure, as was earlier suggested by Maslach, provided the best fit, even if some items loaded on more than one factor (Loera, 2014), and these analyses included the MBI-GS (Bakker et al., 2002). Others proposed that a variant, a hierarchical bifactor model with a global burnout factor (level 1) and the three specific factors (level 2: emotional exhaustion, depersonalization, and reduced personal accomplishment) showed the best goodness of fit (Mészáros et al., 2014). Regarding the reliability of the MBI, it was found that the internal consistency coefficients for the three subscales ranged from .71 to .90 and that the scales had a high test-retest reliability (Maslach & Jackson, 1986).
Burnout has been studied across professions (Leiter & Schaufeli, 1996), across different countries and cultures (Mateji’c, 2015; Ang et al., 2016; Hajar & Hudan, 2018; Lo et al., 2018; Wickramasinghe et al., 2018; Nguyen, 2018); however, in Indonesia, there is only one preliminary study that has been done before but neither psychometric properties of an Indonesian version of the MBI-GS including its factorial structure, nor demographic factors affecting them, were published. Only the MBI-Human Service Survey was validated with CFA and applied among policemen (Yulianto, 2020) and earlier among nurses.
Therefore, the first purpose of this study was to adapt the MBI-GS into an Indonesian version cross- culturally. The second purpose was to establish some reliability and validity measures: Cronbach’s alpha and the factorial structure of the dimensions of the scale. Both explorative factor analyses (EFA) and CFA will be used. Finally, the effects of demographic and job characteristics will be established and compared with literature findings. This was achieved in a medium-size sample of front office staff, teachers, nurses, and professionals. These four distinct groups are all public service employees working in a monotonous rhythm and, with long working hours, are vulnerable to developing burnout.
Methods
Instruments
Only the MBI-GS scale was used. The translation and cultural adaptation process of this scale MBI- GS scale were done according to Beaton (2001). In brief, the scale was translated by two clinical psychologists and two bilingual professional translators. Their reports were reviewed when harmonizing the first Indonesian translation. Their translation was back-translated, and each item of the new English version was compared with the original English version. Expressions deemed confusing or culturally inappropriate were revised through discussions in the expert panel, and alternative expressions and clarifications of the questions inquiring about feeling depressed and tired for no good reason were proposed. The panel noted that the translation of the expression “feeling nervous” in Indonesian is close to ‘feeling angry’, which may be confusing for some participants. The panel recommended adding a conceptually equivalent term for “anxious” to this item. They also recommended replacing “how often”
with “how much” because the literal translation of “how often” is not commonly used and difficult to understand for many Indonesians, especially those with lower levels of education. After several stages of adaptation, translation, and back translation replacement of items with low factor loadings and try out,
4-21
http://journal.uinjkt.ac.id/index.php/jp3i This is an open access article under CC-BY-SA license (https://creativecommons.org/licenses/by-sa/4.0/) the expert panel judged all final items to be of good quality. The next step was a pretest of the Maslach- Trisni Burnout Inventory (M-TBI) in a small sample: the results did not lead to further changes.Sample and Data Collection
Next, the M-TBI scale was administered to an online sample consisting of 822 participants using Google Form, and demographic data including age, marital status, education level, working period, type of work (occupation), and sex were collected. Informed consent was obtained by an active mouse click stating that the data could be used for scientific reasons, including the publication of the data in various forms.
Details of the demographic data of all participants of the survey are presented in Table 1.
Table 1. The Demographic Background of Participants (N=822)
Number Percentage Total
Age in the year (n,%) 22-30 316 38.4 %
31- 40 282 34.3 %
41- 50 169 20.6 %
> 50 years 55 6.7 % 822
Educational level (n,%) High School 29 3.5 %
Diploma 187 22.7 %
Bachelor 406 49.4 %
Master degree 152 18.5 %
Doctoral 48 5.8 % 822
Working period (n,%) ≤ 4 years 253 30.8 %
5-10 years 256 31.1 %
11-20 years 212 25.8 %
21-30 years 74 9.0 %
>30 years 27 3.3% 822
Occupation (n,%) Front office staff 244 29.7%
Teacher 242 29.4%
Nurse 286 34.8%
Others 50 14.6% 822
Sex (n,%) Male 213 25.9 %
Female 609 74.1 % 822
Sources: Personal data
Data Analysis
There are two factor analyses used in this study. Exploratory Factor Analysis is done by SPSS software. Confirmatory Factor Analysis is done by the open-source software package of JASP. The Kaiser-Meyer-Olkin Measure of Sampling Adequacy and Bartlett’s Test of Sphericity were used to assess the suitability of the data for factor analysis. KMO correlation above .50 is considered adequate for analyzing the EFA output (Hair et al., 2009). Exploratory factor analysis was first performed unrotated, using maximum likelihood extraction and eigenvalues >1. Additionally, we performed EFA with varimax rotation and enforced a three-factor solution in order to test the theoretical structure of the MBI.
http://journal.uinjkt.ac.id/index.php/jp3i
5-21
This is an open access article under CC-BY-SA license (https://creativecommons.org/licenses/by-sa/4.0/)
Results and Discussion
Psychometrics Properties Reliability
Cronbach's α was used as a reliability index; it is typically used when the scale has several Likert-type items summed to make a composite score. The coefficient is based on the mean correlation of each item in the M-TBI scale with every other item (Leech et al., 2011). The Cronbach alpha is .916; the internal consistency of this scale is high and exceeds the critical value of .70. Therefore, the scale provides reliable results for measuring burnout tendency in the Indonesian workforce.
All correlation coefficients between each item and the total score of the M-TBI Score were positive.
Most items correlated between .43 and .65 with the total score, suggesting that all items contributed to the total score. Some of the items scored less than .5, such as Exhaustion 5 and most of the Accomplishment items (many were close to .5), however, this did not affect Cronbach’s α if these items were deleted. Therefore, all items contribute in a sufficient way to the scale's internal consistency.
Validity
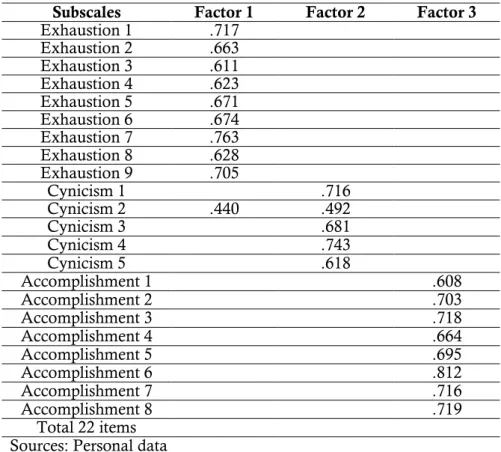
There were no missing data. First, an EFA (Principal Component Analyses (PCA) procedure) was used to reveal the number of factors underlying the 22 items of the adapted MBI-scale in our sample of 822 subjects, contributing to the construct validity of the M-TBI. The PCA had good prerequisite statistics: Kaiser-Meyer-Olkin measure of sampling adequacy was 0.931, and close to 1, indicating that the proportion of variance in the M-TBI scores that can be attributed to the underlying factors is sufficiently high; Bartlett’s test of sphericity showed that 𝝌2(231) = 9734.470, p<.001, indicating that the scores of the items are interrelated and therefore suited for the detection of structure among them. The factor structure (varimax rotation was used) is presented in Table 2. Eigenvalues of the three factors and percentage variance explained by the three-factors models are shown in Table 3. SPSS version 23 was used for the EFA.
Table 2. Pattern Matrix for Exploratory Factor Analysis (EFA; Varimax Rotation) on M-TBI Subscales Factor 1 Factor 2 Factor 3
Exhaustion 1 .717 Exhaustion 2 .663 Exhaustion 3 .611 Exhaustion 4 .623 Exhaustion 5 .671 Exhaustion 6 .674 Exhaustion 7 .763 Exhaustion 8 .628 Exhaustion 9 .705
Cynicism 1 .716
Cynicism 2 .440 .492
Cynicism 3 .681
Cynicism 4 .743
Cynicism 5 .618
Accomplishment 1 .608
Accomplishment 2 .703
Accomplishment 3 .718
Accomplishment 4 .664
Accomplishment 5 .695
Accomplishment 6 .812
Accomplishment 7 .716
Accomplishment 8 .719
Total 22 items Sources: Personal data
6-21
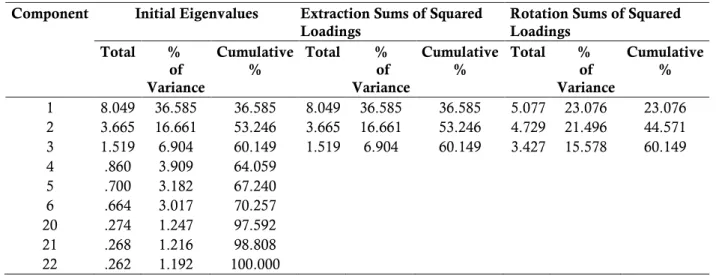
http://journal.uinjkt.ac.id/index.php/jp3i This is an open access article under CC-BY-SA license (https://creativecommons.org/licenses/by-sa/4.0/) Table 3. Total Variance Explained of Items of the M-TBI ScaleComponent Initial Eigenvalues Extraction Sums of Squared Loadings
Rotation Sums of Squared Loadings
Total % of Variance
Cumulative
%
Total % of Variance
Cumulative
%
Total % of Variance
Cumulative
% 1 8.049 36.585 36.585 8.049 36.585 36.585 5.077 23.076 23.076 2 3.665 16.661 53.246 3.665 16.661 53.246 4.729 21.496 44.571 3 1.519 6.904 60.149 1.519 6.904 60.149 3.427 15.578 60.149
4 .860 3.909 64.059
5 .700 3.182 67.240
6 .664 3.017 70.257
20 .274 1.247 97.592
21 .268 1.216 98.808
22 .262 1.192 100.000 Sources: Personal data
The proportion of total variance explained in Table 3 indicated the presence of the three factors and that 60.149 % of the variance is explained by a three-factor model. Also, the Scree plot indicated a three- factor model. None of the other components except the first three had Eigenvalues larger than 1.
Therefore, there are no clear indications that a model with more factors would have yielded a significantly higher proportion of variance explained.
Construct Validity
The freely available open-source JASP (https://jasp-stats.org/download/) package was used for the CFA. The procedure used has been described by Hu & Bentler (1999) and Brown (2015). The Chi-square test was used as a fit of the three-factor model (𝝌2(206) = 1099.39, p<.001). Additional fit indices were the Root Mean Square Error of Approximation (RMSEA), and the acceptance criterion is RMSEA ≤ .080 (Cudeck & Browne, 1993; Kelley & Lai, 2011). Comparative Fit Index (CFI) and Tucker-Lewis Index (TLI). Acceptance criteria are for TLI ≥ .90. and CFI ≥ .90. Our analyses showed that the RMSEA was 0.073. the TLI was 0.896. and the CFI was 0.907, together indicating an acceptable to a good fit for the three-factor model. The JASP generated model plot of the three-factor model is shown in Figure 1.
Figure 1. The Model Plot of the CFA
http://journal.uinjkt.ac.id/index.php/jp3i
7-21
This is an open access article under CC-BY-SA license (https://creativecommons.org/licenses/by-sa/4.0/) Demographic factors affecting M-TBI
An online data collection method disseminated through social media reached a representative sample of front office staff, teachers, nurses, and professionals. Only persons who have worked for more than one year were included. The scores on the subscales and total score data regarding the duration of the working period in years, age, type of occupation, level of education, and sex are presented in Table 4;
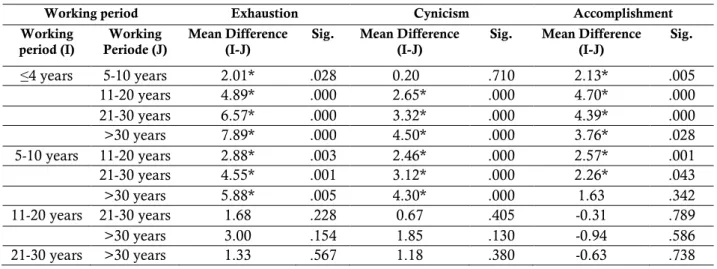
this table also showed significant effects on the total score for all factors except sex. Significant working period effects were found on all four scales (p<.01). Table 6 shows the outcomes of the posthoc tests on the three subscales for the working period: in general, the highest scores were obtained for those that started their career recently.
8-21
http://journal.uinjkt.ac.id/index.php/jp3i This is an open access article under CC-BY-SA license (https://creativecommons.org/licenses/by-sa/4.0/)Table 4. Mean and SD of Three Subscales and Total M-TBI Score, F, and p values from Anova for the Total Score N Exhaustion Cynicism P. Accomplishment Total F (total) Sig.
Mean SD Mean SD Mean SD Mean SD
Working Period ≤4 253 22.49 10.17 8.09 6.36 17.91 8.36 48.48 18.54
5-10 256 20.47 10.80 7.89 6.43 15.77 8.32 44.14 20.20
11-20 212 17.59 9.69 5.44 5.14 13.21 7.83 36.24 18.04
21-30 74 15.92 11.19 4.77 5.56 13.51 9.90 34.20 20.86
>30 27 14.59 8.06 3.59 4.11 14.15 10.67 32.33 16.31
Total 822 19.75 10.54 6.90 6.12 15.51 8.64 42.16 19.86 17.706 .000
Occupation Front office staff
244 23.21 10.91 8.31 5.93 17.23 8.86 48.75 18.84
Teacher 242 19.37 10.48 6.42 6.22 13.45 7.16 39.24 19.97
Nurse 286 17.68 9.77 6.53 6.18 16.80 9.09 41.01 19.34
Professional 26 16.00 9.52 4.50 5.10 8.97 6.71 29.47 18.57
Other 14 17.79 7.42 4.36 3.43 11.57 7.64 33.71 15.21
Total 822 19.75 10.54 6.90 6.17 15.51 8.64 42.16 19.86 13.308 .000
Education High School 29 18.83 9.76 10.55 4.67 26.45 10.55 55.83 15.39
Diploma 187 17.55 9.64 5.67 5.39 17.05 9.06 40.27 18.89
Bachelor 406 21.41 10.86 8.37 6.61 15.94 8.17 45.72 20.02
Master degree 152 19.71 10.38 4.88 4.78 12.13 6.80 36.71 18.25
Doctoral 48 14.96 9.37 3.44 4.08 9.98 6.02 28.38 16.82
Total 822 19.75 10.54 6.90 6.11 15.51 8.64 42.16 19.86 17.984 .000
Age in years ≤30 316 22.40 10.49 8.4 6.69 18.00 8.68 48.80 19.92
31- 40 282 18.97 10.27 6.51 5.69 14.66 7.88 40.13 18.49
41- 50 169 17.43 10.61 5.63 5.43 13.47 8.56 36.53 19.43
> 50 years 55 15.64 8.41 4.15 4.50 11.87 8.79 31.65 15.44
Total 822 19.75 10.54 6.90 6.17 15.51 8.64 42.16 19.86 24.297 .000
Sex Male 213 19.89 10.95 8.10 6.09 16.08 9.53 44.08 19.98
Female 609 17.70 10.40 6.48 6.07 15.31 8.30 41.49 19.79
Total 822 19.75 10.54 6.9 6.11 15.51 8.64 42.16 19.86 2.687 .102
http://journal.uinjkt.ac.id/index.php/jp3i
9-21
This is an open access article under CC-BY-SA license (https://creativecommons.org/licenses/by-sa/4.0/)
The type of occupation did matter as well: there were significant occupation effects for the total score and the three subscales (p <.01). The post-doc tests, for details, see Table 6, showed that front office staff had, in general, the highest scores for all three subscales and the professionals the least and that nurses did also not score particularly well on accomplishment.
Table 5. Post Hoc LSD of the Working Period on the Three Subscales of M-TBI
Working period Exhaustion Cynicism Accomplishment
Working period (I)
Working Periode (J)
Mean Difference (I-J)
Sig. Mean Difference (I-J)
Sig. Mean Difference (I-J)
Sig.
≤4 years 5-10 years 2.01* .028 0.20 .710 2.13* .005
11-20 years 4.89* .000 2.65* .000 4.70* .000
21-30 years 6.57* .000 3.32* .000 4.39* .000
>30 years 7.89* .000 4.50* .000 3.76* .028
5-10 years 11-20 years 2.88* .003 2.46* .000 2.57* .001
21-30 years 4.55* .001 3.12* .000 2.26* .043
>30 years 5.88* .005 4.30* .000 1.63 .342
11-20 years 21-30 years 1.68 .228 0.67 .405 -0.31 .789
>30 years 3.00 .154 1.85 .130 -0.94 .586
21-30 years >30 years 1.33 .567 1.18 .380 -0.63 .738
Sources: Personal data
Table 6. Post Hoc LSD Tests of Occupation on the Three Subscales of M-TBI
Occupation Exhaustion Cynicism Accomplishment
Occupation (I) Occupation (J)
Mean Difference (I-
J)
Sig. Mean
Difference (I- J)
Sig. Mean Difference (I-
J)
Sig.
Front office staff Teacher 3.84* .000 1.89* .001 3.78* .000
Nurse 5.53* .000 1.78* .001 0.43 .560
Professional 7.21* .000 3.81* .000 8.26* .000
Others 5.42 .056 3.95* .018 5.66* .014
Teacher Nurse 1.69 .060 -0.11 .840 -3.35* .000
Professional 3.37 .067 1.92 .075 4.48* .003
Others 1.59 .575 2.06 .214 1.88 .415
Nurse Professional 1.68 .357 2.03 .058 7.83* .000
Others -0.11 .970 2.17 .190 5.23* .023
Professional Others -1.79 .582 0.14 .940 -2.60 .325
Sources: Personal data
Table 7. Post Hoc LSD Tests of Education Effects on Three Subscales of M-BTI
Education Exhaustion Cynicism Accomplishment
Education (I) Education (J) Mean Difference (I-J)
Sig. Mean Difference (I-J)
Sig. Mean Difference (I-J)
Sig.
High School Diploma 1.282 .536 4.878* .000 9.400* .000
Bachelor -2.579 .197 2.182 .053 10.505* .000
Master
Degree -0.883 .675 5.677* .000 14.323* .000
Doctoral 3.869 .114 7.114* .000 16.469* .000
Diploma Bachelor -3.861* .000 -2.696* .000 1.105 .125
Master
Degree -2.165 .057 0.799 .212 5.923* .000
Doctoral 2.587 .124 2.236* .018 7.069* .000
10-21
http://journal.uinjkt.ac.id/index.php/jp3i This is an open access article under CC-BY-SA license (https://creativecommons.org/licenses/by-sa/4.0/)Bachelor Master
Degree 1.696 .086 3.494* .000 3.818* .000
Doctoral 6.448* .000 4.932* .000 5.964* .000
Master Degree Doctoral 4.752* .006 1.437 .138 2.146 .112
Sources: Personal data
Table 8. Post Hoc LSD Tests of Age Effects on the Three Subscales of M-TBI
Age Exhaustion Cynicism Accomplishment
Age (I) Age (J) Mean Difference (I-
J)
Sig. Mean Difference (I-
J)
Sig. Mean Difference (I-
J)
Sig.
≤30 31-40 3.43* .000 1.89* .000 3.34* .000
41-50 4.97* .000 2.77* .000 4.52* .000
>50 6.76* .000 4.26* .000 6.12* .000
31-40 41-50 1.54 .125 0.88 .132 1.18 .148
>50 3.33* .029 2.37* .007 2.78* .025
41-50 >50 1.79 .264 1.49 .109 1.60 .220
Sources: Personal data
A significant type of education effect was obtained for the total score (Table 4) and the three subscales (p <.001). The highest scores for the total score and cynicism were obtained by those with only high school, followed by bachelors, next diploma, master and doctorate (Ph.D.), for the exhaustion scale the bachelors scored highest followed by high school, masters and doctorates, between accomplishment and level of education a negative linear relationship was found. The Ph.D. scored lowest on all four scales.
The details of the posthoc tests, presented in Table 7. showed that for total and cynicism scales, high school and bachelors scored significantly higher than a diploma, master, and Ph.D., for the total score, diploma score higher than Ph.D., significantly higher scores were found for exhaustion for bachelors compared to diploma and Ph.D., in contrast, for the accomplishment scale, high school was higher than all four other education, and diploma and bachelor scored higher than M.Sc. and Ph.D. These data indicate that those with only high school and a bachelor's degree have a higher vulnerability to developing or having burnout than those with a Master's or Ph.D.
Age effects were also significant (Table 4); the youngest group always had the highest. The oldest group had the lowest scores. The posthoc tests, presented in Table 9, showed significantly higher scores for the youngest group (≤30) compared to all other groups for all scales, and also, the 31-40 group scored higher than the oldest participants on all scales. There were also effects of sex on the cynicism scale, with males scoring higher than females.
Discussion
The Adaptation process
Our first purpose was to adapt the MBI into the Indonesian version and check whether the three-factor structures representing and measuring emotional exhaustion, cynicism, and personal accomplishment (Maslach et al., 2001) were also present in the adapted version. The scale was adapted based on the schema proposed by Beaton (2001). Several changes were proposed throughout the adaptation process.
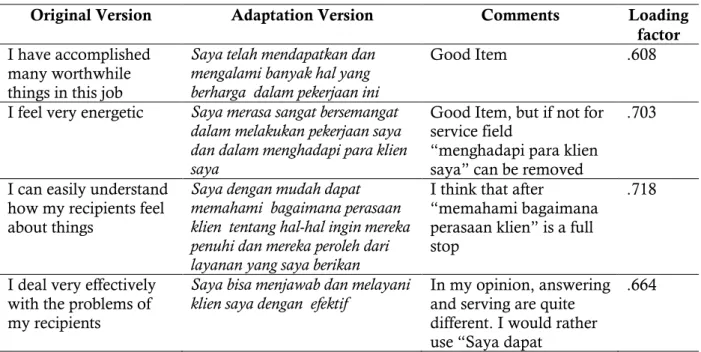
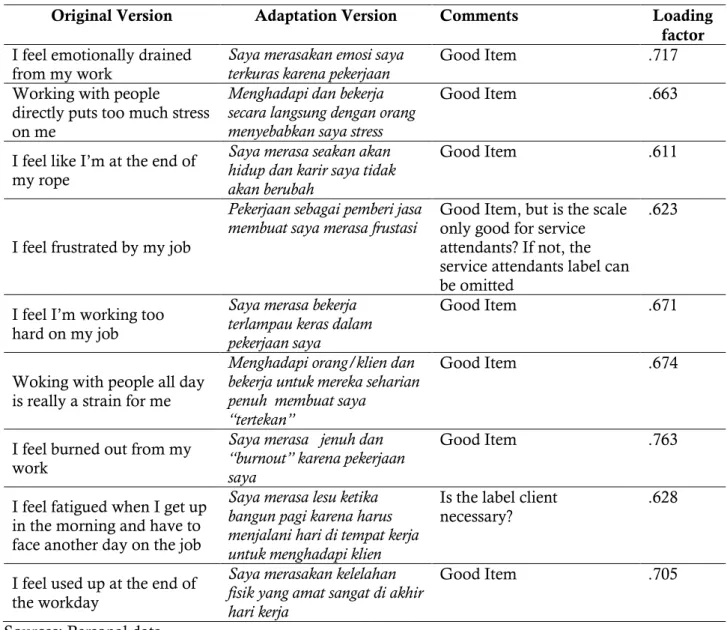
The general term patients were used in the items of the inventory to refer to the particular people to the respondent providing service, care, or treatment. An overview of the original and Indonesian items is presented in Table 9-11, including their factor loadings. Exhaustion item 7, "I feel burned out from my work", is the most powerful item with a loading factor of .780 on the subscale Exhaustion.
11-21
http://journal.uinjkt.ac.id/index.php/jp3i
This is an open access article under CC-BY-SA license (https://creativecommons.org/licenses/by-sa/4.0/)
Table 9. Translation of Items of Exhaustion and the Factor Loadings
Original Version Adaptation Version Comments Loading
factor I feel emotionally drained
from my work
Saya merasakan emosi saya
terkuras karena pekerjaan Good Item .717 Working with people
directly puts too much stress on me
Menghadapi dan bekerja secara langsung dengan orang menyebabkan saya stress
Good Item .663
I feel like I’m at the end of my rope
Saya merasa seakan akan hidup dan karir saya tidak akan berubah
Good Item .611
I feel frustrated by my job
Pekerjaan sebagai pemberi jasa
membuat saya merasa frustasi Good Item, but is the scale only good for service attendants? If not, the service attendants label can be omitted
.623
I feel I’m working too hard on my job
Saya merasa bekerja terlampau keras dalam pekerjaan saya
Good Item .671
Woking with people all day is really a strain for me
Menghadapi orang/klien dan bekerja untuk mereka seharian penuh membuat saya
“tertekan”
Good Item .674
I feel burned out from my work
Saya merasa jenuh dan
“burnout” karena pekerjaan saya
Good Item .763
I feel fatigued when I get up in the morning and have to face another day on the job
Saya merasa lesu ketika bangun pagi karena harus menjalani hari di tempat kerja untuk menghadapi klien
Is the label client
necessary? .628
I feel used up at the end of the workday
Saya merasakan kelelahan fisik yang amat sangat di akhir hari kerja
Good Item .705
Sources: Personal data
Table 10. Translation of items of Personal Accomplishment and the Factor Loadings Original Version Adaptation Version Comments Loading
factor I have accomplished
many worthwhile things in this job
Saya telah mendapatkan dan mengalami banyak hal yang berharga dalam pekerjaan ini
Good Item .608
I feel very energetic Saya merasa sangat bersemangat dalam melakukan pekerjaan saya dan dalam menghadapi para klien saya
Good Item, but if not for service field
“menghadapi para klien saya” can be removed
.703
I can easily understand how my recipients feel about things
Saya dengan mudah dapat memahami bagaimana perasaan klien tentang hal-hal ingin mereka penuhi dan mereka peroleh dari layanan yang saya berikan
I think that after
“memahami bagaimana perasaan klien” is a full stop
.718
I deal very effectively with the problems of my recipients
Saya bisa menjawab dan melayani
klien saya dengan efektif In my opinion, answering and serving are quite different. I would rather use “Saya dapat
.664
12-21
http://journal.uinjkt.ac.id/index.php/jp3i This is an open access article under CC-BY-SA license (https://creativecommons.org/licenses/by-sa/4.0/)bertindak secara efektif ketika klien menghadapi suatu masalah”
In my work, I deal with emotional problems very calmly
Saya menghadapi masalah- masalah emosional dalam
pekerjaan saya dengan tenang dan
“kepala dingin”
Good Item .695
I feel I’m positively influencing other people’s lives through my work
Saya merasa memberikan pengaruh positif terhadap kehidupan orang lain melalui pekerjaan saya sebagai pemberi jasa
Good Item,
but “sebagai pemberi jasa” is necessary or not?
.812
I can easily create a relaxed atmosphere with my recipients
Saya dengan mudah bisa menciptakan suasana yang santai/relaks dengan para klien
Good Item .716
I feel exhilarated after working closely with my recipients
Saya merasa gembira setelah melakukan tugas saya untuk para klien secara langsung
Good Item .719
Sources: Personal data
Table 11. Translation of Items of Cynicism and the Factor Loadings
Original Version Adaptation Version Comments Loading Factor I feel I treat some
recipients as if they were impersonal
“object
Saya merasa bahwa saya memperlakukan beberapa klien seolah mereka objek impersonal
“impersonal object” can be replaced by “not human”
.716
I feel recipients blame me for some of their problems
Saya merasa para
pengguna menyalahkan saya atas masalah-masalah yang mereka alami
Good Item .492
I don’t really care what happens to some recipients
Saya benar-benar tidak peduli pada apa yang terjadi terhadap klien saya
Good Item .681
I’ve become more callous toward people since I took this job
Saya menjadi semakin “kaku”
terhadap orang lain sejak saya bekerja sebagai pemberi jasa
Good Item.
Is the questionnaire designed for the service field? If not, “sebagai pemberi jasa” can be omitted or replaced by
“sejak sayamendapatkan pekerjaan ini”
.743
I worry that this job is hardening me
emotionally
Saya khawatir pekerjaan ini membuat saya “dingin”
secara emosional
Good Item .618
Sources: Personal data
It can be concluded that the outcomes of the CFA, including the factor loadings on the three subscales, show that the final M-TBI scale consisted of items that work according to the three underlying constructs. Table 12. presents the comparison of the coefficients of Exploratory factor analysis of MBI items in three subscales, namely Emotional Exhaustion (EE), Personal Accomplishment (PA), and Cynicism (Cy), from several countries such as the US, Canada, UK, New Zealand, Japan, Russia, Armenia, and Indonesia. On the cynicism subscale, item #2 (become more callous toward people) was the item with the strongest factor loading in all countries. This indicates that the item had the strongest
13-21
http://journal.uinjkt.ac.id/index.php/jp3i
This is an open access article under CC-BY-SA license (https://creativecommons.org/licenses/by-sa/4.0/)
contribution to the formation of cynicism. In contrast, item #5 (feel patients blame for their problems calmly) was the item with the weakest factor loading < 0.5 in all countries, meaning that the item had a weak contribution to explaining the construct of cynicism.
Meanwhile, in the emotional exhaustion and Personal Accomplishment subscales, each country showed different results on the items that produced the strongest factor loading on the Emotional Exhaustion and Personal Accomplishment subscales. Items with high factor loading had a higher contribution to explaining the latent construct. In most of the references, a factor loading of .50 or more is considered to have relatively strong validation to explain the latent construct (Hair et al., 2009).
However, some other references (Sharma, 1996; Ferdinand, 2002) explained that the weakest factor loading that can be accepted is .40. Item # 2 (feel used up at the end of the workday) appeared as the item with the strongest factor loading in indicating Emotional Exhaustion for the US, Canada, UK, New Zealand, & Japan. Meanwhile, in Germany & Indonesia, the strongest factor loading appeared in item
#5 (feel burned out from work), while Russia in item #1 (feel emotionally drained from work) appeared as the item with the strongest factor loading. The differences in the personal accomplishment subscale were influenced by cultural factors, work characteristics, and values of each country.
14-21
http://journal.uinjkt.ac.id/index.php/jp3i This is an open access article under CC-BY-SA license (https://creativecommons.org/licenses/by-sa/4.0/)Table 12. Comparison of the Results of Exploratory Factor Analysis of MBI Items on Each Factor (Poghosyan et al., 2009) & M-TBI Emotional exhaustion (EE) subscale US Canada UK Germany New
Zeland
Japan Russia Armenia Indonesia
Feel emotionally drained from work .93 .89 .86 .72 .89 .91 .88 .73 .71
Feel used up at the end of the workday .94 .90 .88 .85 .90 .92 .80 .69 .70
Feel fatigued when get up in the morning .86 .85 .81 .67 .82 .84 .74 .80 .62
Feel like at the end of the rope .58 .58 .57 .37 .55 .67 .53 .49 .61
Feel burned out from work .77 .78 .77 .91 .75 .62 .87 .73 .76
Feel frustrated by the job .75 .69 .54 .60 .59 .37 (.36) .57 .62
Feel working too hard on the job .72 .71 .60 .62 .67 .53 [.40] .53 .67
Working with people puts too much stress (.59) (.50) (.45) .36 (.46) (.38) (.31) .40 .66 Working with patients is a strain (.60) (.54) (.50) (.42) (.46) (.44) (.63) (.51) .67 Personal Accomplishment (Acc) subscale
Can easily understand patients’ feelings .40 .42 .38 .49 .40 .56 .35 .54 .71
Deal effectively with the patients’ problems .50 .55 .47 .89 .48 .64 .51 .64 .66
Feel positively influencing people’s lives .64 .63 .57 .64 .62 .56 .62 .70 .81
Feel very energetic .46 .44 .41 .55 .36 .52 .35 .63 .70
Can easily create a relaxed atmosphere .62 .61 .59 .51 .63 .69 .74 .75 .71
Feel exhilarated after working with patients .63 .62 .58 .63 .58 .62 .80 .54 .71
Have accomplished worthwhile things in job .73 .74 .73 .67 .73 .72 .64 .60 .60
Deal with emotional problems calmly .52 .54 .53 .53 .50 .51 .48 – .69
Cynicism / Depersonalization
Treat patients as impersonal ‘‘objects’’ .61 .61 .61 .56 .62 .62 .50 .49 .71
Become more callous toward people .79 .83 .82 .75 .86 .70 .82 – .74
Worry that job is hardening emotionally .71 .72 .68 .58 .75 .62 .78 – .61
Don’t care what happens to patients .64 .65 .66 .65 .68 .56 .75 .56 .68
Feel patients blame for their problems .41 .37 .38 – .43 .49 – – .49
15-21
http://journal.uinjkt.ac.id/index.php/jp3i
This is an open access article under CC-BY-SA license (https://creativecommons.org/licenses/by-sa/4.0/) Factors affecting M-TBI
Maslach (2016) stated that burnout is influenced by a long working period. People feel bored if they have a monotonous job for a long time. At the same time, a word of caution is necessary because of the problem of survival bias: those who burn out early in their careers are likely to quit their jobs, leaving behind the survivors who consequently exhibit lower levels of burnout. Here opposite results were obtained: young people with the least work experience have the highest total score on the three subscales, as well as that a negative relation was found between age and total score. Also, secondary school teachers in Hong Kong who were younger, unmarried, without religious beliefs, less experienced, without finishing professional training, and the junior rank was more consistently burned out (Lau et al., 2005).
Although working period and age-related effects were commonly reported, here it was found that people working for a long time and are older have lower scores than those who work fewer years and that the highest scores on all three subscales and the total score were found in the group with four or less few years of work experience. This was also found in a study by Ang et al. (2016). These authors revealed that fewer years of working experience were associated with higher burnout scores. Although age and working period are confounding factors, it is obvious that the risk of getting burnout may appear nowadays early in one’s career. The combination of the outcomes of the number of years of work experience and age allows us to propose that there is a category of young people, relatively beginners in the job market, which seem to have problems adapting to their working environment and job requirements. The reasons for their problems could be diverse, among others occupational characteristics, characteristics of the organization, but also person’s circumstances (Maslach et al., 2016) such as marital status. However, a thorough analysis of the causes is beyond the scope of this article, but the high scores for the inexperienced new entrants on the job market in Indonesia deserve some caution.
The type of occupation plays a role as well in having high scores, and from Table 6. it can be inferred that front office staff showed the highest burnout scores, higher than teachers, nurses, and professionals on all three subscales. Nurses and teachers, two other job categories with a high burnout prevalence worldwide, scored intermediate, while the professional showed the least score. The relatively high scores for nurses in our study can be attributed to their high scores on the personal accomplishment scale. This is consistent with the general knowledge that nurses might be sensitive to burnout. Two recent studies among Indonesian nurses confirmed the high prevalence of burnout (Setyawati et al., 2019; Sudrajat et al., 2021). Hajar and Hudan (2018) reported that one-fourth of the nurses in a tertiary hospital were experiencing burnout, whereby almost half of them were diagnosed with burnout. The high burnout scores in nurses might be due to the environment: nurses working in university hospitals with better work environments had significantly less job dissatisfaction, intention to leave, and burnout (Khamisa, 2015).
The type of education or the level of education was negatively associated with the total burnout score.
The groups with the highest education showed the lowest scores, the persons with high school education had the highest scores for cynicism and personal accomplishment, while the bachelor's exhaustion score was highest, while their accomplishment score fitted nicely in a pattern of a negative relationship between the level of education and accomplishment. A similar education effect was found earlier as well (Abkhou
& Jenaabadi, 2015).
In all, the picture emerges that there is a group of young (≤30) people, working as front-office employees, being single, and only high school educated, who have the highest scores. The oldest group, professionals, being married, and with a master's education, had the lowest scores. So it seemed that especially for the youngest and least educated group of front office staff, the consequences of the competition to become successful in work and personal life, are accompanied by feelings of mental exhaustion, more distance to work, and experiences of less personal accomplishment, while the older, better-educated professionals seem to be a group with chances to develop burnout. Differences between generations on the three subscales and the factors mediating them have been described, and it has been proposed that younger people might more easily feel distressed and exhausted because of the different values they give toward job satisfaction (Lu & Gursoy, 2016) and lower abilities to deal with work-related stress (Shragay, D., & Tziner, A. (2011).
16-21
http://journal.uinjkt.ac.id/index.php/jp3i This is an open access article under CC-BY-SA license (https://creativecommons.org/licenses/by-sa/4.0/) Percentile scores of the M-TBIThe total and three subscale scores (Table 4) and their percentile scores, as given in Table 13, allow the identification of people that score “high”, “moderate”, and “low”. Cut-off scores were published through the third edition of the MBI Manual (published in 1996). “High”, “Moderate”, and “Low”
classifications were calculated by splitting the normative population into thirds – where a person was considered “high” in emotional exhaustion simply because they scored in the upper third percentile of the population. It needs to be emphasized that the upper third of a large population is not a definition of people experiencing severe cases of burnout. In the 4th edition of the manual (2016), cut-off scores were removed due to having too little diagnostic validity. The previously published cut-off scores were, retrospectively, considered arbitrary (Leiter & Maslach, 2016). Instead, different profiles based on latent profile analyses were proposed, acknowledging different phases of the process of burnout and different profiles. Five profiles were identified, varying from burnout (high scores on all three subscales), disengaged (high on cynicism only), ineffective (high on personal accomplishment only), overextended (high on exhaustion only), and engaged (low on all three subscales). However, the creation of profiles is beyond the scope of this article. Moreover, the theoretically proposed profiles no longer showed the commonly reported demographic effects on the subscales (Makikangas et al., 2020).
Table 13. Descriptive Statistics of the Three Subscales of the M-TBI
N Maximum Minimum Mean Std. Deviation
Exhaustion 822 54 0 19,75 10,545
Cynicism 822 28 0 6,90 6,116
Accomplishment 822 48 0 15,51 8,641
Valid N (listwise) 822 Sources: Personal data
The inventory cannot be used as an individual assessment tool for clinical diagnosis as long as there are no valid cut-off points that allow differentiation between levels of burnout. The classification of levels of burnout remains an unresolved issue in the English version as well as in the non-English versions. As, at least in some countries, the recognition and acceptance of burnout as a work-related disorder seem to grow, valid criteria are needed to classify levels of burnout. In addition, despite the criticism, cut-off points for the three subscales might help decide which intervention program is accurate (Schaufeli & van Dierendonck, 1995). Therefore and for now, we will stick to the division of the normative sample into three equally sized groups of 33.3%, assuming that the top, intermediate, and bottom thirds of the sample would experience "high," "average," and "low" levels of the subscales, and acknowledging the outcome of the profile analyses that burnout should be considered as having high scores on all three subscales, with the risk of underestimating burnout. Therefore, while considering that external validity criteria are still missing, we propose that the M-TBI can be used to identify someone with high burnout tendency.
Under the assumptions mentioned above, we propose that a participant can be categorized as burnout if he has an exhaustion score ≥ 24, a cynicism score ≥ 9, and a (reversed) accomplishment score ≥ 19. The results of categorizing scores by percentiles (33,3 and 66,6) can be seen in Table 14. By defining the probability of having or developing burnout by scores in the highest category in all three subscales, we could identify 88 individuals with burnout in our sample of 882.
Table 14. Burnout Percentile Scores for the Three Subscales as Derived from our 822 Sample MTBI
Subscale Exhaustion Cynicism Accomplishment Total
N Valid 822 822 822 822
Missing 0 0 0 0
Percentiles 33,3 14,00 3,00 11,00 32,00
66,6 24,00 9,00 19,00 50,00
Sources: Personal data
17-21
http://journal.uinjkt.ac.id/index.php/jp3i
This is an open access article under CC-BY-SA license (https://creativecommons.org/licenses/by-sa/4.0/)
Table 15. Comparison of Mean and Standard Deviation Across Countries M-TBI
N= 822
Dutch N=565
USA N=710
British N=200
Maslach N=1400 Mean SD Mean SD Mean SD Mean SD Mean SD Exhaustion 19.75 10.5 17.86 8.5 18.8 10.1 18.3 9.5 24.1 11.9 Depersonalization/
cynicism
6.9 6.1 7.35 4.29 10.5 7.9 5.9 5.1 9.4 6.9 Personal
Accomplishment 15.5 8.64 30.95 5.72 33.9 8.1 35.9 7.3 36.0 6.9 Sources: Personal data
Table 15 shows the comparison of the mean results and the standard deviations of the three subscales between the M-TBI (Indonesian), the Dutch, British, USA, and Maslach. There are only minor differences in the factor loading coefficients for each item between several countries, as can be inferred from Table 12. Under the subscale exhaustion, "Feel used up at the end of the workday" is the most contributing item to exhaustion indicator the or the US, Canada, UK, Germany, New Zealand, and Japan. For Indonesia, the item "feels working too hard on the job" refers to a situation that mostly triggers exhaustion.
There are similarities in several countries (US, Canada, UK, Germany, New Zealand, Japan, and Russia) regarding the higher factor loading of cynicism on the "become more callous toward people"
item; it is also higher than the other items. The strongest coefficient t in the cynicism subscale for Indonesians is the item “treat patients as impersonal".
Germans score high on the accomplishment item “Deal effectively with the patients' problem". For Indonesians and Russians are, "feeling exhilarated after working with patients" is the strongest accomplishment item. As for the US, Canada, UK, New Zealand, and Japanese people, the strongest coefficient of the accomplishment subscale loading factor is the item "have accomplished worthwhile things in the job". The means and SD for exhaustion and depersonalization/cynicism are more or less the same. However, there is a significant difference in the results of the aspects of personal accomplishment: M-TBI Mean = 15.5, while the Dutch, USA, UK, and the large Maslach survey data showed means from 30.95 to 36.0 (Schaufeli & van Dierendonck, 1995). These lower (reversed, so higher) personal accomplishment scores for Indonesia compared to other countries indicate that the Indonesian workforce has different characteristics and orientations. Several other factors may have caused this low score personal accomplishment score, such as a lack of constructive feedback, a lack of social support, and a lack of feeling that the skills that one is acquiring in the job are meaningful (Guenette
& Smith, 2018), a low amount of resilience, feelings of marginality and isolation (Richards et al., 2017) and poor relations on the work floor (Corbin et al., 2019).
Conclusion
The adapted M-TBI scale has a high-reliability coefficient, indicating that this burnout scale measures burnout consistently. The 22 items for Indonesia adapted M-TBI submitted to 822 participants had significant factor loadings and fit a three-factor model, as was shown by both an EFA and CFA and in agreement with the original MBI-GS. None of the items can be declared void since each item contributed to the factor loadings. Therefore, the 22 items are valid for measuring the tendency of burnout in Indonesia.
The age, years of education, and years of education showed significant effects on all subscales.
Importantly, especially young employees with only a high school diploma and with short work history seem to be the most vulnerable group. The low scores on personal accomplishment for Indonesians regardless of profession, age and education are intriguing and deserve further investigation. All these
18-21
http://journal.uinjkt.ac.id/index.php/jp3i This is an open access article under CC-BY-SA license (https://creativecommons.org/licenses/by-sa/4.0/) group differences show that the M-TBI is sensitive to demographic factors, is reliable and valid, and therefore suited to identify burnout in four categories of workers (teachers, nurses, front office staff, and professionals) in Indonesia.Conflict of Interest
There is no conflict of interest in the research. The Indonesian version scale is available by request to the corresponding author email.
References
Abkhou, T., & Jenaabadi, H. ( 2015). Comparative analysis of the relationship between job burnout and general health of male and female high school teachers in Zabol. Natural Science. 2015. 7. 391-399.
http://www.scirp.org/journal/ns http://dx.doi.org/10.4236/ns.2015.78042
Ang, S. Y., Dhaliwal, S. S., Ayre, T. C., Uthaman, T., Fong, K. Y., Tien, C. Zhou, H., & Della, P.
(2016). Demographics and personality factors associated with burnout among nurses in a Singapore Tertiary Hospital. BioMed Research International. |Article ID 6960184 | 12 pages.
http://doi.org/10.1155/2016/6960184.
Beaton, D.E., Guillemin, F. (2001). Guidelines for the process of cross-cultural adaption of self-report measures. SPINE 25 (24).3186–3191. http://doi.org/10.1097/00007632-200012150-00014
Bakker, A.B, Demerouti, E., & Schaufeli, W.B. (2002). Validation of the Maslach Burnout Inventory – general survey: an internet study. Anxiety, Stress and Coping. 15(3). 245–260.
Brown, A.T. (2015). Confirmatory factor analysis for applied research. Second edition. New York: A division of Guilford press publication Inc.
Choi, Y. G., Choi, B. J., Park, T. H., Uhm, J. Y., Lee, D. B., Chang, S. S., & Kim, S. Y. (2019). A study on the characteristics of Maslach Burnout Inventory-General Survey (MBI-GS) of workers in one electronics company. Annals of occupational and environmental medicine, 31, e29.
https://doi.org/10.35371/aoem.2019.31.e29
Chow, Y., Masiak, J., Mikołajewska, E., Mikołajewski, D., Wójcik, G.M., Wallace, B., Eugene, A., &
Olajossy, M. (2018). Limbic brain structures and burnout-A systematic review. Adv Med Sci.; 63.
192-198. http://doi.org/10.1016/j.advms.2017.11.004
Corbin, C.M., Alamos, P., Lowenstein, A.E., Downer, J.T., & Brown, J.L. (2019). The role of teacher- student relationships in predicting teachers’ accomplishment and emotional exhaustion. Journal of School Psychology; 77.1–12. https://doi.org/10.1016/j.jsp.2019.10.001.
Cudeck, R., & Browne, M.W. (1993). Alternative ways of assessing model fit. In Bollen. K.A. Scott Long J.
(Eds). Testing Structuring Equation Models. pp. 1–9. Sage: Newbury Park. CA.
Guenette, J.P., & Smith, S.E. (2018). Job resources and job demands associated with low personal accomplishment in United States Radiology Residents. Published by Elsevier Inc. on behalf of The Association of University Radiologists. https://doi.org/10.1016/j.acra.2017.12.002
Hajar, R., & Hudan, B.Z. (2018). Burnout and its associated factors among nurses in a Tertiary Hospital.
Malaysia. International Journal of Public Health and Clinical Sciences; 5: 1-13. e-ISSN: 2289-7577.
Hair, J. F., Jr., Black, W. C., Babin, B. J., & Anderson, R. E. (2009). Multivariate data analysis (7th ed.).
Upper Saddle River, NJ: Pearson Prentice Hall.
https://fk.ui.ac.id/berita/83-tenaga-kesehatan-indonesia-mengalami-burnout-syndrome-derajat- sedang-dan-berat-selama-masa-pandemi-covid-19.html
19-21
http://journal.uinjkt.ac.id/index.php/jp3i
This is an open access article under CC-BY-SA license (https://creativecommons.org/licenses/by-sa/4.0/)
Hu, L.T., & Bentler, P.M. (1999) Cut-off criteria for fit indexes in covariance structure analysis:
Conventional criteria versus new alternatives. Structural Equation Modeling: A Multidisciplinary Journal. 6(1) 1-55. http://doi.org/10.1080/10705519909540118
Kelley, K., & Lai, K. (2011). Accuracy in parameter estimation for the root mean square error of approximation: Sample size planning for narrow confidence intervals. Multivariate Behavioral Research. 46(1). 1-32. http://doi.org/10.1080/00273171.2011.543027
Khamisa, N., Oldenburg, B., Peltzer, K., & Ilic, D. (2015). Work-related burnout: Job satisfaction and general health of nurses. Int. J. Environ. Res. Public Health; 12.652-666;
http//doi.org/10.3390/ijerph120100652.
Lau, P.S.Y., Yuen, M.T., & Chan, R.M.C. (2005). Do demographic characteristics make a difference to burnout among Hongkong secondary school teachers? Social Indicators Research. 71. 491–516.
Leiter, M.P., & Maslach, C. (2016). Latent burnout profiles: A new approach to understanding the burnout experience. Burnout Research 3. 89-100.
Leech, N. L., Onwuegbuzie, A. J., & O’Conner, R. (2011). Assessing Internal Consistency in Counseling Research. Counseling Outcome Research and Evaluation, 2(2), 115–
125. https://doi.org/10.1177/2150137811414873
Loera, B., Converso, D., & Viotti, S. (2014) Evaluating the psychometric properties of the Maslach Burnout Inventory-Human Services Survey (MBI-HSS) among Italian nurses: how many factors must a researcher consider? PLoS One. Dec 12;9(12):e114987. do.
http://doi.org/10.1371/journal.pone.0114987.
Lo, D., Wu, F., Chan, M., Chu, R., & Li, D. (2018). A Systematic review of burnout among doctors in China: a cultural perspective. Asia Pac Fam Med. 17:3 https://doi.org/10.1186/s12930-018-0040-3 Lu, A. C. C., & Gursoy, D. (2016). Impact of Job Burnout on Satisfaction and Turnover Intention: Do Generational Differences Matter? Journal of Hospitality & Tourism Research, 40(2), 210–
235. https://doi.org/10.1177/1096348013495696
Maslach, C., & Jackson, S.E. (1986). Maslach burnout inventory manual (2nd ed.). Palo Alto. CA:
Consulting Psychologists Press.
Maslach, C., & Schaufeli, W.B. (1993). Historical and conceptual development of burnout. In: Professional burnout: Recent developments in theory and research. Philadelphia. PA: Taylor & Francis
Maslach, C., Jackson, S.E., & Leiter, M.P. (1996). Maslach Burnout Inventory Manual (3rd edition). Menlo Park. CA: Mind Garden.
Maslach, C., & Leiter, M.P. (1997). The Truth about Burnout: How organizations cause personal stress and what to do about it. San Francisco. CA: Jossey-Bass.
Maslach, C., Schaufeli, W.B., & Leiter, M.P. (2001). Job Burnout. Annual Review of Psychology. 52. 397- 422.
Maslach, C., & Leiter, M. P. (2016). Understanding the burnout experience: recent research and its implications for psychiatry. World psychiatry : official journal of the World Psychiatric Association (WPA), 15(2), 103–111. https://doi.org/10.1002/wps.20311
Mäkikangas, A., Leiter, M.P., Kinnunen, U., & Feldt, T. (2020). Profiling development of burnout over eight years: relation with job demands and resources. European Journal of Work and Organizational Psychology https://doi.org/10.1080/1359432X.2020.1790651.
Mateji’c, B., Milenovi’c, M., Tepavcevi’c, D.K., Simi’c, D., Pekmezovi’c, T., & Worley, J.A. (2015).
Psychometric properties of the Serbian version of the Maslach Burnout Inventory-Human Services