I thank Ross for impressing upon me the importance of the problems facing our environment and for introducing me to the field of atmospheric chemistry. In the first part of the diploma thesis, we describe attempts to measure the absolute photoionization cross sections of chlorine monoxide (ClO) and chlorine dioxide (ClOOCl).
Introduction Introduction
In Chapters 3 and 4, we present studies measuring the kinetics of organic peroxy radicals of interest to the troposphere using both CRDS and MPIMS. Similarly, little is known about the reactivity of organic peroxy radicals under humid conditions, which occur throughout the troposphere.
Absolute Photoionization Cross Sections of ClO and ClOOCl
Introduction
The ability of PIMS to sensitively measure small Δ[ClO] and Δ[ClOOCl] depends on the size of the ClO and ClOOCl photoionization cross sections. The inner surface of the inner tube was coated with a halocarbon wax to mitigate weight loss.
Results
- Absolute Photoionization Cross Sections of CH 3 Br
- Relative Photoionization Spectra of ClO and ClOOCl
- Absolute Photoionization Cross Sections of ClO and ClOOCl
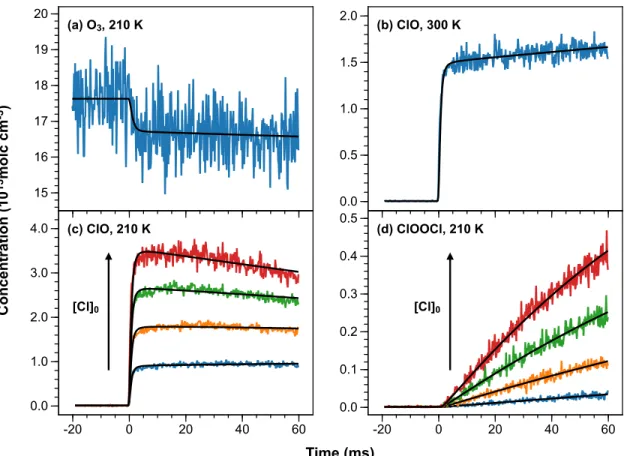
In addition to these chemical processes, we also included first-order rate constants to describe the heterogeneous loss of ClO and ClOOCl from the walls of the reactor in the 210 K model. Both instrument effects are well described by the model (Supplementary Material SM3). In the absence of a photolysis gradient, the model predicts that the 300 K ClO+ signal would have a weak negative slope and that the decay of the 210 K ClO+ signals would appear more pronounced.) The ClOOCl kinetics also show excellent agreement with the model.
Discussion
- ClO Photoionization
- ClOOCl Photoionization
This does not agree with the 𝑘2 value fitted from our data and was therefore not used in our cross-sectional analysis. We suggest that the daughter ion in our experiment also has the OClO+ structure, but is formed by dissociative photoionization of the ClOOCl isomer.
Conclusions
A second daughter ion of ClOOCl photoionization, ClO+, has previously been observed with an AE of eV.33 However, in our 210 K experiments only a small fraction of the ClO dimerizes over the observation time scale and [ClO] is in excess over [ ClOOCl]. Agreement of the spectra holds for all energies, especially those above 11.52 eV (Supplementary Material SM5).
Figures
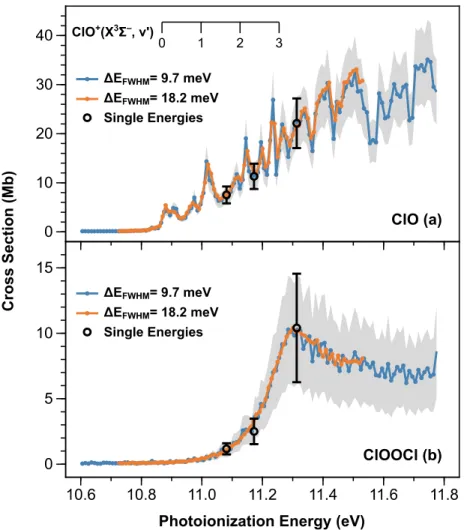
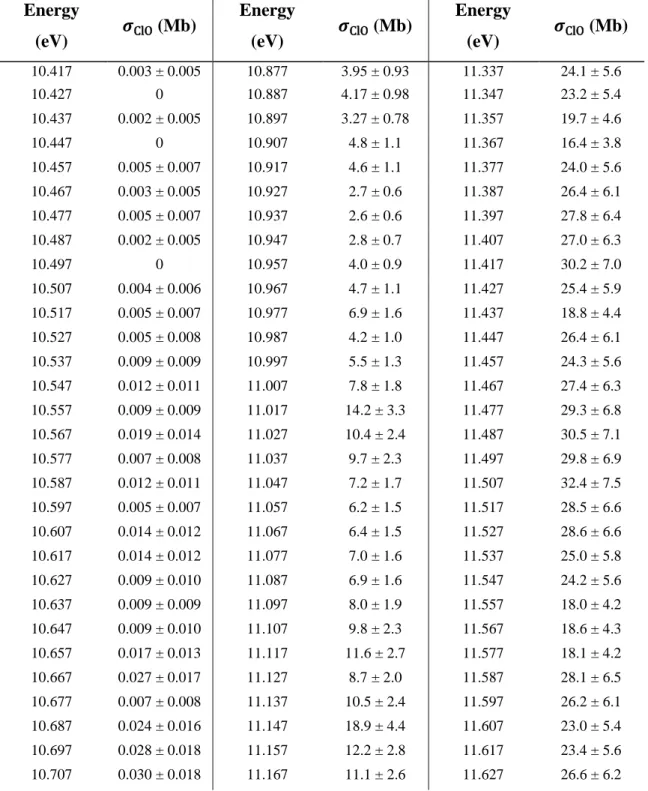
The vibrational steps (X3Σ–, 𝑣′ ← X2Π3/2, 𝑣 = 0) measured in the photoelectron spectroscopy study of Bulgin et al. are superimposed for reference.31 Uncertainties in 𝜎ClO are typically ±23% and limited by the systematic uncertainties associated with the CH3Br reference cross sections. Uncertainties in 𝜎ClOOCl are typically ±39% and limited by the systematic uncertainties associated with the CH3Br reference cross sections and the value of the ClO dimerization rate constant under these conditions.
Tables
Photoionization mass spectrometry and modeling studies of the chemistry of fuel-rich dimethyl ether flames. Studies of the reactions of excited oxygen atoms and molecules produced in the flash photolysis of ozone.
Supplementary Material
SM1 Energy Resolution Calibration
The ionization continuum was fitted as a linear or quadratic baseline and was subtracted for clarity. The spectrum at 45 µm was fitted with a Lorentzian, the spectra at 250 and 425 µm were fitted with a Gaussian, and the spectrum at 600 µm was fitted with a piecewise linear function. The linear function was used to estimate 𝛥𝐸FWHM for experiments performed at slit widths for which a Xe spectrum was not measured.
SM2 Mass Discrimination Factor Calibration
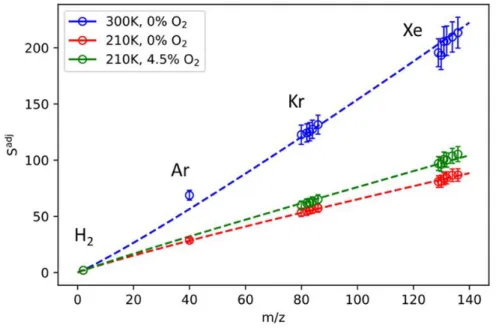
Two-parameter weighted fits of 𝑆𝑖adj as a function of 𝑚𝑖 allow the optimal value of 𝛽 to be determined. It is observed that the value of 𝛽 varies as a function of the temperature, pressure, and bath gas composition in the reactor. The resulting 𝑆𝑖adj as a function 𝑚𝑖 are plotted in Figure S2, where the 𝑆𝑖adj are normalized by the fitted value of Λ, so that the difference of the fitted 𝛽 between each series can be visualized.
Each data set and corresponding fit has been normalized by the fitted value of Λ so that differences in 𝛽 can be assessed.
SM3 Modeling and Calibration of Instrument Effects
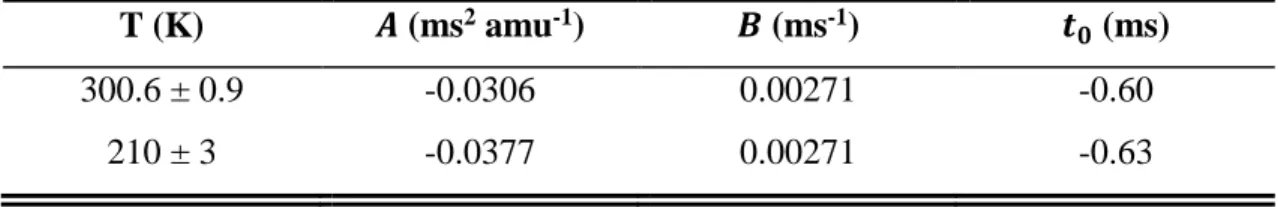
Species sampled from a molecular beam have a velocity distribution that has been shown to approximate a Maxwell-Boltzmann distribution.7 The distribution depends on mass, with species with higher mass having a wider velocity distribution than those with lower mass. After these profiles are convolved with the instrument time response (Eq. 3), the model time axis is shifted by 𝑡0 so that photolysis occurs at 𝑡 = 𝑡0, which is in correct agreement with the data time axis. The initial concentration gradient of the radicals in these experiments derives exclusively from the divergence of the photolysis beam.
The fitted value of 𝐵 = 0.00271 ms-1 corresponds to an initial radical concentration gradient arising solely from divergence of the photolysis beam.
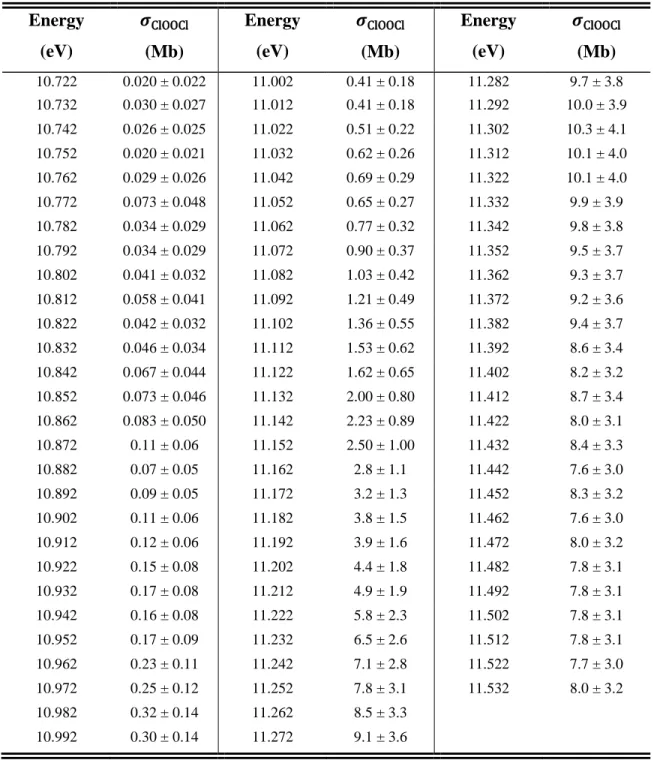
SM4 Tabulated Cross Sections
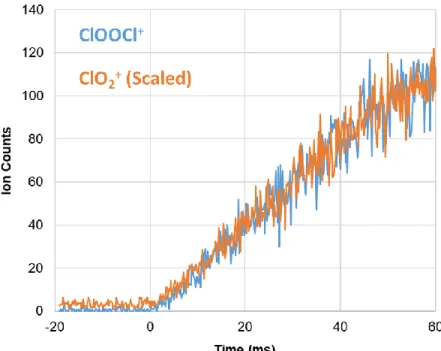
These values are obtained by scaling a relative spectrum recorded with 𝛥𝐸FWHM = 9.7 meV at 210 K to the single energy cross sections reported in Table 3 of the main text. These values are obtained by scaling a relative spectrum recorded with 𝛥𝐸FWHM = 18.2 meV at 210 K to the single energy cross sections reported in Table 3 of the main text. The similarity of the kinetics supports the theory that ClO2+ originates from dissociative ionization of ClOOCl.
Accurate measurements of the total photoionization cross sections of He, Ne, Ar, Kr and Xe.
Kinetics of Chlorine-Substituted Peroxy Radicals
Introduction
- Low NO x Oxidation of Ethene
- High NO x Oxidation of Alkenes
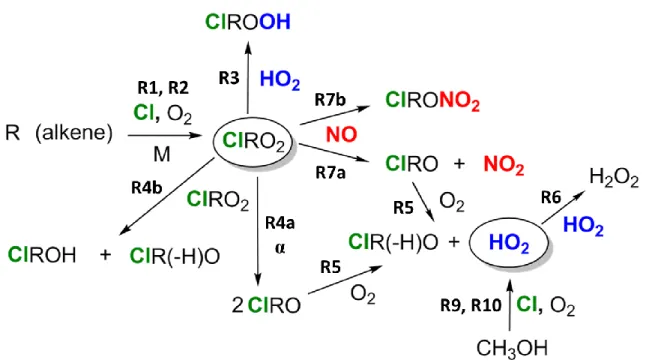
This approach has previously been used to study analogous reactions of the ethyl peroxy radical.14 We choose to probe β-CEP and HO2. In addition to RO isomerization and decomposition, OH from R8 can yield secondary RO2 by oxidation of excess VOC to form hydroxyl-substituted RO2 (HORO2). However, since all ClRO2 isomers formed from the Cl-initiated oxidation of a VOC precursor have the same mass, no differences in chemical structure could be assessed with their technique.
A schematic overview of the oxidations and peroxy radical reactions investigated in this work is presented in Figure 1.
Experimental Methods
- Pulsed Cavity Ringdown Spectrometer
- Calibration of the Initial Radical Concentration
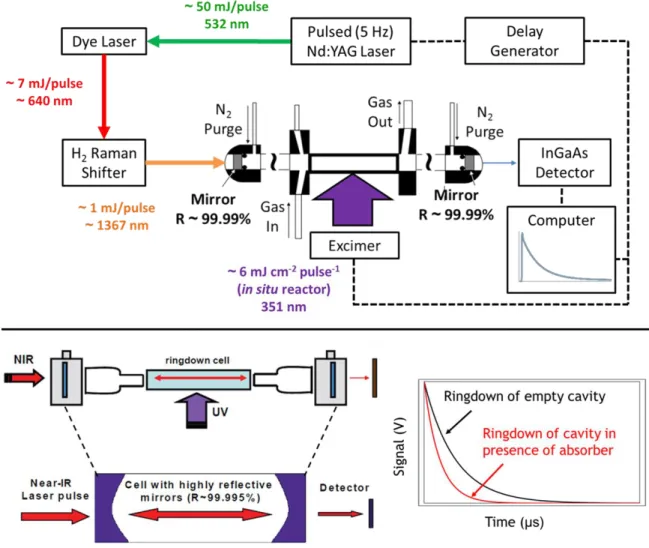
The near-IR spectrometer used in this work for pulsed CRDS absorption measurements has been described previously.23,24 A schematic of the instrument is presented in Figure 2. The UV beam was expanded (~6 mJ cm-2 flow in the reactor) and propagated orthogonally to the axis of the optical cavity through two quartz windows mounted on the sides of the ring cell. A digital delay generator synchronized the firing of the Nd:YAG and excimer laser pulses and established a time axis for kinetic measurements.
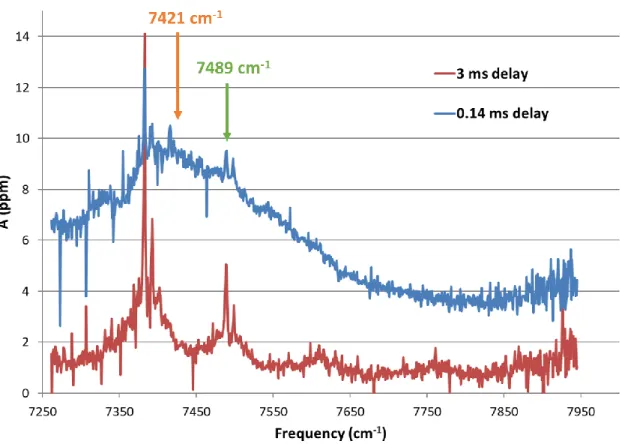
The spectrum measured with a 35 ms delay was recorded after many half-lives of the self-response and represents H2O2 only.
Results & Discussion
- Formation Rate Constant of β-Chloroethyl Peroxy
- Reaction of Chlorine-Substituted Peroxy Radicals with NO
The constant 𝛾 in this term is equal to the ratio of the cross section of β-CEP at. Due to the lifetime of the peroxy radicals in milliseconds, the use of SKaR in the data analysis was not necessary. Definitive assignments of the absorption bands in the near-IR spectrum arising from the Cl-initiated oxidation of propylene have not been firmly established.
Due to the complexity of the resulting near-IR spectrum (numerous peroxy radicals and conformers), the assignment of absorption bands was not established.
Conclusions
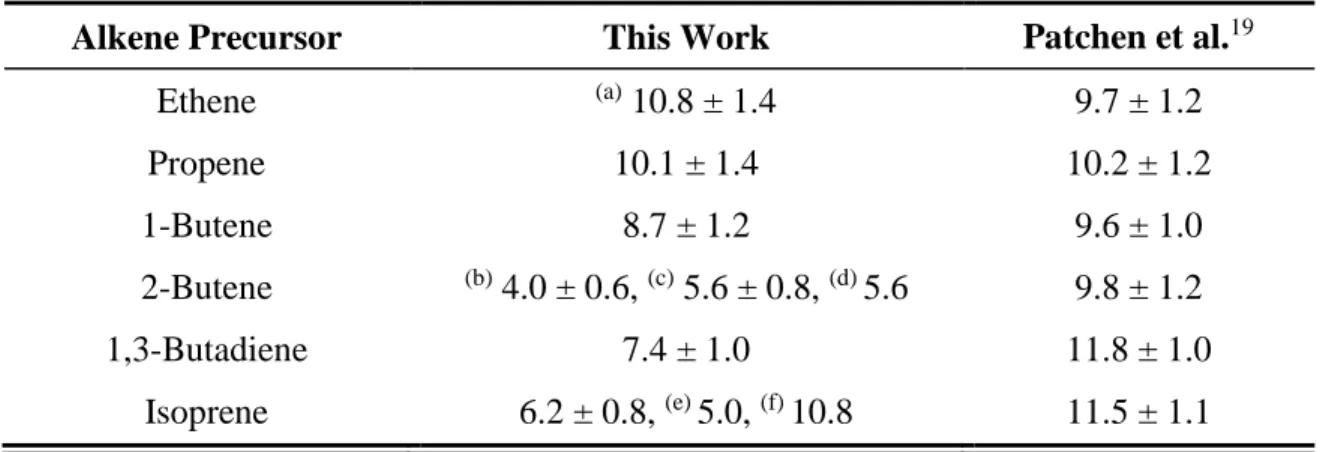
We also measured the rate constant and branching ratio of the β-CEP self-reaction in the second part of the chapter. Finally, in the last part of the chapter we present rate constant measurements for the reactions between NO and peroxy radicals formed in the Cl-initiated oxidation of ethene, propene, 1-butene, 2-butene, 1,3-butadiene, and isoprene . Overall, our experiments have shown that cavity spectroscopy can be a powerful technique in studying the organic kinetics of peroxy radicals through the detection of the near-IR RO2 𝐴̃ ← 𝑋̃ transition.
The magnitude of the small positive intercept is consistent with the [O2] background expected in the reactor from the base pressure and atmospheric O2 mixing ratio.
Tables
A Flash Photolysis Investigation of UV Absorption Spectra and Self-Reaction Kinetics of Gas-Phase CH2ClCH2O2 Radicals. Kinetic measurements of the C2H5O2 radical using time-resolved cavity ring-down spectroscopy with a continuous source. Measurements of Absolute Absorption Cross Sections of the Ã←X̃ Transition in Organic Peroxy Radicals by Dual-Wavelength Cavity Ring-Down Spectroscopy.
Rovibronic Bands of the Ã←X̃ Transition of CH3OO and CD3OO Detected with Cavity Ringdown Absorption near 1.2–1.4μm.
Water Vapor Dependence of the β-Hydroxyethyl Peroxy Self Reaction
Introduction
The hydroxyl radical is the atmosphere's most important detergent, oxidizing volatile organic compounds (VOCs) through either hydrogen extraction or addition over a carbon-carbon double bond. Despite the prevalence of water vapor throughout the troposphere, the influence of humidity on the reactions of organic peroxy radicals has not been the subject of widespread investigation. The self-reaction of methylperoxy and its reaction with HO2 have been studied, but a negligible dependence on humidity was observed.3 In contrast, the self-reaction rate of inorganic HO2 has consistently been shown to be strongly dependent on water vapor concentration.4-10.
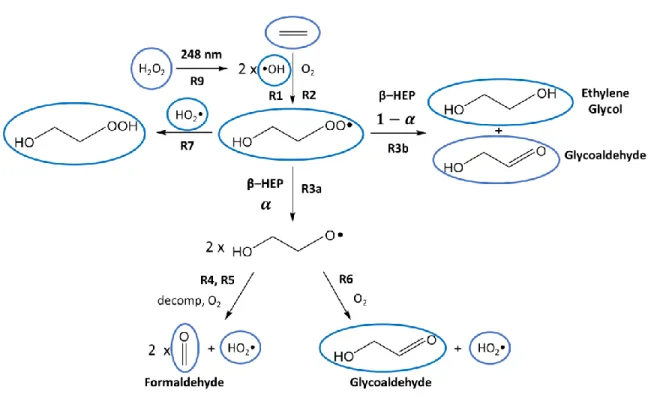
The self-reaction of organic peroxy radicals can proceed through radical-propagating (R3a) or radical-terminating (R3b) channels.
HOCH2CH2O + M → HCHO + CH2OH + M (R4) R4 can also occur as a fast rather than thermal process if the RO radical is produced. 145 R3a is, however, more thermalized, and therefore rapid decomposition is less important in the case of the self-reaction. HOCH2CH2O + O2 → HOCH2CHO + HO2 (R6) Glycolaldehyde, a stable product, is generated from both the radical propagation and.
- Experimental Methods
- Results & Discussion
- Initial Radical Concentration
- Vinyl Alcohol Yield
- Observed Self Reaction Rate Constant
- Branching Fraction
- Fate of the Alkoxy Radical
- Figures
- References
The reactor temperature was set at T = 26.6 °C (room temperature experiments) or T = 3.6 °C (low temperature experiments). As discussed in the introduction, the fate of alkoxy radicals is either reaction with O2. We have also studied the fate of the alkoxy radical produced by the radical propagation channel.
Water vapor dependence of the kinetics of the self-reaction of HO2 in the gas phase.
Implementation of Simultaneous Kinetics and Ringdown
Therefore, a turn-off ratio measured at any arbitrary delay time differs from the turn-off ratio measured at the earliest delay time by two constant factors: (1) the initial intensities of the turn-offs and (2) how the absorption evolved between the two delay times. At each step, the mean variance is weighted to ensure that each point in 𝑅1(𝑡) is biased towards the subtraction ratio with the least uncertainty. The proposed method improves on the original SKaR technique by taking advantage of the high signal to noise exhibited by 𝑅𝑖(𝑡) immediately after 𝑡𝑑𝑖.
Finally, the modified method allows SKaR to be used in experiments where the turn-off time is shorter than the kinetic lifetime, but the decay with kinetics is still non-exponential.
Kinetics and Spectroscopy of the Acetonyl Peroxy Radical
Preliminary Study
- Ozone
- Glycoaldehyde
The absolute photoionization cross sections of ozone were determined relative to the known cross sections of xenon.4 According to the literature, the cross sections were reported to have an accuracy of ±3%, which we assume represents ±2 standard errors. The absolute photoionization cross sections of glycoaldehyde were determined relative to the known cross sections of propene.5 The literature cross sections are estimated to have an accuracy of ±20% (±2σ). The absolute photoionization spectrum of glycoaldehyde is plotted in Figure 2 and tabulated in Table 3. The recommended cross sections are the average of two scans that gave values that agree within ~12%.
Single energy cross sections were determined relative to known xenon cross sections.