Korespondensi Jurnal
Judul Artikel : Quality analysis of quality control system in work units based on the Routine Data Quality Assessment of X Hospital in Semarang District
Nama Penulis : Endang Fatmawati, Farid Agushybana (Koresponden), Septo Pawelas Arso Kode Naskah : C-15
Nama Jurnal : Public Health and Preventive Medicine Archive (PHPMA) Penerbit : Public Health Postgraduate Program, Universitas Udayana
No. Kegiatan Tanggal Keterangan
1. Submit artikel 8 Juni 2020 Sistem Jurnal PHPMA
2. Revisi Reviewer A 27 Agustus 2020 Catatan revisi dari editor jurnal ke penulis
3. Revisi Reviewer B 19 Oktober 2020 Catatan revisi dari editor jurnal ke penulis
4. Terbit 1 Desember 2020 Sistem Jurnal PHPMA
Submit Artikel
Quality Analysis of Quality Control System in Work Units Based on the Routine Data Quality Assessment of X Hospital in Semarang
District
Endang Fatmawati1, Farid Agushybana2, Septo Pawelas Arso3
1Dr Kariadi General Hospital, Semarang, Indonesia
2.3 Master of Public Health, Faculty of Public Health, Diponegoro University, Semarang, Indonesia
*Correspondence to: Farid Agushybana, Master of Public Health, Faculty of Public Health, Diponegoro University, Semarang, Indonesia
(agushybana@gmail.com)
ABSTRACT
Background: An excellent process of hospital quality management system produces useful data for the management in the future decision-making. The problem obtained from the quality management system of X hospital was that the data collector does not understand the procedure of data collection, thus the data became less complete and less accurate. Routine Data Quality Assessment (RDQA) instrument is recommended to measure the data quality.
Objective: This study aims to analyze the data quality in the quality management system of X Hospital work unit in Semarang.
Methods: Quantitative method was applied in this study using cross-sectional approach. RDQA instrument was used in the present study, which is a model of quality assessment of routine data that can be implemented to evaluate the quality of the collected data. The indicators assessed in this study are indicator 2, 3 and 5. Indicator 2 concerns about the the guidelines of data collection and reporting. Indicator 3 concerns about the collection of reporting data and tools. Indicator 5 concerns about the dissemination of the report results. Purposive sampling was used in the data selection. This study involved 22 quality managers at level I (the wards) as the informants who conducted the data selection. Three quality managers at level II were involved as data collectors.
A quality manager at level III as a data center. The data were analyzed both quantitatively and qualitatively. The work units assessed in this study include the outpatient unit, inpatient unit and intensive care unit.
Findings: Adaptation of RDQA instrument was conducted by adjusting the substance of RDQA with the standards of hospital accreditation in Indonesia. The development of indicator II focused on the understanding of data collection. Indicator III focused on the supervision of data collection.
While indicator V focused on the staff understanding on the recommendation of quality achievement results. The application of RDQA instrument was able to identify the systems that had yet to be operated optimally, including the lack of understanding of the data collection procedure, non optimal supervision of quality management, not all quality manager conduct data verification properly, not all staff understand the recommendations of the quality achievement results. The highest percentage of the data quality was 93% and the lowest was 72%. In general, the system assessment was in the yellow category with a score of 1.5 - 2.5 which indicated that the data were partially complete/ available/ operated.
Conclusion: RDQA instrument can be applied to measure the data quality on the hospital quality management system and is able to identify a system that has yet to operate optimally.
Keywords: Quality, RDQA, Quality Management System
INTRODUCTION
Changes on the health care management encourage hospitals to prepare advancement measures in order to improve the quality and ensure patient safety.1 Quality program is developed in a planned, targeted, intensive, effective and efficient way to bring an impact on the improvement of all aspects of the health services. A study conducted by Braithwaite et al. (2020) showed that all hospital managers developed systems as the strategy for performance monitoring, incidents recording and reporting. The study found that the developed system did not show any indication of better success in the provision of health services.2 The success of hospitals quality management in Indonesia is manifested by the success of the hospitals accreditation implementation. However, most hospitals require great effort in the preparation process, and it shows that the quality activities have yet to be the culture of the day to day work. X Hospital in Semarang is a vertical referral hospital that provides complex sub-specialist services. X Hospital establishes a system of quality management as the monitoring and evaluation measures in the implementation of health services.
The quality improvement measures are managed using a quality management system. The developed system produces data as an information for the management in evaluating the program.
Accurate data are valuable information and affect the accuracy in decision-making.
Quality management system is developed with 3 (three) levels of quality manager. Each level has continuous role in the quality improvement. The first level plays a role as the first key of success in data collection to obtain accurate data. The second level is the installation or the work unit as the second key of success, with a job of collecting data from the first level and conducting data verification. The third level is Planning and Evaluation (PE) Department as a data center.3
Management evaluates the services directly with management round. Chief of management directly observes the implementation of the quality management system and it was found to be not in accordance with the information or data of the reported achievements results. The results of the evaluation of quality management showed that there were errors in recording, errors in transcription, errors in sampling, errors in inputing the data and incomplete data report.
Improvement measures were prepared by the Committee of Quality and Patient Safety by organizing workshop in June 2019 for 755 data collector officers in X hospital.3 Participants brought their own guidelines of data collection that become their responsibility. Comprehensively identifying the understanding of the staffs in collecting the data. The results of the workshop showed that 2.9% of 755 participants understand the procedure of data collection properly. It became the foundation for the management to improve the quality management system by optimizing the tiered supervision for the quality manager.
Management ensures the accuracy of data quality using the data validation. However, data validation could only detect the accuracy of the achievement results, and was not used to assess the quality management system.3 Assessment of the data quality can be conducted using Routine Data Quality Assessment (RDQA) instrument. Previous studies on the data quality recommended RDQA to be used as an assessment instrument.4 RDQA is an instrument of data quality assessment developed by UNICEF. RDQA is used by the World Health Organization (WHO) for monitoring
the quality of data on tuberculosis (TB) in the national program “Stop TB. RDQA instrument can be used to assess the accuracy of the data and assess the quality management system.5 RDQA Instruments are able to identify the weaknesses in the quality management. RDQA is also equipped with a table of assessment review that can be automatically interpreted according to the category of assessment. Therefore, the researchers are interested in conducting a study using RDQA instrument in X hospital. This study aims to analyze the data quality in the quality management system of X Hospital work unit in Semarang.
RESEARCH METHODS
Quantitative research method was applied in this study by using cross-sectional approach.
RDQA instrument was used in this study, that is a model of quality assessment of routine data that can be implemented to evaluate the quality of the collected data. RDQA instrument consists of data verification and system evaluation. First, the data verification is applied to confirm the accuracy of data that includes review of the document, report of the calculation results and validation of the report results with the data source. The second assessment system is collecting evidence to obtain the characteristics of staffs in carrying out the duties which consists of 5 indicators: (1)Structure, Functions and Capabilities of Monitoring and Evaluation (M&E): make sure the quality managers understand their duties, (2)Guidelines of Data Collection and Reporting:
examine the availability of guidelines, (3) Collection of Reporting Data and Tools: Ensure the standard of the applied format, (4) Data Management Processes: ensure the availability of monitoring of the data quality, (5) Dissemination of the report results: ensure a further management of the quality achievements results.
RDQA instrument is equipped with a table of assessment review of the data management and reporting system. Assessment score will be automatically filled in the table and the color changes according to the category. Score of <1.5 is the red category which represents the data that are not complete or not available or not operated. Score of 1.5 – 2.5 is the yellow category which implies that the data are partially (complete/ available/ operated). Score of 2.5 - 3.0 is the green category which indicates that the data are complete/ available/ operated. The final result automatically presents the means of assessment.
The indicators assessed in this study are indicator 2, 3 and 5. The details of those indicators are described as follows; indicator 2 is the guidelines in selecting the data and reporting: identify the staff understanding on the data collection; indicator 3 is the collection of reporting data and tools: identify the activities of quality managers in conducting supervision; and indicator 5 is dissemination of the report results: identify the activities of returning information on the quality achievement results to the staffs.
The present study involved informants from three levels of quality management system. The first level consists of 22 people (16 Persons in Charge (PIC) of the data and 6 head of divisions), the second level consists of three persons in charge of the installation quality, and the third level consists of one quality manager in the data center division. There were 16 persons who select the data (PIC of the Data) in the first level quality manager. Three PIC of the data were selected from intensive care unit, six PIC of the data were selected from inpatient unit, and six PIC of the data were selected from outpatient unit. In addition to the PIC of the quality data, there were six head of divisions with an important role as the quality manager in the first level. The head of division consisted of two head of divisions of critical units (the ICU ward and the HCU ward), where the head of the ICU ward became the PIC of the data at the same time; two head of divisions of
inpatient units, Ward A and Ward B; and two heads of divisions of outpatient units, Merpati Ward at Ground Floor and Merpati Ward at First Floor. The head of divisions were responsible to conduct monitoring and evaluation of the data collection carried out by the PIC of the quality data.
The second level quality manager comprised of three persons in charge (PIC) of work unit quality. One of them was responsible for the quality of intensive care unit, another one was responsible for the quality of inpatient unit, and the last one was responsible for the quality of outpatient unit. The second level quality manager held a responsibility as the collector of medium data. Quality data delivered by the head of divisions on the first level were collected, recorded, verified and analyzed before being recommended.
The third level quality manager consisted of one head of sub-division of the evaluation in the data center division. The quality manager in the third level held responsibilities to collect the central data derived from the second level, and to verify the collected data. Purposive sampling was used to select samples of the present study.
Meanwhile, structured interview was applied as the data collection method in this study toward the quality manager of the quality management system as the subjects of the study. A list of questions adopted from the developed interview guide of RDQA instrument was used by the researchers. The interview guide contained 32 questions at level I and level II, and 33 questions at level III.
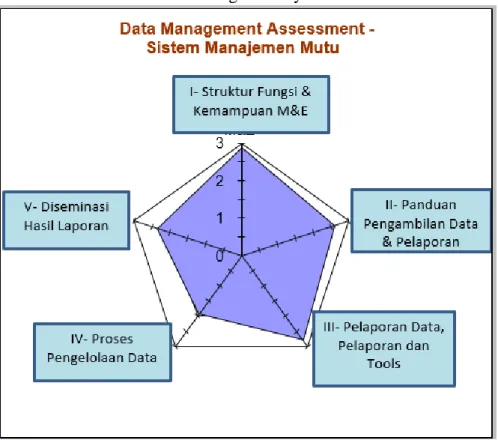
Quantitative method was used for the analysis technique in the present study. Quantitative method is presented in a form of spider chart and bar graph, and the graph shows the output of RDQA application.7 Spider chart presents the qualitative data of the conclusion of the assessment system. The higher the achievement score, the higher the performance of the system. Low achievement is used for a priority of improvement area. Bar graph depicts the quantitative data
containing the conclusion of the data verification. The higher the bar, the higher the accuracy of the data. This achievement is used to plan the improvement of the data quality.
FINDINGS
A. Profile of the Hospital
X Hospital holds a role as the national referral hospital. X Hospital has 1039 bed capacity with 4654 staffs. X Hospital has 4 featured services, including the integrated cardiac services, integrated oncology, organs transplant, and minimally invasive surgery service. The average of inpatients is 800 patients per day, and outpatient visits is 1500 people per day.
B. Adaptation of RDQA Instrument
Adaptation of RDQA instrument was made to adjust the substance of RDQA with the standards of hospital accreditation in Indonesia. RDQA instrument was developed based on the hospital accreditation standards. The researchers along with the chairman of the committee on the quality, the quality team, and the accreditation team conducted a brainstorming. This development also involved the assessment team that helped the researchers in collecting research data, thus possessed a good understanding of the RDQA instrument. The result of the RDQA instrument development was used to assess the quality of the quality management system based on the hospital accreditation standards, on the standards of quality improvement and patient safety (Peningkatan Mutu Dan Keselamatan Pasien-PMKP).
PMKP 2.1,PKMP 3, PMKP 4 and PMKP 8 standards mention that in managing the quality data, the hospital needs a support from the information technology which includes the collection, report, analysis, validation, and publication of the data for hospital's internal and external parties. Quality training needs to be provided for the quality manager to ensure the
understanding in data collection. PMKP 7, PMKP 7.1, and PMKP 11 mention that in managing the data, a supervision, analysis, and management need to be conducted using data management system which includes the collection, report, analysis, feedback, and publication.
1. The design of RDQA instrument development
The first RDQA component is in accordance with the quality improvement programs of the hospital. The development formulated on the indicator II (guide in collecting the data and reporting) emphasized on the understanding of data collection based on the indicator profile as a guide of data collection on the quality management system of X Hospital to improve the reporting quality. The development was made on the following question items : (1) Is there a profile of quality indicator, (2) Do the officers understand the profile of quality indicator, (3) How are the flow of reporting, to whom the reports should be sent, and (4) when is the report submitted.
Development on indicator III (collection of reporting data and tool) emphasized in assisting the quality manager of those in the lower level during the data collection, which aimed to improve the reporting quality. Development was implemented on the following question items : (1) data collection was in accordance with the profile of indicators, (2) data collection on the source documents had been quite accurate to measure the indicators, (3) standard reporting instruments/ forms were used consistently, (4) relevant source documents and reporting forms, and conduct a supervision
The development of indicator V (dissemination of the results of the report) emphasized on the efforts of the quality manager in providing information on the results of achievement to those in the lower level as a measure for the further improvement. The development was applied on the following question items: (1) dissemination schedule,
(2) materials of dissemination are relevant at each level, (3) there is an invitation of attendance notes, (4) the officers understand the follow-up plan of dissemination results.
2. Application of RDQA instrument
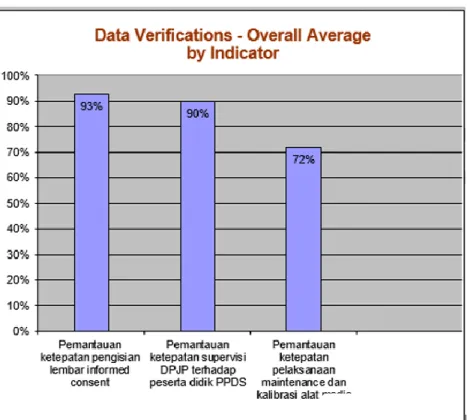
Assessment of data quality using the data of quality achievement was conducted in November 2019. The data were obtained from the measurement results of the indicator on the monitoring of accuracy in the completion of informed consent forms, indicator on the monitoring of accuracy in the supervision of DPJP (Dokter Penanggung Jawab Pasien/ Doctor in Charge) to the PPDS (Program Pendidikan Dokter Spesialis/ Specialist Doctor Education Program) students, and indicator on the monitoring of accuracy in the maintenance and calibration of medical equipment. There were no constraints in the application of the instrument due to the instrument had been developed according to the quality program requirements in the hospital.
3. Quantitative Approach
Figure 1 and 2 show the highest achievement of the data is in the first indicator, the compliance in completing the informed consent forms (83%). The lowest achievement of the data is in the third indicator, maintenance of medical equipment calibration (72%).
The three data obtained have yet to reach 100%. It showed that the data accuracy was not optimal. The data with the lowest results were used to improve data management. From the obtained results, several were found to be different from the guidelines of data collection. It happened due to the manager perceived that managing the data manually was difficult, thus resulting in the duplicate data.
Figure 1. Global statistic of the dashboard of the data quality in the work unit management system
Figure 2. Global Dashboard of System Assessment
4. Data Management Quality
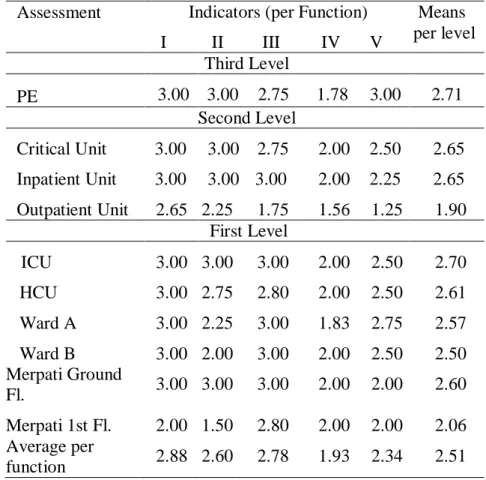
The result of the data management assessment and the assessment system is shown in a form of table of the data management assessment and the assessment system review.
Table 1. Review of data management assessment and the assessment system Assessment Indicators (per Function) Means
per level I II III IV V
Third Level
PE 3.00 3.00 2.75 1.78 3.00 2.71 Second Level
Critical Unit 3.00 3.00 2.75 2.00 2.50 2.65 Inpatient Unit 3.00 3.00 3.00 2.00 2.25 2.65 Outpatient Unit 2.65 2.25 1.75 1.56 1.25 1.90
First Level
ICU 3.00 3.00 3.00 2.00 2.50 2.70 HCU 3.00 2.75 2.80 2.00 2.50 2.61 Ward A 3.00 2.25 3.00 1.83 2.75 2.57 Ward B 3.00 2.00 3.00 2.00 2.50 2.50 Merpati Ground
Fl. 3.00 3.00 3.00 2.00 2.00 2.60
Merpati 1st Fl. 2.00 1.50 2.80 2.00 2.00 2.06 Average per
function 2.88 2.60 2.78 1.93 2.34 2.51
On the system assessment, around 60% were included in the green category, and 40% others in the yellow category. The average assessment of the overall level of quality management system on the indicator IV, the process of data management, was in the yellow category with the mean of 1.93. On the indicator V, the dissemination of report results, a mean of 2,34 was obtained that made it included in the yellow category, and the second level (outpatient installation) indicated that the lowest quality was in the score of 1.25, and included in the red category. The overall
assessment of the system was in the yellow category with a score of 1.5-2.5 which indicated that the data were partially complete/ available/ operated.
DISCUSSION
On the development of RDQA instrument in indicator II (manual data retrieval and reporting), This study found that the understanding on the data collection based on the guideline of data collection is crucial. It aimed to make the data on the achievement results to be a real information for the stakeholders for further decision-making purposes. This finding is in line with the findings of a study conducted by Ni Putu (2014) that an understanding on the standard and utilization of system significantly affects the report quality.7 Similarly, a study conducted by Sri E (2019) found that the knowledge of the coder on the codification of the disease diagnosis is the factor that contributes the most in the accuracy of codefication of the diseasse diagnosis.8
On the development of indicator III (collection of reporting data and tools), it was found that quality manager assistance to those in the lower level in the data collection is crucial with the objective of improving the quality of the data. This finding is in accordance with the study conducted by Sulistia (2018) that monitoring and evaluation significantly affect the quality of reporting.9
In the development of indicator V (dissemination of the results of the report), it was found that the efforts of the quality manager in providing information on the results of achievement to those in the lower level was a measure for the further improvement. It is in line with a study conducted by Rodiah (2018) that the success of dissemination is affected by the ability to analyze the target, and it includes identifying objectives, information needs and the implemented procedures.10
This study found that quality manager is lacking an understanding on the guidelines of data collection and reporting, and have yet to conduct a supervision and provide feedback of the result of achievement optimally. It is due to the staffs were not able to obtain adequate information about the measures of quality improvement. This study resulted in the ability to identify weaknesses in the quality management system. This finding is in line with a study conducted by Syahputra F (2018) that organization needs to conduct an identification to opportunities for self-development of the staffs and ensure that staffs attain sufficient competence to perform their duties optimally.11
This study found that the lowest accuracy level of the achievement data was at 72% and the third data have yet to reach 100% level. The findings of the present study were able to identify weaknesses in the quality management system which shows that managers experience difficulty in managing the data manually, thus resulting in the duplicate data. This is in line with a study found by Ningsih, K. et al (2019) that the development of web-based reporting system is able to identify duplicate data in reporting, so that it can improve the quality of reporting.12 Similarly, the results of the study by Rachman (2017) showed that the improvement of quality information services using electronic-based online system is able to generate accurate information and data that can be accounted for.13
This study found that assessment of data management and the assessment system are in the yellow category with a score of 2.51 from the total score of 3, which implies that the data are partially complete/ available/ performed. RDQA instruments are able to identify weaknesses in the quality management system, thus it can be applied and utilized to assess the quality management system in X Hospital. This is in accordance with the study conducted by Haikal (2019) that the developed RDQA instrument can be used to assess the data quality in order to support the availability of information, decision-making and further improvement measures.14
X Hospital is carrying various missions, including organizes the development of digitization of hospital services, thus they already provide allocation of a sufficient budget. The success of X Hospital in achieving the mission of the hospital is supported by all components of the hospital, including the readiness of human resources.15 This is in line with the findings of a study by Widodo (2018) that the staffs are able to receive and manage the system properly when they hold a belief that the system they work on provides benefits in supporting their duties.16 Similarly, a study by Syahputra (2018) showed that the organization conduct identification to the opportunities of staffs' self-development to perform the duties optimally.11
CONCLUSION
The application of RDQA instrument is able to identify a system that yet to run optimally.
System assessment using RDQA instruments is in the yellow category with a score of 2.51 from the total score of 3.0, which indicates that the data are partially complete/ available/ performed.
SUGGESTIONS
Implementation of RDQA instrument is needed to analyze the data quality of the quality management system in X hospital. Priority areas in indicator IV on the process of data management and indicator V on the dissemination of the results of the report need to be improved. The hospital management needs to develop a web-based reporting system. Morning conference needs to be optimized at each level of the quality management system
FUNDING
This study is fully funded by the authors.
STATEMENT OF SIGNIFICANCE
An appropriate data management in quality management is crucial to produce accurate information about the quality improvement. Infrastructure in managing quality needs to be prepared thoroughly. It requires human resources who are competent and have a high commitment to the quality improvement and patient safety.
AVAILABILITY OF DATA
Data of the results of this study entirely belong to the authors and used for academic purposes only in Universitas Diponegoro.
BIBLIOGRAPHY
1. Komite Akreditasi Rumah Sakit (KARS). Standar akreditas Rumah Sakit Jilid I. 2017. 421 p.
2. Braithwaite J, Williams R, Natalie N, at al. Deepening our Understanding of Quality in Australia (DUQuA): An overview of a nation-wide, multi-level analysis of relationships between quality management systems and patient factors in 32 hospitals. International Journal for Quality in Health Care, 2020, 32(S1), 8–21 doi: 10.1093/intqhc/mzz103
3. KMKP. Pedoman peningkatan mutu RSUP Dr. Kariadi Semarang. 2019.
4. Micah NJ, Luketero SW. Monitoring and evaluation systems and performance of non- Governmental Based Maternal Health Projects in Bungoma South Sub-County, Kenya. Eur Sci Journal, ESJ. 2017;13(23):11.
5. Who, Norval P-Y, Sebert J. Manual on use of Routine Data Quality Audit ( RDQA ) tool for TB monitoring. Who [Internet]. 2010;(March):1–36. Available from:
http://whqlibdoc.who.int/publications/2011/9789241501248_eng.pdf
6. Yusuf M. Metode penelitian kuantitatif, kualitatif dan penelitian gabungan. Pertama. Jakarta;
2017.
7. Sari NP, Adiputra IM, Sujana E. Pengaruh pemahaman Standar Akutansi Pemerintahan( SAP ) dan pemanfatan sistem informasi akuntansi keuangan daerah terhadap kualitas laporan keuangan Pemerintah Daerah( Studi Kasus Pada Dinas-Dinas di Pemerintah Kabupaten Jembrana ). 2014;2(1).
8. Sri E, Ali M. Faktor-faktor yang berpengaruh pada akurasi kode diagnosis di Puskesmas Rawat Jalan Kota Malang. (2019). 30(3):228–34.
9. Sulastia W, Palampanga A, Yusnita N. Pengaruh kualitas data input , tingkat pemahaman dan tingkat pengawasan terhadap kualitas laporan keuangan (Studi pada SKPD di Kabupaten Tolitoli). e J Katalogis. 2018;6(2):86–97.
10. Rodiah S, Budiono A, Rohman AS. Model Diseminasi Informasi Komunikasi Kesehatan Masyarakat Pedesaan di Kabupaten Bandung Barat. J Kaji Komun. 2018;6(2):175–90.
11. Syahputra FA. Dampak sistem manajemen kinerja terhadap kinerja karyawan. 2018;(July):0–
7.
12. Ningsih KP, Agushybana F, Sediyono E. The planning of technology-based emergency minimum service Standard Reporting System. Int J Heal Educ Soc. 2019;2(9):56–65.
13. Rachman ES, Noviyanto B. Pemanfaatan E-Government pada Desa Wonokarto untuk meningkatkan akurasi dan informasi potensi desa. Technol Accept Model. 2017;8(1):45–50.
14. Haikal, Martini, Sediyono E. Pengembangan instrumen RDQA untuk surveilans epidemiologi DBD di Dinas Kesehatan Kota Tarakan. J Manaj Kesehat Indones. 2019;7(1):16–23.
15. Kementerian Kesehatan. Rencana strategis bisnis RSUP Dr Kariadi Semarang. 2020 – 2024
16. Widodo AP, Agushybana F, Jati SP. Pengukuran penerimaan sistem informasi EWSKIA berdasarkan persepsi pengguna dengan menggunakan Technology Acceptance Model. J Sist Inf Bisnis. 2018;8(2):166–73.
Reviewer
The authors used a combination of a quantitative component using RDQA tool and a qualitative component to understand the quality management system at Dr. Karyadi hospital. Overall, the methods seem fairly robust and there is some good information presented. However, some key details and sequence are lacking.
ABSTRACT
1. Abstract should be writing proportionally (Result section need more explanation while others can be reduced)
2. Keywords are sorted alphabetically INTRODUCTION
1. It would be good to have more detail about the quality data mining workshop in June 2019.
What was the purpose of the workshop? who was the participant? what was the feedback and follow-up action from the management of dr Karyadi Hospital regarding the result of the workshop
2. The study is presented using the RDQA method or tool. It would be helpful to introduce and explain more the method in the Introduction so that readers are clearer why the author or hospital chose this tool/method
3. It would be helpful to hear a little more about Dr. Karyadi Hospital – what is the size of human resources, services, and efficiency profile.
METHODS
1. The research design using R&D, why not action research? Any international literature regarding this design?
2. The study used qualitative and quantitative approach. Please describe all detail of these approach (purpose, subject, sampling technique, data collection, data analysis) in one paragraph of each approach)
RESULTS
1. I think paragraph 1 and 2 from the Result section more appropriate to Method section, please check again
2. Again, it's important to be clear about the approach that you used in the study. So, the result should be also divided into 2 part (qualitative result and quantitative result)
3. Qualitative approach was used in Method but I did not find what was the form of qualitative result in result section (informants characteristics, quotes from informants or anything else) 4. Recommendation should not be written on Result section. It should be discussed in
Discussion section and write in Conclusion and recommendation concretely.
Revisi Reviewer A
DISCUSSION
1. The study divided into 4 themes in Discussion section:
Issue identification of quality management system (please add more relevant references)
Data quality of the quality management system (result should not be repeated in discussion section, add more relevant references)
The implementation of system measurement (please add more relevant references)
Recommendation formulation (it would be better if these recommendation lists was inserted in the discussion of those three themes above)
2. There is interesting statement in the discussion: “This study recommends the use of information technology-based system to manage quality”. Please remember that adoption of technology in management system in Hospital faces many obstacles for example: budget allocation, human resources including their acceptance to high tech, training dan development etc.. So there are a lot more to discuss here.
FIGURES
We just want to ask: the figure 1 and 2 are the output from RDQA application or software for analysis? If yes, please mention also in method section
CONCLUSION
1. Conclusion should answer the objective of the study, please check again
2. The recommendation should be based on discussion and should be more specific, concrete and appropriate to the result
Again, overall, I think this paper has some great content to share, it just needs more details and a good sequence
Analysis of the RDQA-based Working Unit Quality Management System at RSUP DrKariadi Semarang
ABSTRACT
Background and purpose:data handling in quality management is crucial to produce accurate information regarding quality improvement at hospitals. To date, significant double and inappropriate data were gathered during evaluations. The overall data quality is then unknown. This study aims to perform a quality analysis of the working unit quality management system
Methods: this study used a Research and Development (R&D) method with RDQA (Routine Data Quality Assessment) as the instrument equipped with interview guidance. Research informants consist of 16 data collectors, 6 head nurses, 3 persons in charge for quality assurance and 1 person in charge for quality management of hospital Planning and Evaluation (PE) division. Data was analysed qualitatively to analyse RDQA instrument implementation and quantitatively to measure quality management system performance. Data interpretation was displayed in spider and bar graphs
Results: weaknesses involving no reported data verification was identified during this study.
Data quality was 66% valid and 33% invalid. Data management and evaluation system were 60% complete and 40% partially complete
Conclusion: : implementation and customization of RDQA instrument are needed for quality assessment of quality management system to enable description of health service implementation at hospitals.
Keywords:Quality, Quality management system, RDQA.
Comment [MOU1]: Mohondisesuaika ndenganhasilpenelitiandankesimpulan yang disampaikanpadaisi artikel
Revisi Reviewer B
INTRODUCTION
The change of health service implementation forces hospitals to make improvement attempts to enhance quality and patient safety.1 Quality program is developed in a planned, focused, intensive, effective and efficient fashion to enable improvements of all service aspects. RSUP DrKariadi Semarang is a vertical referral hospital providing complex sub-specialty services.
Quality program in RSUP DrKariadi aims to improve quality and secure patient safety which in turn enhancing community health.2
Quality improvement attempts are managed in a quality management system. Data gathered reflects services at RSUP DrKariadi. Working unit quality management system at RSUP DrKariadi consists of three levels. The first level is inpatient rooms as the data collector. The second level is installation of working units as the middle data collector. The third level is PE division as the data centre.2
Quality improvement program needs a comprehensive and sustainable support of quality management system. RSUP DrKariadi performs clinical and organizational governances based on hospital strategic plan. The complex hospital services need a priority improvement attempts. Hospital priority improvement was then derived into unit performance improvement.
Working units is the estuary of hospital services. Woking units have numerous service issues.
Quality improvement and patient safety attempts are done by measuring working unit indicators.Data from the working units provides director information as descriptions of service provision. The accurate information will enable precise decision making.
A quality management evaluation found mistakes regarding to recording, transcript, sampling, incomplete data input and reporting. In a quality data mining workshop in June 2019, 2.9% of 755 participants understood data mining method correctly. The data yielded incorrect analysis
Comment [MOU2]: Pendahuluanseba iknyadidahuluidenganmenggambarkan permasalahanpada level
global/nasioalbarukemudianmengeruc utpadalokasipenelitian
Sebaiknyadijelaskankesenjanganteoriti sterkait quality management di RS yang cobadijawabmelaluipenelitianini.
Misalnyadenganmenjelaskanhasil- hasilpenelitianterdahuluterkait hospital quality management danapa yang belumdiketahuidancobadijawablewatp enelitianini
as suboptimal quality management. It suggests inaccurate data was measured.
Hospitals have not utilized a well-structured evaluation method for quality management system. Quality management system evaluation is expected to provide accurate information to director. Data quality influence accurate decision making.3
Measurement of data quality was once conducted using RDQA instrument. The RDQA measurement consists of data verification and system measurement components. This instrument has never been implemented on quality management system in hospital.4
Based on the gathered data, authors was interested in studying measurement of working unit quality management system utilizing RDQA at RSUP DrKariadi Semarang. This study aims to analyse the implementation of working unit quality management system by implementing RDQA instrument.3
METHODS
This study utilizes Research and Development (R&D) method. The development of RDQA instrument is adjusted with hospital quality improvement needs and standards. The development results are then applied to evaluate working unit quality management system at hospital.5
The research subjects serve as informants involving the first level of person in charge (PIC) for data and head nurses, the second level of PIC for installation quality, and the third level of quality management for PE division.
Penelitian ini dilakukan pada 3 level sistem manajemen mutu kerja di RSUP Dr KAriadi.
Level pertama adalah ruang rawat sebagai tempat pengambilan data. Level kedua adalah instalasi/ unit kerja sebagai pengumpul data menengah. Level ketiga adalah bagian Pelaporan dan Evaluasi sebagai pusat data yang mengelola data unit kerja
Pemilihansampeldalampenelitianinimenggunakanpurposivesampling.
Comment [MOU3]: Sebaiknyadijelas kanapakelebihanmetodeinidibandingka metodelainnya yang biasadigunakan
Comment [MOU4]: Penulisanmetode agar dibuatlebihsistematis
Comment [MOU5]: Berapajumlahsub jekpenelitian?
Jelaskandasarpemilihansubjek
Formatted: Indent: First line: 0,75 cm, Pattern: Clear (White)
Informanpenelitiandalampenelitianiniadalahpengelolamutupadasistemmanajemenmutu unit kerja, terdiridari level pertamasejumlah16 PIC data dan 6 kepalaruang, level keduasejumlah3
penanggungjawabmutuinstalasi, dan level ketiga 1 orang
pengelolamutubagianPelaporandanEvaluasi.
This study utilizes qualitative and quantitative methods for analysis. Qualitative method is for analysing appropriateness of the RDQA instrument against hospital circumstances. The authors perform an in depth interview to quality manager at each level of quality management system. It will show quality management issues in an attempt to improve quality. It is used for recommendation formulation for quality management system improvement.7
Pengambilan data
kuantitatifdalampenelitianinimenggunakanmetodewawancaraterstruktur.
Penelitimenggunakan daftar pertanyaandaripengembanganinstrumenRDQA.
Quantitative method is displayed in spider and bar graphs.6Pengembanganinstrumen RDQA disesuaikandenganstandarupayapeningkatanmuturumahsakit. Penerapaninstrumen RDQA digunakanuntukmenilaikualitas data padasistemmanajemenmutu unit kerja di RSUP Dr.
Kariadi.
Variabelpenelitianiniterdiridariverifikasi data danpenilaiamsistem. Verifikasi data digunakanuntukmemeriksakebenaran data yang meliputi review dokumen, laporanhasilpenghitungandanvalidasilaporanhasildengansumber data.
Variabelkeduapenilaiansistemyaitumengumpulkanbuktiuntukmendapatkankarakteristikstafdal ammelaksanakantugasterdiridari 5 indikatoryaitu: I Struktur, FungsidanKemampuan M&E:
memastikanpengelolamutumemahamitugasnya, II Panduan Pengambilan Data danPelaporan:
melihatketersediaanpanduan, III Pengumpulan Data Pelaporandan Tools: Memastikanstandar format yang digunakan, IV Proses Pengelolaan Data: memastikanterdapat monitoring
terhadapkualitas data, V Diseminasihasillaporan:
Comment [MOU6]: Adakahpedoman wawancarayang
digunakan?Bagaimanaanalisis data dilakukan?
Comment [MOU7]: Berapa orang?
Comment [MOU8]: Wawancaraterstr ukturterhadapsiapa?
Comment [MOU9]: Ada berapapertanyaan
Formatted: Indent: First line: 0 cm
memastikanterdapatpengelolaanlanjuthasilcapaianmutu.
Measurement score of data and reporting system management aspect starts from 0 to 3. The score of <1.5 indicates red referring to no data, the score of 1.5 – 2.5 indicates yellow referring to partially complete, and the score of 2.5 – 3.0 indicates green referring to fully complete.
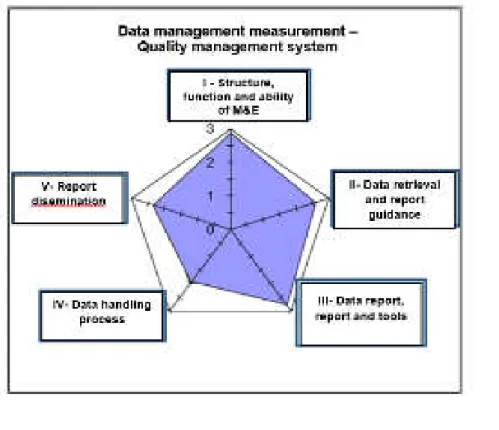
Hasil penelitiankuantitatifdisajikandalamspider graph dan bar graph. The spider graph presenting qualitative data is a conclusion of system measurement of the RDQA second component. The spider graph presents numeric value on each measurement. The higher achievement value is the higher performance of quality management system. It is used for prioritizing area of improvement.6
The bar graph describing quantitative data is a conclusion of data verification of the RDQA first component. The bar graph illustrates data accuracy. The higher bar of data verification measurement shows the higher data accuracy. This achievement is used for data quality improvement plan.7
The authors will perform an in depth interview to quality manager at each level of quality management system. It will show quality management issues in an attempt to improve quality.
It is used for recommendation formulation for quality management system improvement.7 This study has been approved by the Ethics Committee Dr Kariadi General Hospital, Semarang, Indonesiaon February 10, 2020.
Penelitian ini menggunakan metode Research and Development (R&D). Pengembangan instrumen RDQA disesuaikan dengan standar upaya peningkatan mutu rumah sakit.
Penerapan instrumen RDQA digunakan untuk menilai kualitas data pada sistem manajemen mutu unit kerja di RSUP Dr. Kariadi. Pengambilan data dalam penelitian ini menggunakan metode wawancara terstruktur. Peneliti menggunakan daftar pertanyaan dari pengembangan instrumen RDQA.
Penelitian ini dilakukan pada 3 level sistem manajemen mutu kerja di RSUP Dr KAriadi.
Formatted: Line spacing: 1,5 lines Comment [MOU10]: Jelaskannilai 0,1,2,3 artinyaapa?
Siapa yang melakukanpenilaian?
Berdasarkanapa?
Laluapakahdilakukanperhitungannilai rata-rata (mean)?
Formatted: Indent: First line: 0,75 cm
Level pertama adalah ruang rawat sebagai tempat pengambilan data. Level kedua adalah instalasi/ unit kerja sebagai pengumpul data menengah. Level ketiga adalah bagian Pelaporan dan Evaluasi sebagai pusat data yang mengelola data unit kerja
Pemilihan sampel dalam penelitian ini menggunakan purposive sampling. Informan penelitian dalam penelitian ini adalah pengelola mutu pada sistem manajemen mutu unit kerja, terdiri dari level pertama sejumlah 16 PIC data dan 6 kepala ruang, level kedua sejumlah 3 penanggungjawab mutu instalasi, dan level ketiga 1 orang pengelola mutu bagian Pelaporan dan Evaluasi.
Variabel penelitian ini terdiri dari verifikasi data dan penilaiam sistem. Verifikasi data digunakan untuk memeriksa kebenaran data yang meliputi review dokumen, laporan hasil penghitungan dan validasi laporan hasil dengan sumber data. Variabel kedua penilaian sistem yaitu mengumpulkan bukti untuk mendapatkan karakteristik staf dalam melaksanakan tugas terdiri dari: I Struktur, Fungsi dan Kemampuan M&E: memastikan pengelola mutu memahami tugasnya, II Panduan Pengambilan Data dan Pelaporan: melihat ketersediaan panduan, III Pengumpulan Data Pelaporan dan Tools: Memastikan standar format yang digunakan, IV Proses Pengelolaan Data: memastikan terdapat monitoring terhadap kualitas data, V Diseminasi hasil laporan: memastikan terdapat pengelolaan lanjut hasil capaian mutu This study has been approved by the Ethics Committee DrKariadi General Hospital, Semarang, Indonesiaon February 10, 2020.
RESULTS
RSUP DrKariadi Semarang has 3 levels of quality management system. The first is inpatient rooms, the second is installation/working units, and the third is PE division as the data centre.
The quality managers of each quality management system level serve as research informants.
In the first level, there are 16 data PIC and 6 head nurses. In the second level, there are 3 PIC of installation quality. In the third level, there is 1 quality manager of PE division/data centre.
Comment [MOU11]: Ceritakankarakt eristiksubejkpenelitian
The data reporting flow of quality management system is the first level of PIC performing data retrieval. Head nurses perform data recapitulation reported to the second level of installation/working units. The second level as the middle data retriever receives and recaps data from the first level according to his area. The third level serves as the data centre, receiving data from the second level.
Measurement was conducted in Intensive Care Unit (ICU), High Care Unit (HCU), inpatient room Rajawali 5A and 5B, outpatient clinic Merpati ground floor and first floor as the first level. The second level was conducted in intensive care, inpatient and outpatient installations.
The third level was conducted in PE division.
Measurement of data quality was conducted in November 2019. The data was retrieved from surveillance indicators of informed consent sheet filling, primary doctor supervision to postgraduate students taking medical specialist, and maintenance and calibration of medical equipment.
a. Issue identification due to RDQA implementation
The averaged measurement shows similar weaknesses on each level of quality management system in which data verification prior to reporting is not conducted by the quality managers. An in depth interview to the quality managers shows some issues involving suboptimal understanding toward data retrieval, no uniform format, no web- based data retrieval system, disable system to identify double data, and suboptimal data reporting.
b. Data qualityanalysis of RDQA implementation
Data quality measurement on the second component is data verification consisting of data review, data recounting and validation. Data was verified against data measurement of 3 working unit quality indicator. The first is indicator data of informed consent sheet filling.
The second is indicator data of primary doctor supervision toward post graduate students
Comment [MOU12]: Bisaditambahka nkutipanhasilwawancara
taking medical specialist. The third is data indicator of medical equipment maintenance and calibration.Showsthelowest data quality on thethirdindicator of medialequipmentmaintenance and callibration in theamount of 72%.Figure 1
Thisstudyidentifiedreportingperformancequality (documentavailability, on timereporting and quality data completeness). Theaveragedidentificationshowsthelowestperformance of documentavailabilitycathegory. It is causedbythereported data
wasnotverifiedbythequalitymaangers. The in
depthinterviewactivitiesfoundthequalitymanagersperceived a manual data handlingwasdifficult to do.
c. Analysis of data quality measurement implementation on RDQA application
Quality management system yielded quality data. Quality achievement and quality managers were measured. Measurement of the second component of RDQA was to identify characteristics of each manager level of quality management system.
The second component of RDQA consists of 5 indicators. The first is structur, function and monitoring & evaluation (M&E) ability. the second indicator is the guidance of data retrieval and reporting. The third indicator is data gathering, reporting and tools. The forth indicator is data handling process. The fifth indicator is report dissemination.
Measurement of the second component was displayed in a table and measurement system management summary.
Measurement score of data and reporting system management aspect starts from 0 to 3.
The score of <1.5 indicates red referring to no data, the score of 1.5 – 2.5 indicates yellow referring to partially complete, and the score of 2.5 – 3.0 indicates green referring to fully complete.
Table 1 shows measurements of the five function indicator on quality management system. 60% and 40% are on the green and yellow categories respectively. The average
Comment [MOU13]: Pindahkankeba gian methods
measurement of all quality management system level on indicator IV is data handling process on the yellow category with averaged value of 1.93. The averaged value of the fifth indicator, the report dissemination, is 2.34 on the yellow category. The second level (outpatient installation) shows the lowest quality with the value of 1.25 on the red category.Measurement of data handling and systemapraisal is on eachlevel of quality management system. Theaveragedvalue of thefirstlevel is 83.3% and 16.7% on greenyellowcategoriesrespectively. Theaveragedvalue of thesecondlevel is 66% and 33.3% on greenyellowcategoriesrespectively. Theaveragedvalue of thethirdlevel is 100%
on greencategory.
System measurement on the quality management system shows overall yellow category referring to partially complete. Data handling process as the lowest measurement of indicator IV is on yellow category. An in depth interview with a quality manager found the necessity of quality management system reinforcement. The quality managers find difficulties in manual data handling.Figure 2
d. Recommendations for improvement
Similar weaknesses were found on each quality management system level as quality managers do not perform reported data verification. Recommendations were formulated from findings during interview. The first recommendation is system reinforcement of means and infrastructure to ensure quality guidance availability, and web-based reporting system. The second is competence reinforcement of the quality managers to identify competence enhancing needs and optimize quality manager supervision. The third is commitment strengthening of the quality manager which serves as a trust strengthening of the quality manager in quality improvement attempts.
Service improvement attempts in hospitals are conducted by measuring quality. The existing issues are graded for prioritization to solve. Quality measurement is conducted based on data retrieval guidance which is indicator profile. Quality measurement values serve as a reflection of service activities in hospitals.
Figure.1 Global dashboard statistics of working unit data quality management system
Table.1 Measurement of data and appraisal system management
Measurement Indicator (each function) Average of
each level I II III IV V
Level I
PE 3.00 3.00 2.75 1.78 3.00 2.71
Level II
Intensive Care 3.00 3.00 2.75 2.00 2.50 2.65
Inpatient Room 3.00 3.00 3.00 2.00 2.25 2.65
Outpatient Clinics 2.65 2.25 1.75 1.56 1.25 1.90
Level III
ICU 3.00 3.00 3.00 2.00 2.50 2.70
HCU 3.00 2.75 2.80 2.00 2.50 2.61
R 5A 3.00 2.25 3.00 1.83 2.75 2.57
R 5B 3.00 2.00 3.00 2.00 2.50 2.50
Merpati Gr floor 3.00 3.00 3.00 2.00 2.00 2.60
Merpati 1st Floor 2.00 1.50 2.80 2.00 2.00 2.06
Averaged Function 2.88 2.60 2.78 1.93 2.34 2.51
Figure 2. Global dashboard of system Measurement
DISCUSSION
Issue identification of quality management system
This study found that data verification was not performed by most quality managers of each level. On the first level, data retrieval, recap and report were conducted manually. Numerous indicators result in verification by quality managers is difficult to perform. On the second level, data gathering was conducted manually in which the quality manager recapped reports from the first level on his area. Data gathering, recapitulation and input to the system were conducted manually while reporting were conducted online. Double recapitulation of the first and second levels can lead to error. The third level received report from the second level.
Verification of hospital wide reported data is hard to do. The system in use is unable to precisely identify double data.
Qualityhandling and reportingdevelopedbased on informationtechnologyeffectively help qualitymanagershandlequalityissues. It enhancesinformatonquality in terms of documentavailability, managerscomfort, informationappropriateness, data completeness, on timereporting.8 Thereportqualitysupportedby data input, understanding on thestandard and surveillanceconductedbyseveralpartiessignificantlyinfluences finance reportquality. Variable of understandinglevel, however, doesnotsignificantlyinfluencethereportquality.9 Reporting systemdocumentsinvolvinguniformqualityguidance, implementationprocedure and formssupportproper data handling and influencereportingquality.10A similarstudyfoundsignificanteffects of thevariable of understanding and systemuse on thevariable of reportingquality in theamount of 73%. 11
Data quality of thequality management system
Thisstudyyieldedmeasurement of thelowest data quality in theamount of 72% referring to invalid. Based on qualityenhancementguidance at RSUP DrKariadi, theaccuracylevel of 90%
Comment [MOU14]: Agar ditambahkanimplikasihasilpenelitianda nketerbatasanpenelitian
is a goodbencmark. Thisstudyyielded 33% < 90% suggestingoverallmeasurementvaluehas 1 of 3 workingunitindicatorswithinvalidquality. It is causedbytheabsence of good data verification and surveillance in data handlingprocess.Thestudyfindings show thatmonitoring, evaluation, goodevaluation and optimal data handlingsignificantlyinfluencereportquality.9 Theimplementation of systemmeasurement
Thisstudyshowstheoverallsystemmeasurement on eachquality management system on yellowcategory is indicator IV, data handlingprocess. It is causedbythe management of qualityhandlinghasnotutilizedinformationtechnology-basedsystem. Theexistingsystem is unable to identifydouble data and backup data. Manual data handlingcanlead to error.
Thestudyfindings show thatinformationsystem and management contribution in monitoring and evaluationinfluencequalitymanagerperformance. Understanding on theworkplaninfluence 0.073 qualitymanagerperformance. There is a significanteffect of humanresourcecapacity on qualitymanagerperformance in theamount of 0.530.3 It is supportedbypreviousstudystatingthatinformationsystem is acceptedwhen it is easilyoperationalised, perceivedpositivelybyusers, and useful for jobcompletion.12
Recommendationformulation
Findingsfrom in depthinterview and interactionwiththequalitymanagers on eachquality management systemlevelareused to formulaterecommendation. Theuse of measuringinstrumentduringinterview is veryeffective to documentfindings.
Discussionwiththequalitymanagersyieldedadvices for recommendation.
Thisstudyrecommendstheuse of informationtechnology-basedsystem to managequality.
Thecapability and commitment of qualitymanagersarestrenghtened to managequality.
Thisstudyshowsthatrecommendationincreases 18% to theperiod of thesecondimprovement and 22% to thethirdperiod. Recommendationswerelistedbased on activeparticipation of thestudents.13 A quality information service improvement utilizing electronic-based online
Comment [MOU15]: Studi dimana?
Comment [MOU16]: Maksudnya?
Mohondiperjelas
system will lead to accurate and accountable information.14 There is a significant effect of human resource capacity on quality manager performance in the amount of 0.530.7 Understanding among staffs affects organization culture and automatically improves organization performance.15
CONCLUSION
Theproblemidentificationshowssuboptimalquality management whichcanaffect data quality.
Quality of eachworkingunitquality management system is on middlecategory. Measurement of overall data management and systemmeasurement is on middlecategory.
Thegivenrecommendation is thequalitymeans and infrastructureenhancement, improvementsystem of qualitystaffcompetence and buildingcommitment. The RDQA canbeapplied to evaluatequality management system at RSUP DrKariadi Semarang.
Thisstudyprovides 4 recommendationsinvolvingthe RDQA intstrument is developedperiodicallyfollowingthequalityoperatordevelopment at RSUP DrKariadi.
Thequality management system is measuredroutinely for evaluation. Enhancement of thequality management system (means and infrastructures, competence, and buildingcommitment) needsoptimalsupport to achievetheexpected output.
Thefutureresearchersareadvised to examinethepre and postimplementation of quality management systemmeasurement in hospitals.
ACKNOWLEDGMENT
Thanks to the Public Health Faculty of Diponegoro University, DrKariadi General Hospital, Semarang and all those who contributed to this study.
Comment [MOU17]: Rekomendasidi buatsingkat.
Janganadapengulangankalimat
Comment [MOU18]: Bisadibahas di discussion
sebagaiimplikasihasilpenelitian