I would also like to thank Georgia Tech colleague Brad Ochs and technicians Chris Ballance and Seth Hutchins for their help and company during my extended visits to Atlanta. Financial support for the premixed flame core and flow marking development experiments was provided by the Air Force Office of Scientific Research, Combustion and Diagnostics Program (Chiping Li, Manager) under FA Contract RC657. Financial support for the UV Raman measurements was granted through the Summer Fellowship Research Program at Wright-Patterson Air Force Base under the Air Force contractor, Universal.
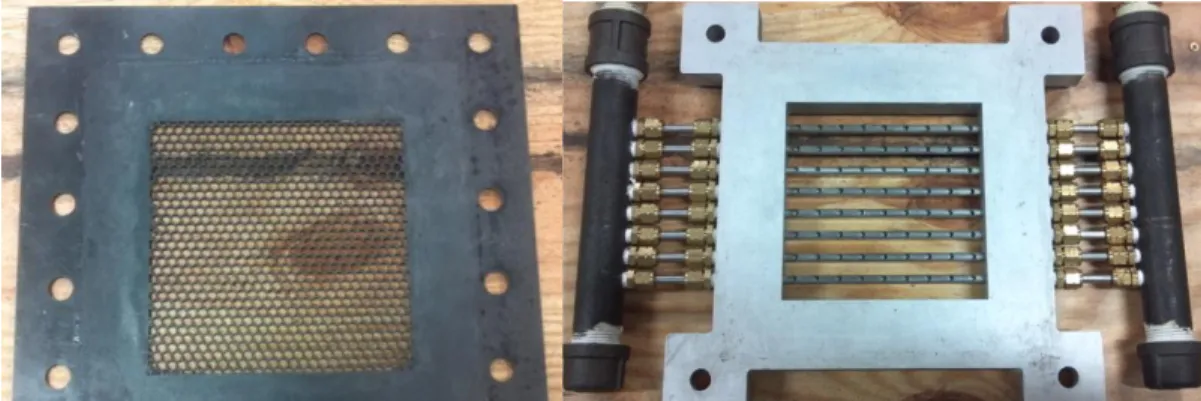
Turbulence values for PNPG kernel experiments (left) with regime diagram (right) with ℓ = 3 mm (i.e. PNPG mesh size). Close the fuel injectors (red stars) from the side (up) and from above in one. Hot-wire anemometry data showing the correlation between Mach number and anisotropy for the inflated grid turbulence generator at both intensity (top), length.
INTRODUCTION
Alternatively, devices known as flame bombs, which use spherically propagating flame cores, are also used to study premixed turbulent combustion. Since flame nuclei are neither stabilized nor have mean shear, the use of flame bombs eliminates most geometry-dependent effects (for nuclei sufficiently smaller than the bomb size [2, 3]). Although flame bombs provide a reliable means of studying flame nuclei [3–16], they have minor drawbacks.
Furthermore, because these vessels are constant volume devices, the flame grains will cause a pressure rise (although some bombs can be considered roughly isobaric [3, 5-7]). Therefore, in this work, a premixed wind tunnel in which flame nuclei propagate freely in the mean flow is developed to alleviate the limitations of flame bombs. These results are compared to traditional flame bomb measurements to assess wind tunnel performance and to determine whether this new device can be used to reliably determine the phenomenological behavior of premixed turbulent flame propagation.
PREMIXED TURBULENT FLAME KERNELS
Alternatively, the upper limit of the flame regime (ReT > 1, Ka < 1) can be determined when the Kolmogorov scale, η, is proportional to the flame thickness (ie, η = δL *Sc1/2). In WF, the laminar spread of flames is faster than the turbulent vortex circulation and thus the wrinkling process. In the thin reaction zone (TRZ) regime, the vortices can penetrate into the preheating region of the flame front, but not into the inner layer.
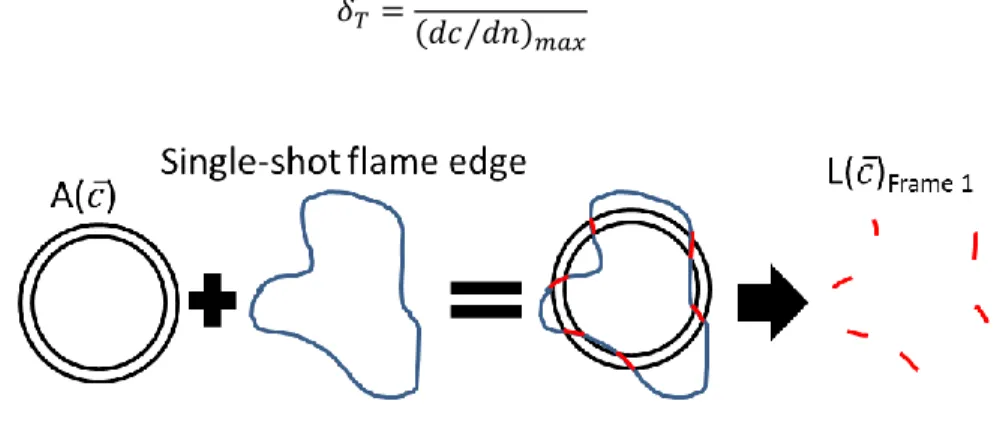
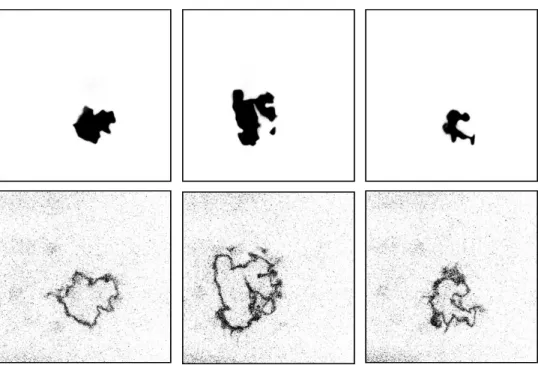
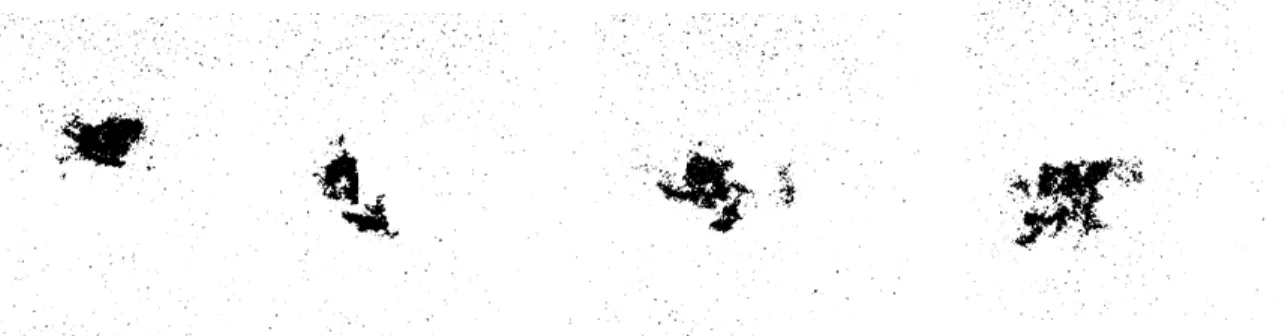
However, recent experiments [1] studying the so-called DRZ regimes did not observe the fragmentation of the flame fronts. ST,D is defined as the relative growth rate of the core and is a function of time and radius due to the self-accelerating nature of spherical flames. A polynomial fit to the x and y coordinates of the image was performed for each of the flame edge segments.
Due to the extension of the vortex in the throat [50], the turbulence is highly anisotropic in the test section with the downstream component, uRMS, being ∼25% of the other components in the case of M = 0.3 and ∼40% at M = 0.1. The downstream component increases slowly downstream due to the tendency of turbulence to return to isotropy. The square root of the turbulent kinetic energy, k, is also plotted in Figure 14: and shows a slow decay of the overall turbulence.
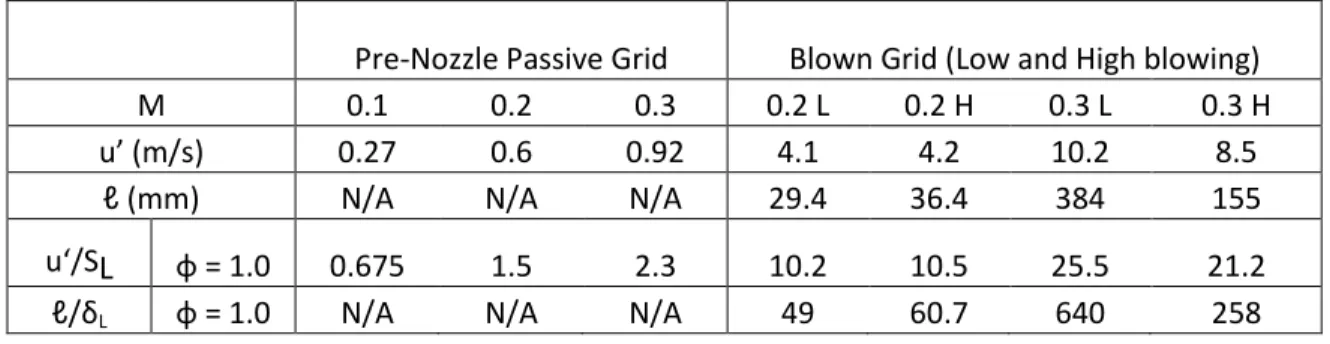
While the turbulence intensities are lower than the blown grid, the wing grid length scales are much smaller for all Mach numbers, allowing more of the turbulent scales to wrinkle the flame front. For the latter propagation times, the mean curvature values are around zero corresponding to the cases with lower turbulence intensity for the blown grid (see Appendix A). Due to the limitations of the current hot wire system, the turbulence spectra can only be measured in the longitudinal direction and not in the transverse directions.
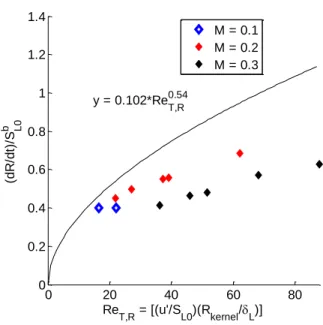
Alternatively, ReT,R can be normalized by using the Markstein length, δM, instead of the laminar flame thickness, δL, as seen in Figure 32 or plotted against (ReT,R)0.5 as shown in Figure 33. This decrease in correlated flame speed is caused by only a fraction of the turbulence energy being able to fit into the cores and wrinkle the flame front, thus affecting the flame speed. This peanut shape resulted in a negative mean curvature, and for the high Markstein number of the mixture, this would result in an increased flame speed relative to the M = 0.2 and 0.3 cases, causing the apparent Mach number dependence.
![Figure 1: Borghi plot as refined by and found in Peters [35] showing the various regimes of turbulent premixed combustion](https://thumb-ap.123doks.com/thumbv2/123dok/10740736.0/20.918.509.839.606.819/figure-borghi-refined-peters-showing-turbulent-premixed-combustion.webp)
UV RAMAN MEASUREMENTS IN A SCRAMJET COMBUSTOR
80] have shown that fuel directly from the back of the cavity supports combustion over a wider range of conditions and a more uniform fuel–air. An isolator of constant cross section (51 mm high by 153 mm wide) was upstream of the test section. The bottom wall pressures along the burner centerline are shown in Figure 40. The pressures measured upstream of the cavity are close to the predicted isentropic value of 39 kPa.
After completing a single vertical sweep, the probe region is then moved axially from the upstream to downstream edge of the cavity. Upstream regions of the cavity suffered from significant LIF interference shown in Figure 45 next to an example with minimal interference, and as a result a fraction of the images could not be reliably reduced. The mixture fraction data in Figure 55 shows rich mixtures ( > 0.05) along the floor and beyond the stair of the cavity.
Furthermore, the mixture fraction decreases steadily along the shear layer, due to turbulent transport of O2 into the cavity and products out of the cavity. To reduce data distortion due to broadband interference, points were chosen such that at least 90% of the images were reducible. At Location C, shown in Figure 61, while some of the CH4 has yet to react, the mixture is predominantly lean and has reacted or at least partially reacted.
The "flatness" of the XH2O and XO2 RMS profiles is probably due to recirculation/turbulent transport and the slow reaction of CH4. This may also be a result of the fast reaction of H2 and relatively slow reaction of CH4. Raman scattering has intrinsically low signal levels, especially at the low pressure, ~1/3 atm, of the cavity.
CH4 was largely unreacted by the time it reached the leading edge of the cavity.

VELOCIMETRY DEVELOPMENT
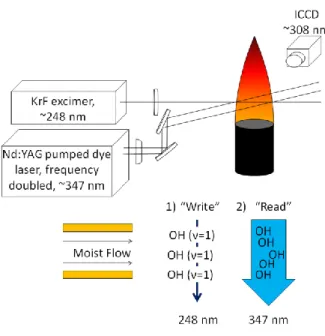
The schematic of the VE-HTV system and a diagram of the HTV read/write processes are shown in Figure 64. However, due to the dependence of the two-photon method, the tag line image thickness is closer to ∼230 μm. All OH label lifetime (v=1) and spectral identification measurements were made downstream of the burner surface where the flame radicals recombine to produce adiabatic equilibrium gas [111].
Due to the inverse square dependence of H2O photodissociation on the writing laser diameter, the tag formation concentration is strongest in the middle (1 cm) portion of the line. At stoichiometric conditions, the vibrationally excited equilibrium OH is about 10% of the total OH concentration. Lifetime of the OH (ν = 1) tracer in lean flames is significantly shorter than previously reported using the ground state OH (v = 0) tracer [33].
Figure 67: Lifetime of the OH (ν = 1) tracer at different equivalence ratios in the afterflame zone of a laminar H2/air flame formed by a Hencken burner (diameter 12.5 mm). The simulated and measured spectra agree well and confirm the formation of the OH (v=1) tag. There are no clean breaks in the central portion (1 cm) of the line where the written slogan intensity is highest.
These line breaks are likely the result of out-of-plane movements, which move the line outside the reading sheet. With averaging, the moved lines are continuous over the 2 cm length of the slogan. The SNR of the average raw image ranges from 4:1 to 7:1 in the region where velocity profiles are provided.
Although the lifetime of the vibrationally excited OH (v=1) tag is shorter than that of the OH tag (v=0) in the ground state, it still has sufficient lifetime for fast currents.
SUMMARY
The scheme of the network generation scheme is shown in Figure A1 (left) with an example network. The third lobe found in the images is a laser flare object similar to the results of Mansour et al. While pre-nozzle passive grid studies demonstrated the ability to ignite mixtures under low turbulence for a range of mean flow velocities and an increase in flame brush thickness as a function of turbulence, laser ignition artifacts limited the interpretation of the results.
In addition, the degree of anisotropy is a strong function of Mach number with higher mean flows generating greater anisotropy, as shown in Fig. A7 . These large scales resulted in significant out-of-plane motion of the nuclei. Therefore, an orthogonal camera was used to monitor both the OH* chemiluminescence of the nuclei relative to the OH PLIF sheet, as shown in Fig. A8.
The effects of this anisotropy can be seen in Fig. A10, where the c-scan of the cores starts in an ellipse with the major axis in the direction of the flow. Due to the limitations of the current hot wire system, turbulence could not be measured above M = 0.3. K On flame-turbulence interaction in constant-pressure propagating flames,” Proceedings of the Combustion Institute, 35, p.
S Measurement of turbulent burning velocities in high-pressure implosions," Proceedings of the Combustion Institute, 33, pp. J Molecular tagging velocimetry and its application to in-cylinder flow measurements," Journal of Fluids Engineering-Transactions of the ASME, 135( 12), p. L Premixed Turbulent Flame Front Structure Study of Rayleigh Scattering in the Thin Reaction Zone Regime," Proceedings of the Combustion Institute, 32, pp.
D Stability Limits for Cavity Stabilized Flames in Supersonic Flow,” Proceedings of the Combustion Institute, 30, p.
![Figure 4: Typical turbulent flame speed correlation by Peters [35] (left), and spherical correlation by Chaudhuri et al](https://thumb-ap.123doks.com/thumbv2/123dok/10740736.0/28.918.175.809.308.588/figure-typical-turbulent-correlation-peters-spherical-correlation-chaudhuri.webp)