See discussions, stats, and author profiles for this publication at: https://www.researchgate.net/publication/349591596
Learning Style Detection in E-learning Systems Using Machine Learning Techniques
Article in Expert Systems with Applications · February 2021
DOI: 10.1016/j.eswa.2021.114774
CITATIONS
70
READS
3,411
2 authors:
Fareeha Rasheed
Maulana Azad National Urdu University Hyderabad 7PUBLICATIONS 97CITATIONS
SEE PROFILE
Abdul Wahid
Maulana Azad National Urdu University 46PUBLICATIONS 281CITATIONS
SEE PROFILE
All content following this page was uploaded by Fareeha Rasheed on 30 May 2021.
The user has requested enhancement of the downloaded file.
1
Learning Style Detection in E-learning Systems Using Machine Learning Techniques
Fareeha Rasheed
[1](Corresponding author), Prof. Abdul Wahid
[2]Authors’ Affiliation: Department of Computer Science & Information Technology, Maulana Azad National Urdu University, Gachibowli, Hyderabad, India
[1]
+91-9885166968, [email protected] ,
[2]
[email protected] / [email protected] .in
Cite as: Rasheed, F., & Wahid, A. (2021). Learning style detection in E-learning systems using machine learning techniques. Expert Systems with Applications, 174, 114774.
Visit the following link to access the final version, this document may have been updated in the final version. https://www.sciencedirect.com/science/article/abs/pii/S0957417421002153
.
2
Learning Style Detection in E-learning Systems Using Machine Learning Techniques
ABSTRACT: Learning style plays a vital role in helping students retain learned concepts for a longer time and also improves the understanding of the concepts. Learning styles in offline and online scenarios are recognized using questionnaires. The recent trend is to identify and use attributes to detect the learning style of the learner automatically without disturbing the learner. The paper is an extension of the authors' earlier work with some changes to the methodology. In this paper, the authors have identified new attributes and scaled-down the attributes identified earlier, which would help identify the learner's learning style. The authors implemented classification algorithms and compared the accuracy of the different algorithms on the dataset. Various interesting patterns are observed in learner's behaviour while learning different types of concepts in different situations.
Keywords:Machine learning, classification, learning style, e-learning 1. Introduction
Personalization has been a part of computing since the past few decades, and each system currently being developed provides some sort of personal touch to the users. E-learning systems have evolved a lot, from simple computerized instruction and quizzes to adaptive virtual environments (Wild et al., 2014). Learning styles are a category under a broader umbrella of learner characteristics; learner characteristics are the characteristics of the learner that affect the learning process (Nakayama & Santiago, 2012). Learning style is an interesting attribute in the learning scenario. Learning style is the preferred way of using one's ability to learn (Sternberg, 1994). Different psychologists have given us different models of learning styles. Some of them are David Kolb's model, Peter Honey and Alan Mumford's model, learning modalities, Neil Fleming's VAK/VARK model, Anthony Gregorc's model, NASSP model, Felder-Silverman learning style, Gardner's theory of multiple intelligence and so on (Pashler et al., 2008).
David Kolb's model is also known as experiential learning. Kolb's learning style defines different approaches to experiences. They are Concrete Experience and Abstract Conceptualization, as well as two related approaches toward transforming experience: Reflective Observation and Active Experimentation (Kolb & Kolb, 2005).
Honey and Mumford's learning style is based on Kolb's learning style theory. It consisted of four learning styles:
Activists, Theorists, Pragmatists, and Reflectors (Honey & Mumford, 1989). Learning modalities refer to how learners use their senses to learn. The commonly considered modalities are four: visual (seeing), auditory (hearing), kinaesthetic (moving), and tactile (touching). Auditory learners enjoy reading or listening; visual learners often learn by seeing things. The kinaesthetic learn by doing something rather than just observing, and the tactile learns better when they touch things and experience its structure and feel (Fleming, 2001).
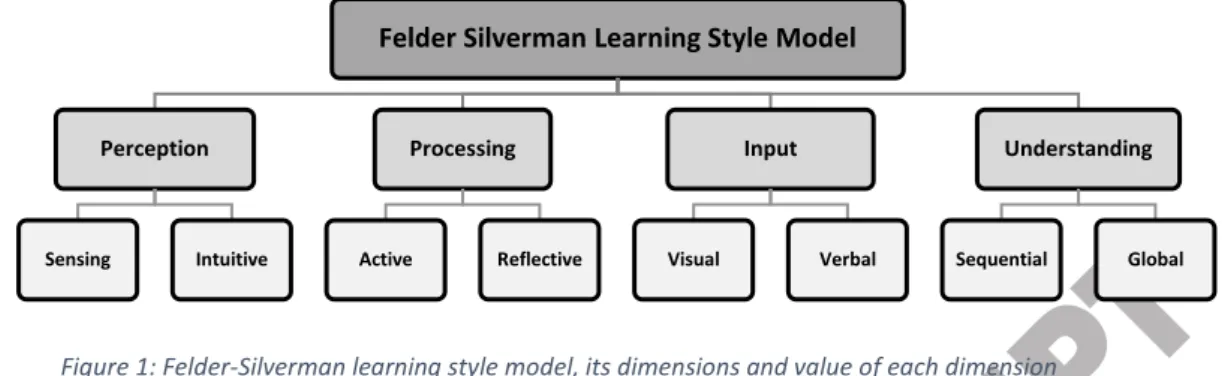
Felder–Silverman's learning style was initially researched by Richard Felder and Linda Silverman to help professors in their teaching methodology to engineering students. But now it has become a widely accepted learning style model and is increasingly being adopted in many online learning systems. The four dimensions defined in this learning style model are perception toward information, input preferred, processing information, and understanding information. Perception has two variants sensing (concrete) and intuitive (abstract/imaginary).
Inputs can be of two types visual or verbal, and the information processing can is done in two ways. Processing of information happens in two ways active (experimentation) and reflective (observing). Understanding
3 information is also done in two ways sequential (follows a sequence) and global (does not work in any order) (Felder et al., 1988). Figure 1 shows the various dimensions and their values in the Felder-Silverman learning style model.
Figure 1: Felder-Silverman learning style model, its dimensions and value of each dimension
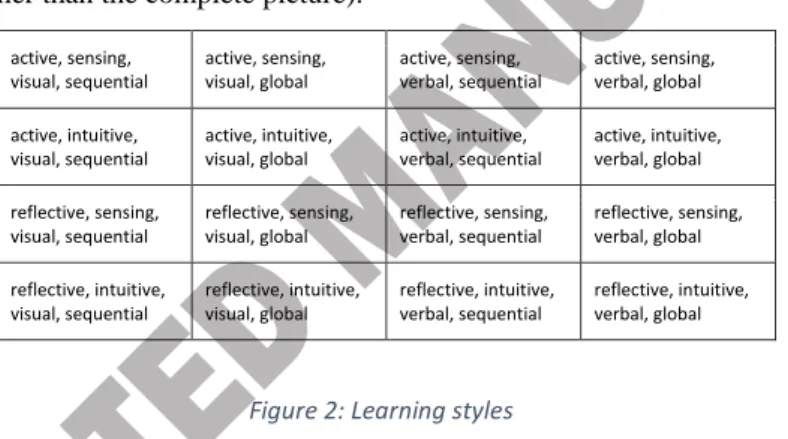
There can be 16 combinations of learning styles that can be formed using values of each dimension in the model.
These combinations can be formed by selecting one value from each of the dimension. This value in questionnaires is attained by cross-checking the marking key to the student's answers in the questionnaire. For example, the cell 1 of the combinations grid in figure 2 asserts that a learner is an active learner (participates in groups) is a sensing learner (focusses on facts), takes in visual input (learns well with images) and has sequential understanding (learns concepts in sequence rather than the complete picture).
Figure 2: Learning styles
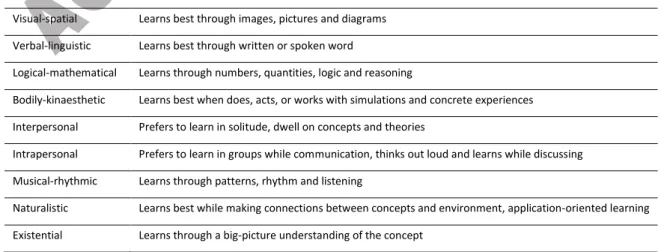
Gardner's theory of multiple intelligences is a cognitive approach to learning. This theory has emerged from cognitive research and "documents the extent to which students possess different kinds of minds and therefore learn, remember, perform, and understand in different ways" (Gardner & Hatch, 1989).
Table 1: Gardner's theory of multiple intelligences and learning styles Dominant intelligence Learning style/learns best through
Visual-spatial Learns best through images, pictures and diagrams Verbal-linguistic Learns best through written or spoken word
Logical-mathematical Learns through numbers, quantities, logic and reasoning
Bodily-kinaesthetic Learns best when does, acts, or works with simulations and concrete experiences Interpersonal Prefers to learn in solitude, dwell on concepts and theories
Intrapersonal Prefers to learn in groups while communication, thinks out loud and learns while discussing Musical-rhythmic Learns through patterns, rhythm and listening
Naturalistic Learns best while making connections between concepts and environment, application-oriented learning Existential Learns through a big-picture understanding of the concept
Felder Silverman Learning Style Model
Perception
Sensing Intuitive
Processing
Active Reflective
Input
Visual Verbal
Understanding
Sequential Global
active, sensing, visual, sequential
active, sensing, visual, global
active, sensing, verbal, sequential
active, sensing, verbal, global active, intuitive,
visual, sequential
active, intuitive, visual, global
active, intuitive, verbal, sequential
active, intuitive, verbal, global reflective, sensing,
visual, sequential
reflective, sensing, visual, global
reflective, sensing, verbal, sequential
reflective, sensing, verbal, global reflective, intuitive,
visual, sequential
reflective, intuitive, visual, global
reflective, intuitive, verbal, sequential
reflective, intuitive, verbal, global
4 Learning styles pertaining to each of the dominant intelligence in learners expresses the best way each learner who has a particular dominant intelligence learns. For example, a learner with mathematical-logical as the dominant intelligence learns best through numbers, logic and reasoning of concepts rather than words. There are other models that identify the learner's learning style using different aspects of learning. Each model has its own dimensions and values which can be used to form combinations of learning styles. However, analysing all of them in a single study is difficult and out of the scope of this paper. Following are the simple reasons for selecting these two learning style models—Firstly, most of the research done in the area worked with a variety of learning style models, but very few of them worked with the Gardner’s theory of multiple intelligences. Secondly, most of the work done with the FSLM model skipped some of the dimensions (such as understanding dimension) and many researchers didn’t achieve higher accuracies. Thirdly, some of the characteristics of students in other learning style models (For example, Dunn and Dunn has physiological and environmental dimensions which cannot be observed in online mode) were difficult to be mapped to online learning which makes it difficult to completely avoid the usage of questionnaires. Hence, these two models were selected.
Learning style is identified by using the questionnaires and the scoring material given by these eminent psychologists. Learners fill the questionnaires, and they are marked. These later evolved into online questionnaires being marked automatically by computer programs (Vincent & Ross, 2001). The advantage of questionnaires and online quizzes is that they are simple to implement and more straightforward to analyse. However, there are also problems associated with them. These questionnaires contain an average of more than twenty questions. There is a lot of bias when learners fill the questionnaires. Time constraints also pose a threat to the manual filling of questionnaires. Thus, the accuracy of the detected learning style may be less.
Learning style is not dynamic; it does not change at regular intervals. But there is always a better way of learning different things in different ways. It is better to analyse the learning style of the learner at regular intervals, and the learners may not want to fill the long questionnaires again and again. There must be a method that uses intelligent techniques to identify the learning style of the learner automatically. The significant challenges in the area are that; researchers have been using the item response theory with questionnaires to identify the learning styles of the learners. Another problem identified during the review was that researchers overlook one or two dimensions of the Felder-Silverman model of learning styles. A third problem points out that many learning style models are also not explored by the researchers. Researchers have been working in this area of automatically detecting the learning style of the learners for a long time. Some of the work is reviewed and presented in the next section. The organization of this paper is as follows: the next section, section 2, shows the literature review, section 3 presents the proposed methodology. Section 4 discusses the implementation and results; section 5 discusses the conclusion and future work, which is followed by references.
2. Literature review
Before discussing the methods used to identify the learning style, a quick account of what is learning style, thinking style, learning patterns, characteristics of learners with a particular learning style, whether they are malleable or not, and learning styles in online learning is needed. In addition to the learning style models discussed in the previous section, there are a few researchers in the area whose work is worth discussing. Among them is Jan D. Vermunt, who proposed an integrated approach to learning style. The final version of the questionnaire he designed consisted of 120 questions that cover the following learning components: cognitive processing strategies, metacognitive regulation strategies, conceptions of learning, and learning orientations(Vermunt & Vermetten,
5 2004). There are various scales and values in the questionnaire, in the first component, we have deep processing and step-wise processing, and in turn, each of them has different extremes. The regulation strategies have two scales self-regulation and external regulation with their values. The questionnaire helps us gain a complete insight into a learner's mind; it has high validity and reliability and has been widely used. However, a questionnaire of this kind, and depth, seems difficult to understand in an online learning context. Few of its concepts, such as external regulation and learning orientations even when monitored in online learning, are challenging to include in online learning, and it would use up resources. Extensive research must be done to see how this can be incorporated into online learning.
Learning styles and their malleability has been researched and discussed by Zhang (L. F. Zhang, 2011), where the researcher has discussed how learning style is affected by culture. Cognitive styles are also malleable, as proven by Angeli and group, using an experiment with children aged 6 to 7 years (Angeli et al., 2016).
Researchers have been using different methods and have based their research on different learning style models.
Some of the approaches to identify learning style and the frequency of usage of learning style models by various researchers are summarized in this section. Researchers have results that prove the link between learning style and academic performance(Lynch et al., 1998), (Komarraju et al., 2011), and (Cassidy & Eachus, 2000).
Researchers have proposed many artificial intelligence techniques to detect the learning style of the learners automatically. There are two different approaches defined by Graf et al. (Bernard et al., 2017) literature-based and data-driven approach for automatic detection of learning style. Data-driven strategies aim at building classifiers based on the data.
Literature-based approaches use the user model to get hints from it and generate simple if-then rules to detect the learning style. The evidence of researchers using literature-based methods can be found in (Carver et al., 1999), (Dung & Florea, 2012; S. Graf et al., 2010; Sabine Graf, 2006; Latham et al., 2012; Popescu, 2009) and (Sangineto et al., 2008). The researchers using data-driven approaches have used different classification algorithms such as Bayesian networks, Decision Trees, Neural Networks, and other models. All these methods extracted some attributes from the user behaviour and built classifiers using the extracted data.
Alkhuraiji et al. (Alkhuraiji et al., 2011), Carmona et al. (Carmona et al., 2008), and Garcia et al. (P García et al., 2008; Patricio García et al., 2007) are the researchers that have built Bayesian networks to detect learning styles.
Decision Tree is a method that works in two phases, first building the tree and then pruning the tree. A decision tree was used by the following researchers Ozpolat and Akar (Özpolat & Akar, 2009), Crockett et al. (Crockett et al., 2017), and Cha et al. (Cha et al., 2006). The neural network is a machine learning technique that is based on the concept of neurons and the learning capability of the human brain. Neural networks have been used by the following researchers to recognize learning style: Kolekar et al. (Kolekar et al., 2010), Villaverde et al. (Villaverde et al., 2006), Georgiou and Makry (Georgiou & Makry, 2004), and others. Some of the recent work which has been done in this area is summarized in table 2
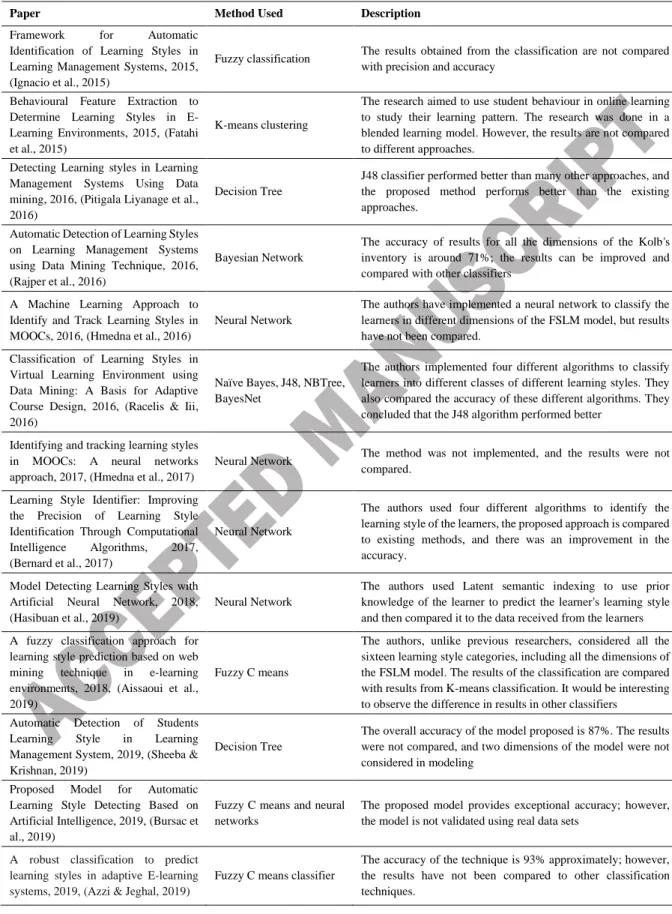
The table below summarizes the methods and the shortcomings of the reviewed papers in the area of automatic detection of learning styles. These papers have used different types of learning style theories. Most of the papers reviewed and summarized in table 1 have used the Felder-Silverman model, and they are Marquez et al. (Ignacio et al., 2015), Liyanage et al. (Pitigala Liyanage et al., 2016), Hmedna et al. (Hmedna et al., 2016) (Hmedna et al., 2017), Maaliw (Racelis & Iii, 2016), Bernard et al. (Bernard et al., 2017), Aissaoui et al. (Aissaoui et al., 2019), Sheeba and Krishnan (Sheeba & Krishnan, 2019), Bursac et al. (Bursac et al., 2019) and Azzi et al. (Azzi & Jeghal,
6 2019). Fatahi et al. (Fatahi et al., 2015) used the Meyers Brigg Test Indicator, Rajper et al. (Rajper et al., 2016) used the Kolb's experiential learning model and Hasibuan et al. (Hasibuan et al., 2019) used the VAK model.
Table 2: A Summary of the Current Work in the Area of Automatic Learning Style Detection
Paper Method Used Description
Framework for Automatic Identification of Learning Styles in Learning Management Systems, 2015, (Ignacio et al., 2015)
Fuzzy classification The results obtained from the classification are not compared with precision and accuracy
Behavioural Feature Extraction to Determine Learning Styles in E- Learning Environments, 2015, (Fatahi et al., 2015)
K-means clustering
The research aimed to use student behaviour in online learning to study their learning pattern. The research was done in a blended learning model. However, the results are not compared to different approaches.
Detecting Learning styles in Learning Management Systems Using Data mining, 2016, (Pitigala Liyanage et al., 2016)
Decision Tree
J48 classifier performed better than many other approaches, and the proposed method performs better than the existing approaches.
Automatic Detection of Learning Styles on Learning Management Systems using Data Mining Technique, 2016, (Rajper et al., 2016)
Bayesian Network
The accuracy of results for all the dimensions of the Kolb's inventory is around 71%; the results can be improved and compared with other classifiers
A Machine Learning Approach to Identify and Track Learning Styles in MOOCs, 2016, (Hmedna et al., 2016)
Neural Network
The authors have implemented a neural network to classify the learners in different dimensions of the FSLM model, but results have not been compared.
Classification of Learning Styles in Virtual Learning Environment using Data Mining: A Basis for Adaptive Course Design, 2016, (Racelis & Iii, 2016)
Naïve Bayes, J48, NBTree, BayesNet
The authors implemented four different algorithms to classify learners into different classes of different learning styles. They also compared the accuracy of these different algorithms. They concluded that the J48 algorithm performed better
Identifying and tracking learning styles in MOOCs: A neural networks approach, 2017, (Hmedna et al., 2017)
Neural Network The method was not implemented, and the results were not compared.
Learning Style Identifier: Improving the Precision of Learning Style Identification Through Computational Intelligence Algorithms, 2017, (Bernard et al., 2017)
Neural Network
The authors used four different algorithms to identify the learning style of the learners, the proposed approach is compared to existing methods, and there was an improvement in the accuracy.
Model Detecting Learning Styles with Artificial Neural Network, 2018, (Hasibuan et al., 2019)
Neural Network
The authors used Latent semantic indexing to use prior knowledge of the learner to predict the learner's learning style and then compared it to the data received from the learners A fuzzy classification approach for
learning style prediction based on web mining technique in e-learning environments, 2018, (Aissaoui et al., 2019)
Fuzzy C means
The authors, unlike previous researchers, considered all the sixteen learning style categories, including all the dimensions of the FSLM model. The results of the classification are compared with results from K-means classification. It would be interesting to observe the difference in results in other classifiers
Automatic Detection of Students Learning Style in Learning Management System, 2019, (Sheeba &
Krishnan, 2019)
Decision Tree
The overall accuracy of the model proposed is 87%. The results were not compared, and two dimensions of the model were not considered in modeling
Proposed Model for Automatic Learning Style Detecting Based on Artificial Intelligence, 2019, (Bursac et al., 2019)
Fuzzy C means and neural networks
The proposed model provides exceptional accuracy; however, the model is not validated using real data sets
A robust classification to predict learning styles in adaptive E-learning systems, 2019, (Azzi & Jeghal, 2019)
Fuzzy C means classifier
The accuracy of the technique is 93% approximately; however, the results have not been compared to other classification techniques.
7 Since the prediction and classification involve machine learning models and algorithms, a short account of machine learning and its models and details of models are mentioned in this and the following paragraph. Machine learning is a convergence of statistics and computer science wherein machines learn to improve performance from their previous experience, a manner similar to humans. The only difference is that computers learn from data, and humans learn from situations and experiences(Bishop, 2006). Machine learning consists of 3 types of learning algorithms, supervised, unsupervised, and reinforcement learning. Supervised learning happens when data along with labels are supplied to the computer as input; the machine learns patterns from it and tries to predict the label of newly provided data. For example, depending on the temperature, humidity, precipitation, and other weather factors, the computer will predict whether it will rain today or not after learning from the data. Unsupervised learning doesn't come with any labels; the machine has to study the patterns in the data and group them into groups according to the characteristics of the data. For example, tagging of tweets automatically under different types of subjects. Reinforcement learning works on the concept of reward theory; from a particular state, a machine moves forward if the solution is correct or goes back to the previous state if the solution is wrong. (Marsland, 2015) Classification is a technique wherein we divide the data into classes and give a label to it. There are many algorithms in machine learning to perform classification. The basic ones are Naïve Bayes, Support Vector Machine, K-Nearest Neighbours classifier, Decision Trees, and Logistic Regression. Then there are ensemble algorithms such as random forest, Ada Boost, and Bagged Classifier(Kotsiantis et al., 2007). There are approaches to using artificial neural networks for classification, and they outperform every other machine learning algorithm.
There are problems associated with it. Some of the issues are the ad hoc nature of the neural networks, the requirement of a large dataset, missing validation procedures. Other challenges are getting the perfect weights;
time for convergence is large even when we solve simple problems; a lot of hardware is required (Vemuri, 1993).
Although a lot of issues are already solved, some of these exist, and neural networks are a tough choice when data is less.
Classification in machine learning is used to make predictions after the machine has already learned from data.
There are a lot of applications of classifications, serious ones such as disease prediction, traffic monitoring, and simpler ones such as spam email detection, and games (Bernadó-Mansilla & Garrell-Guiu, 2003). Naive Bayes classifiers are a collection of classification algorithms based on Bayes' Theorem. The algorithms share a universal principle that every pair of features being classified is independent of each other (Rish, 2001). A Support Vector Machine (SVM) is a supervised machine learning algorithm that can be employed for both classification and regression purposes. SVMs are based on the idea of finding a hyperplane that best divides a dataset -when plotted on the graph into two classes (Hsu et al., 2003). K-nearest neighbours (KNN) algorithm uses 'feature similarity' to predict the values of new data points, which means that the new data point will be assigned a value based on how closely it matches the data points in the training set (Sutton, 2012). Decision Trees are flowchart like structures, for predicting a class label for a data point, we start from the root of the tree. We compare the values of the root attribute with the data point's attribute. Based on the comparison, we follow the branch corresponding to that value and jump to the next node (Kearns & Mansour, 1999). Each algorithm has parameters that need to be fine-tuned to achieve optimal results of accuracy, precision, recall, and other metrics during the testing and the training phase.
8 Problems Identified
The authors, in their previous work in (Rasheed & Wahid, 2019), proposed a neural network for the identification of learning styles based on multiple intelligences. The proposed method was not validated, and when it was validated, it generated inaccurate models. Hence, to overcome the problems that occurred from the previous research, this work has been proposed, trained, and validated. A lot of work has been done in the area of learning style detection; the below problems are predominant in the area.
• Real datasets have not been used for the validation of the proposed models.
• In some publications, the models have not been compared to others for accuracy, precision, and recall
• Most of the papers that used the FSLM learning style model mostly skipped either one or two dimensions of the model
• Most of the publications we reviewed worked with the Kolb's learning style inventory and FSLM model;
a very few of them used Gardner's theory of multiple intelligences.
3. Methods
The study initially focussed on studying learning style models, their dimensions, values, and combinations of values to identify the learner's learning styles. The study by Jegatha and group (Jegatha Deborah et al., 2014), helped us to understand the link between the theory of learning styles and e-learning. Other interesting studies in (Özpolat & Akar, 2009), (Khan et al., 2018), and (Santo, 2006) discussed common behaviour, learning preferences, recall and retention rates, efficiency and performance of learners with various learning styles. A study (Huang et al., 2012) analysed the performance of learners when they learnt using resources according to their learning style. The study is promising as it proves that presenting learners with customized resources to learn betters their performance. There is a study on linking multiple intelligences and online learning activities (K.
Zhang & Bonk, 2009) helped us identify what learners with various learning styles preferred to do in an online learning system. Students' typical choice of resources, the time taken to learn each concept using their choice, their performance in assessments and other learner attributes were observed. We then extracted indicators from learner's online behaviour that will help us to predict their learning style. After the extraction of learner behaviour from learner logs, we preprocessed it. The processed data was then passed as input to the machine learning classifiers. The Recognition system is based on machine learning classifiers which predict the learning style of the learner based on the inputs provided. The indicators and attributes are mentioned in table 3 and table 4. The extraction of indicators is necessary because we want to eliminate the use of questionnaires to identify the learning style. To prove the elimination of the use of questionnaires, we evaluate the consistency of questionnaire-based identification and the predicted learning style using the proposed attributes and trained model. The predicted learning style can be used to personalize the learning resources and recommend them specific resources that cater to their learning styles so that learning is optimal.
The proposed methodology is an extension of our work done in (Rasheed & Wahid, 2019). In the paper, we proposed attributes to recognize the type of intelligence based on the theory of Gardner's theory of multiple intelligences. We proposed a neural network architecture to recognize the intelligence, and the intelligences was linked to learning styles. In this paper, we extend the work. Our earlier article didn't implement the proposed work; when we wanted to extend and peruse the work using deep learning, we were not able to achieve the desired accuracy. Deep learning works best with a large dataset, our dataset was small and the trained network overfitted.
9 To avoid this overfitting and reduce the use of computational power, we preferred not to use deep learning, and hence we made feature selection and removed attributes that had a negative correlation with the output class. With a more in-depth study of literature and the earlier identified attributes, we then shortlisted some attributes. After removing some attributes from our previous work, we add new attributes. We also observe attributes that help to identify a learner's behaviour in a discussion forum. The research proposed in this paper follows the research design shown in Figure 1. This module is a part of a more extensive system that performs the sequencing of learning resources.
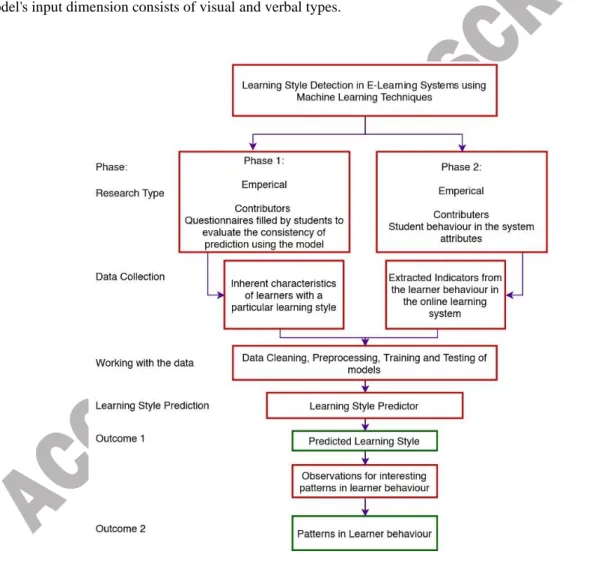
The research follows an experimental research design; the contributors of data are the usual behaviour of the learner with a specific learning style and student behaviour attributes in the E-learning system. Data is collected both through literature review and through online logs of learners in the system. The data collected from learners of various classes intended to check whether our trained model can correctly predict their learning style using the proposed attributes or not. For instance, learner 'A' filled the questionnaire initially. A's behaviour is tracked in the online learning system. The indicators to extract the proposed attributes are taken from log files. The trained model then uses the indicators to predict A's learning style. Finally, to evaluate the consistency of the proposed method, the results of the questionnaire and the predicted value is equated. If they are equal, the model is consistent, if not, the model is not consistent. The percentage of consistency for each dimension is discussed in the discussion section. The data and the study do not aim to compare the learning styles of learners from different classes. The study rather focusses on developing a machine learning model to predict the learning style of learners.
The data is then cleaned, pre-processed; machine learning models are trained and tested to make predictions. The predictor predicts the learning style of the learner, which is the first outcome. The outcome of exciting patterns in learner behaviour with respect to learning style is achieved by carefully observing the learner logs in different situations.
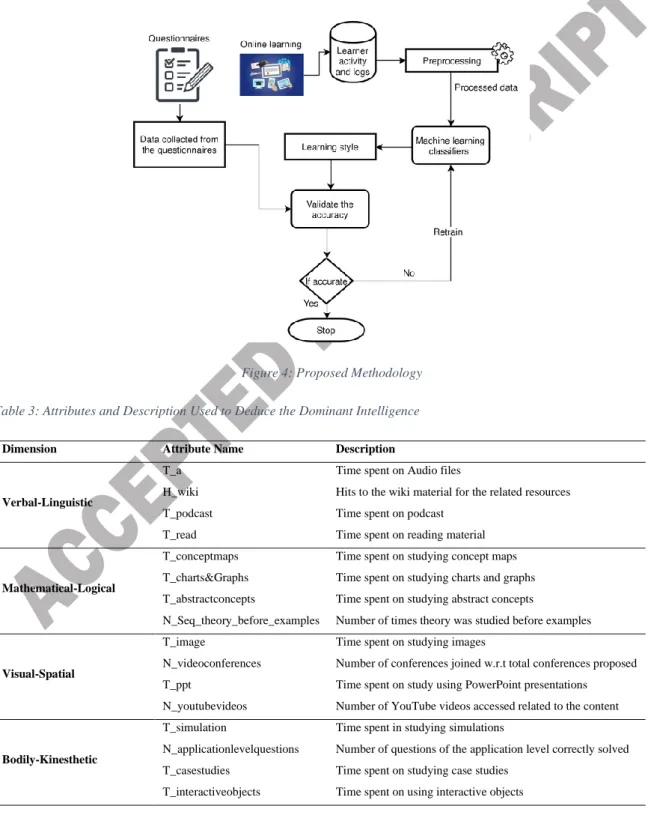
The research methodology followed to predict the learning style is presented in figure 2, which summarizes the steps taken to detect the learning style of the learner. The actions performed are typical to any data science- oriented machine learning technique used for classification and prediction.
The learners were presented with questionnaires before they began a course, on condition of anonymity, about two hundred students of various classes in a university participated in the experiment. They then started a course on Moodle, which was modified to observe the multiple attributes. The learner activity is monitored from the log facility in Moodle. The unprocessed data was collected, and processing was done to clean the data. The processed data was then used to train and test the classifiers. The classifiers we implemented were decision trees, Support Vector Machines, K-Nearest Neighbour, Naïve Bayes, Linear Discriminant Analysis, Random Forest, and Logistic Regression.
These algorithms are commonly used for classification in machine learning; when the models are trained with enough data, they can be used for prediction. A short account of these algorithms and their working is discussed in the literature review section. Using some attributes from our previous work and proposing new attributes, the following attributes were identified. The attributes in table 2 and 3 may not be enough for this research, but they were selected because they can be either easily observed or derived from the learner logs. Making the attributes complex will create issues in the data collection phase, and a lot of coding should be done to make the interface observe more attributes. We try to analyse the learner's learning style according to two different learning styles
10 theories. The first theory is the theory of multiple intelligences, and the next one is the Felder-Silverman model.
Both these models are deemed efficient by sufficient proof in the literature to provide personalization in E- learning.
Tables 2 and 3 describe the attributes that were considered for the deduction of learning styles. We have made the following assumptions: We have used the relative time in comparison to the total files designated for particular content. Values are coded. If a learner spends 75% or more of the appointed time, value is 3. If the time spent is between 50% -75% value is 2, and below 50% value is 1. Table 2 contains the attributes used for the deduction of the learner's dominant intelligence defined in Gardner's theory of multiple intelligence. The common characteristic we used in different intelligence deduction is the learning gain which is defined as 𝐿𝑒𝑎𝑟𝑛𝑖𝑛𝑔𝑔𝑎𝑖𝑛= (∑𝑃𝑜𝑠𝑡𝑇𝑒𝑠𝑡𝑠𝑐𝑜𝑟𝑒− ∑𝑃𝑟𝑒𝑇𝑒𝑠𝑡𝑠𝑐𝑜𝑟𝑒)/∑𝑃𝑟𝑒𝑇𝑒𝑠𝑡𝑠𝑐𝑜𝑟𝑒 ((sum of pre-test score subtracted from the sum of post-test score ) divided by the sum of pre-test score)
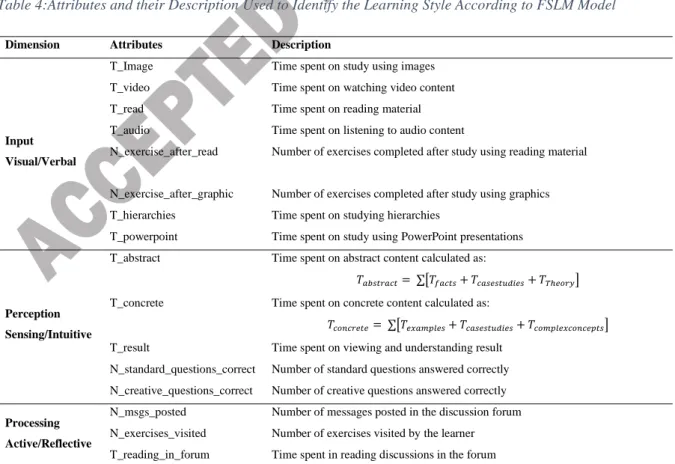
Table 3 consists of the attributes used for the FSLM model; attributes are repeatedly used because the FSLM model's input dimension consists of visual and verbal types.
Figure 3: Research Design
The inputs to the classification algorithm are the attributes in the normalized form; the data was
observed from the learner logs, and values were normalized as discussed earlier. The output classes
being the dominant value of intelligence. The attributes have been crafted after studying a lot of research
11
in the area, a study of media associated with each type of intelligence can be found in (Kolås & Staupe, 2007). Another example of designing a rule-base for e-learning recommendations using multiple intelligences is developed in (Kaewkiriya et al., 2016). Igbrue and Pathak(Igbrue & Pathak, 2008) created e-learning content using the Multiple intelligences theory with an attempt to increase the learning efficiency of learners. Authors in (Mankad et al., 2011) used fuzzy logic and evolutionary rules to build a hybrid system to detect the multiple intelligence of the learner. The rules or parameters have been identified using the characteristics of learners with each dominant intelligence, the media selection, the time they spent on each media, and others.
Figure 4: Proposed Methodology Table 3: Attributes and Description Used to Deduce the Dominant Intelligence
Dimension Attribute Name Description
Verbal-Linguistic
T_a Time spent on Audio files
H_wiki Hits to the wiki material for the related resources
T_podcast Time spent on podcast
T_read Time spent on reading material
Mathematical-Logical
T_conceptmaps Time spent on studying concept maps T_charts&Graphs Time spent on studying charts and graphs T_abstractconcepts Time spent on studying abstract concepts
N_Seq_theory_before_examples Number of times theory was studied before examples
Visual-Spatial
T_image Time spent on studying images
N_videoconferences Number of conferences joined w.r.t total conferences proposed T_ppt Time spent on study using PowerPoint presentations N_youtubevideos Number of YouTube videos accessed related to the content
Bodily-Kinesthetic
T_simulation Time spent in studying simulations
N_applicationlevelquestions Number of questions of the application level correctly solved T_casestudies Time spent on studying case studies
T_interactiveobjects Time spent on using interactive objects
12
Interpersonal-Intrapersonal
T_forum_reading Time spent in forum reading posts
N_posts Number of posts written or answered in the discussion forum N_groupdiscussions Number of group discussions joined
T_selfassess Time spent on self-assessment exercises
The FSLM model is a 11 points scale. If the score on a scale is 1-3, then the user has mild preference, 5-7 is moderate preference and 9-11 is strong preference. The studies discussed in the literature review section give us a picture of what learners with particular learning style do in online learning. If all/ most of the activities of the learner point towards the visual learning style, the learning style as predicted by the model is visual, and if all/
most of the activities of the learner point towards verbal learning style, the learning style as predicted by the model is verbal. This behaviour of machine learning models is common; machine learning models help in predicting the class of a learner according to the inputs supplied. However, these classifiers do not indicate the tendency or intensity of any class. If both the activities/ actions are equal then there is marking as visual-verbal. However, some ambiguities occur which will be resolved during our future work.
We collected data from graduate students studying a bachelor's degree in computer science. Metrics measures the quality of prediction performed by the machine learning algorithms. The most common metrics are accuracy, precision, recall, F1-score, cross-validation score, and area under the curve. There are metrics other than the mentioned above, but researchers use these while performing classification and prediction. The area under curve and cross-validation also explain to us whether the results are significant or not. For training, we chose 70% of the data; testing was done on 30% of data. For validation, we performed cross-validation, and its results are present in table 4 and table 5.
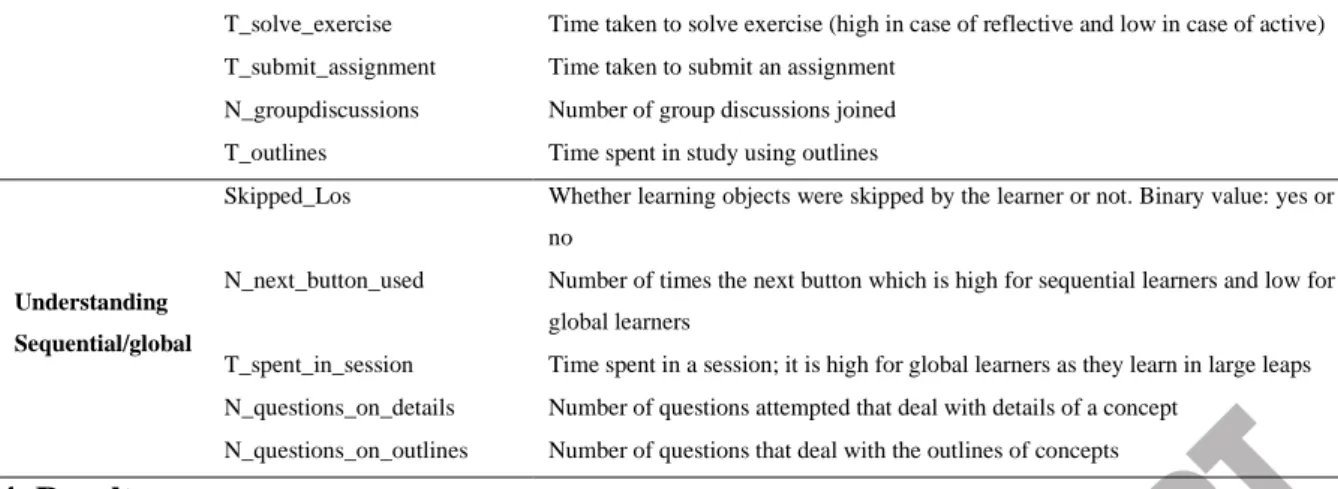
Table 4:Attributes and their Description Used to Identify the Learning Style According to FSLM Model
Dimension Attributes Description
Input Visual/Verbal
T_Image Time spent on study using images
T_video Time spent on watching video content
T_read Time spent on reading material
T_audio Time spent on listening to audio content
N_exercise_after_read Number of exercises completed after study using reading material
N_exercise_after_graphic Number of exercises completed after study using graphics T_hierarchies Time spent on studying hierarchies
T_powerpoint Time spent on study using PowerPoint presentations
Perception Sensing/Intuitive
T_abstract Time spent on abstract content calculated as:
𝑇𝑎𝑏𝑠𝑡𝑟𝑎𝑐𝑡= ∑[𝑇𝑓𝑎𝑐𝑡𝑠+ 𝑇𝑐𝑎𝑠𝑒𝑠𝑡𝑢𝑑𝑖𝑒𝑠+ 𝑇𝑇ℎ𝑒𝑜𝑟𝑦] T_concrete Time spent on concrete content calculated as:
𝑇𝑐𝑜𝑛𝑐𝑟𝑒𝑡𝑒= ∑[𝑇𝑒𝑥𝑎𝑚𝑝𝑙𝑒𝑠+ 𝑇𝑐𝑎𝑠𝑒𝑠𝑡𝑢𝑑𝑖𝑒𝑠+ 𝑇𝑐𝑜𝑚𝑝𝑙𝑒𝑥𝑐𝑜𝑛𝑐𝑒𝑝𝑡𝑠] T_result Time spent on viewing and understanding result
N_standard_questions_correct Number of standard questions answered correctly N_creative_questions_correct Number of creative questions answered correctly Processing
Active/Reflective
N_msgs_posted Number of messages posted in the discussion forum N_exercises_visited Number of exercises visited by the learner T_reading_in_forum Time spent in reading discussions in the forum
13
T_solve_exercise Time taken to solve exercise (high in case of reflective and low in case of active) T_submit_assignment Time taken to submit an assignment
N_groupdiscussions Number of group discussions joined T_outlines Time spent in study using outlines
Understanding Sequential/global
Skipped_Los Whether learning objects were skipped by the learner or not. Binary value: yes or no
N_next_button_used Number of times the next button which is high for sequential learners and low for global learners
T_spent_in_session Time spent in a session; it is high for global learners as they learn in large leaps N_questions_on_details Number of questions attempted that deal with details of a concept
N_questions_on_outlines Number of questions that deal with the outlines of concepts
4. Results
For the attributes identified for the theory of multiple intelligences, we collected a dataset with 498 samples from students taking online courses. The pre-processing was done. Then various classification algorithms such as decision trees, Support Vector Machines, K-Nearest Neighbour, Naïve Bayes, Linear Discriminant Analysis, Random Forest, and Logistic Regression were applied. We run the classifiers on the python kernel 3.1. To avoid overfitting (A problem where the trained technique predicts everything you enter into a particular class), we tuned the parameters of the classifiers using the GridSearch technique of hyperparameter tuning. The GridSearch technique helped us gain an understanding as to how the training and testing accuracy differs with automatic tuning. We then performed manual tuning of the parameters to achieve optimal results of accuracy, precision, and recall. The values of the trained parameters can be seen in table 5.
Table 5: Summary of Results for the Dataset Collected with Attributes Identified for the Theory of Multiple Intelligences
Algorithms Accuracy Precision Recall CV Score F1-score
Support Vector Machine 75.55% 73% 76% 74% 73%
Decision Tree 45.55% 41% 46% 39% 43%
Logistic Regression 73.33% 71% 73% 74% 72%
Random Forest 73.33% 74% 73% 68% 73%
K-Nearest Neighbours 67.77% 68% 68% 60% 67%
Linear Discriminant Analysis 69.44% 69% 69% 74% 69%
Naïve Bayes 70.55% 65% 71% 71% 65%
For the attributes identified for the Felder Silverman Learning style model, we collected a dataset with 498 samples from students taking online courses. The pre-processing was done, fit, and transform; the data were normalized between 0 and 1. We used the decision trees, Support Vector Machines, K-Nearest Neighbour, Naïve Bayes, Linear Discriminant Analysis, Random Forest, and Logistic Regression and to avoid overfitting; we performed tuning of the parameters. The algorithms were run on Python Kernel 3.1. Table 5 summarizes the accuracy of the various algorithms for different dimensions of the FSLM model.
14 Table 6: Summary of Results for the Dataset Collected with Attributes Identified for the FSLM Learning Styles Model
Input Dimension Processing Dimension
Algorithms Accuracy Precision Recall F1-
score Algorithms Accuracy Precision Recall F1- score Support
Vector Machine
85.22% 85% 85% 85%
Support Vector Machine
85.33% 86% 85% 85%
Decision Tree 80.13% 80% 80% 80% Decision Tree 83.33% 85% 83% 84%
Logistic
Regression 84.65% 84% 84% 84% Logistic
Regression 85.33% 86% 85% 85%
Random
Forest 80.13% 81% 80% 80% Random
Forest 82.66% 83% 83% 83%
K-Nearest
Neighbours 76.15% 76% 76% 76% K-Nearest
Neighbours 82.66% 83% 83% 83%
Linear Discriminant Analysis
83.44% 83% 83% 83%
Linear Discriminant Analysis
86.00% 86% 86% 86%
Naïve Bayes 77.48% 83% 77% 76% Naïve Bayes 86.66% 88% 87% 86%
Understanding Dimension Perception Dimension
Algorithms Accuracy Precision Recall F1-
score Algorithms Accuracy Precision Recall F1- score Support
Vector Machine
83.33% 83% 83% 83%
Support Vector Machine
91.33% 92% 91% 91%
Decision Tree 78.00% 79% 78% 77% Decision Tree 92.00% 92% 92% 92%
Logistic
Regression 82.00% 82% 82% 82% Logistic
Regression 91.33% 92% 91% 91%
Random
Forest 82.00% 82% 82% 82% Random
Forest 90.66% 91% 91% 91%
K-Nearest
Neighbours 84.66% 85% 85% 85% K-Nearest
Neighbours 88.00% 89% 88% 88%
15
Linear Discriminant Analysis
81.33% 81% 81% 81%
Linear Discriminant Analysis
90.66% 92% 91% 91%
Naïve Bayes 79.33% 80% 79% 79% Naïve Bayes 87.33% 87% 87% 87%
Table 7: Cross-Validation scores for each dimension and the algorithms
Algorithms Dimensions
Input Processing Understanding Perception
SVM 78% 83% 83% 89%
Random Forest 79% 77% 77% 91%
Decision tree classifier 73% 74% 74% 90%
Naïve Bayes 77% 76% 76% 86%
Logistic Regression 79% 80% 80% 87%
K nearest neighbour 76% 78% 78% 90%
Linear discriminant analysis 79% 79% 79% 86%
Cross-Validation scores
5. Discussions
To discuss the results, we need to first define the metrics we have used for evaluating the models and the proposed approach as compared to the self-report inventory of learning styles. Accuracy of a machine learning algorithm is the number of correct predictions divided by total predictions made; accuracy is specific to machine learning models. The number of positive predictions divided by the total number of positive class values that were predicted is precision. The recall is the number of positive predictions divided by the total number of positive class values in the test data. F1-score is the weighted average of precision and recall. The cross-validation score is used to check for the overfitting and underfitting in algorithms. Accuracy is a term that is specific to machine learning models. To compare the results of the proposed recognition system and the self-report inventory we used another metric. The metric chosen here is consistency. Consistency is used here as a measure of evaluating how correctly our proposed model predicts the learning style of the learner using the attributes. % Consistency ((correct predictions by machine/No of students from manual marking) *100). For example, if there are 45 students of the visual type identified in the manual marking, we check out of the 45 how many were correctly labelled as visual type using our proposed model.
From table 4, we can observe that, for the data collected from Gardner's theory of multiple intelligences, the algorithm that performs the best is the support vector machine with an accuracy of 75.55% and with close values of precision and recall. The cross-validation score is 74%. The cv score proves that irrespective of the 70-30 division of data or cross-validation, the accuracy of the algorithm will be around 76%, which is acceptable.
Therefore, in the final prediction of dominant intelligence in a real-time scenario, we used the support vector machines. An exciting future direction would be conducting a pilot study and then identify and reattribute characteristics for each dominant intelligence.
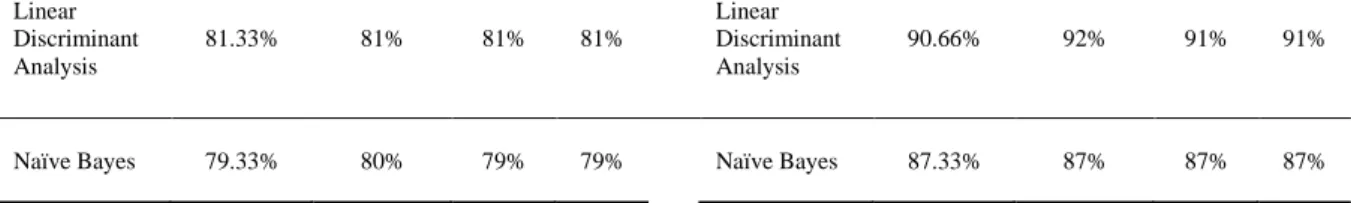
16 We can observe from the table 5 that, for the input dimension, the Support Vector Machine classifier has the highest accuracy of 85.22%. For the processing dimension, the Naïve Bayes performs better than the other algorithms. For the perception dimension, the Decision Tree Classifier performs better with 92% accuracy. For the understanding dimension, the results have improved when compared to Graf et al. (S. Graf et al., 2010) and the highest accuracy has been achieved in the case of the K-Nearest Neighbor Classifier.
The cross-validation score of each dimension and each algorithm is in table 6. It can be observed that even though the precision, recall, and accuracy values in size are the best for the support vector machine, the cross-validation score is only 78%. Other algorithms which have high cross-validation score are random forest, logistic regression, and linear discriminant analysis. In real-time detection in the input dimension, we preferred to use SVM. The reasons for doing so are that logistic regression and linear discriminant analysis are prone to overfitting. Unlike training data, real-time data might have some relationships that are complex and are not needed. For the processing dimension, Naïve Bayes performs the best concerning the accuracy, precision, and recall, but the cross-validation score says it all; it is far less than SVM, which performs third best when compared to Naïve Bayes. We preferred SVM for the real-time prediction as the cross-validation score of SVM is high when compared to all other algorithms. For the understanding dimension, we again preferred the SVM for the real-time prediction because its cross-validation score is the highest, and real-time data need not be similar to the datapoint from the testing or training datasets. For the perception dimensions, we used the decision tree, although improved accuracy with the decision tree means that the classifier has learned complex relationships. But when the cross-validation scores are observed, they are still high. Therefore, the decision tree classifier is used for real-time prediction.
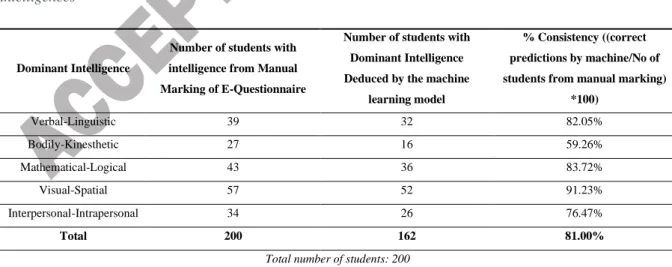
How will this benefit the practitioners and researchers? This question can be answered by discussing two crucial factors of this research. One, the difference and similarity between human marking and machine prediction. Two, the improvement in results in comparison to the previous researchers. Table 7 shows the consistency of manual marking and machine prediction for Gardner's theory of Multiple Intelligences
Table 8: % Consistency between manual marking and machine prediction for Gardner's theory of multiple intelligences
Dominant Intelligence
Number of students with intelligence from Manual Marking of E-Questionnaire
Number of students with Dominant Intelligence Deduced by the machine
learning model
% Consistency ((correct predictions by machine/No of students from manual marking)
*100)
Verbal-Linguistic 39 32 82.05%
Bodily-Kinesthetic 27 16 59.26%
Mathematical-Logical 43 36 83.72%
Visual-Spatial 57 52 91.23%
Interpersonal-Intrapersonal 34 26 76.47%
Total 200 162 81.00%
Total number of students: 200
Table 7 summarizes the % consistency between manual marking and machine prediction. Column 2 shows the number of students in each category of intelligence. As mentioned earlier, we excluded the intelligence for which
17 the observation was not possible in an online learning mode. Column 3 has the number of students with dominant intelligence by the machine. The last column calculates the % consistency. It can be observed that visual-spatial intelligence has the highest consistency. It also means that the attributes used to identify this intelligence are good.
This is followed by the Mathematical-logical and Verbal-Linguistic close behind. The bodily-kinesthetic performance has the least consistency; it may mean that the attributes are not enough for prediction; it may also mean that the algorithm needs to be fine-tuned more to get better results. This can be taken up as a direction in future work. The overall consistency of machine prediction as compared to manual marking is 81%.
Table 8 summarizes the % consistency of machine prediction as compared to manual marking for the FSLM learning style model. Values in the table are compared for each dimension and each style of learning in the dimension. For example, the first block consists of the costs for the Input dimension. With the manual marking, we had 113 visual students, and the machine predicted that 101 of them as visual, which is a consistency of 89.38%. Eighty-seven students were verbal from their questionnaires, and the machine prediction was 80, the consistency being 91.95%. The % consistency for all the dimensions ranges between 80% and 92%, which is acceptable. The consistency was least in the Understanding dimension, which may mean that either the model should be optimized or the attributes should be added during the prediction of this dimension.
Table 9: % Consistency between manual marking and machine prediction for the FSLM Learning style model
Dimension Value
Number of students with learning style from Manual Marking of E-
Questionnaire
Number of students with learning style Deduced by the machine
learning model
% Consistency ((correct predictions by machine/No of students from manual marking)
*100)
Input Visual 113 101 89.38%
Verbal 87 80 91.95%
Total-Input 200 181 90.50%
Processing Active 103 90 87.38%
Reflective 97 85 87.63%
Total-Processing 200 175 87.50%
Understanding Sequential 89 70 78.65%
Global 111 90 81.08%
Total-
Understanding 200 160 80.00%
Perception Sensing 116 103 88.79%
Intuitive 84 75 89.29%
Total-Perception 200 178 89.00%
Average consistency 694 86.75%
Total number of students: 200
Another view of this research helps to understand the different patterns of learner behavior during their course of online learning. The researchers made the following observations during and after the data was collected:
18 1. Although learning styles are considered to be static for a learner, and they generally do not change from time to time; During this research, we have observed some patterns of changes in the learning style of learners.
One such remarkable observation was the switch from verbal-linguistic to visual-spatial learning style based on the difficulty of the learning resource while analyzing learner's learning styles using Gardner's theory of multiple intelligences. Table 9 summarizes the change in the learning style of learners based on the difficulty of the learning resource.
Table 10: Summary of Patterns in Change of Learning Style of the Learners Based on the Difficulty of Learning Resource
Learning resource
(LR) Difficulty level Type of resource n(VL --> VS) n(VS --> VL)
% of learners with a change in learning style
LR 1 Easy Fact 1 120 51.05%
LR 2 Easy Definition 2 120 51.48%
LR 3 Intermediate Application of concept 40 10 21.10%
LR 4 Difficult Case Study 100 2 43.04%
LR 5 Difficult Creating knowledge 100 2 43.04%
LR 6 Difficult Problem solving 90 4 39.66%
LR 7 Easy Example 20 80 42.19%
LR 8 Difficult Proof of theorem 80 12 38.82%
LR 9 Easy Fact 4 90 39.66%
LR 10 Intermediate Definition 40 10 21.10%
LR 11 Intermediate Statement 10 20 12.66%
LR 12 Difficult Apply method to problem 60 16 32.07%
Number of Learners=498; n(VL)=104, n(VS)=133)
n(VL): Number of Verbal-Linguistic learners, n(VS): Number of Visual-Spatial Learners
2. The second observation during this study was the heavy dependence of learners on simulations, case studies, and application-level questions when difficulty level of the concept is high. To observe this pattern, we considered a total of 12 concepts, which were explained through 150 learning resources. There were five difficult concepts, for which the 200 students monitored; 15% of them used other resources, 35% of them preferred case studies, 26% used application-level questions, 24% used simulations. The graph in the figure below summarizes this.
Figure 5: Summary of Usage of Different Learning Resources when Studying Difficult Concepts 30
52 70 48
Number of students that preferred different resources when learning a difficult concept
Others Case Studies Application-Level Questions