Centroid images processed from the iQID large-area imager of the new gateless background. Unsupervised imaging results with hot 241Am (505.73 Ci) and large iQID count rate range in counts per.
Radiation Sources and Interactions with Matter
- Charge-particle energy loss mechanism
- A Coulomb Interactions
- B Emission of Electromagnetic Radiation (Bremsstrahlung)
- C Alpha Decay
- D Beta Decay
- E Photon Interactions (Gamma-rays)
- E.i Photoelectric Absorption
- E.ii Compton Scattering
- E.iii Pair Production
Several assumptions regarding the collision process concern the amount of energy transferred to the massive charged particle traversing the medium. The amount of energy lost due to the escape of the X-rays is equal to the X-ray photon energy.
![Figure 1: Schematic of Gamma-Ray Interactions and their corresponding energy regimes as a function of Z number of the material [16]](https://thumb-ap.123doks.com/thumbv2/123dok/11039389.0/29.918.215.707.111.440/figure-schematic-gamma-interactions-corresponding-regimes-function-material.webp)
Radiation Detectors: Semiconductors and Scintillators
- Semiconductors
- Scintillators
The particle's energy deposition leads to the formation of conduction electrons and valence holes within picoseconds along the ionization track. Within the active volume of the detector, when the particle stops completely, the number of electron-hole pairs produced is proportional to the incident energy of the incoming radiation.
![Figure 4: Insulators and semiconductor band structure for electron energies [16].](https://thumb-ap.123doks.com/thumbv2/123dok/11039389.0/34.918.190.747.272.574/figure-insulators-semiconductor-band-structure-electron-energies-16.webp)
Nuclear Safeguards and Applications
Inspectors may collect less than 10 slip samples (~300 slip samples per year) during their visit to a core-declared site [ 31 ]. The radioactive signatures obtained from these slide samples occur after the samples have been taken, checked and analyzed at the IAEA Clean Laboratory and NWAL.
![Figure 5: Image of the IAEA Clean Laboratory in Seibersdorf, Austria [25].](https://thumb-ap.123doks.com/thumbv2/123dok/11039389.0/38.918.206.714.514.861/figure-image-iaea-clean-laboratory-seibersdorf-austria-25.webp)
Digital Autoradiography and Technologies
This imaging device is a potential solution for digital autoradiography in protective measures due to its high frame rate, large area and real-time event processing. Real-time radioisotope devices (RRIs) (Japan) are the latest digital autoradiography devices used for protective measures [50].
Introduction
Signal Processing of the large-area iQID
- Phosphor Screens and Scintillators
- Fiber Optic Taper
- Image Intensifier
- A The Principal Operation of an Image Intensifier
- B Photocathode
- C Micro-channel Plate (MCP)
- Phosphor Screen
- Lens
The large area IQID has an image intensifier optically coupled to the small end of the fiber optic cone discussed earlier. The counting capability of the large-area iQID can be increased with a gated image intensifier.

Spatial Resolution-Line Spread Function
- Methods
This dissertation evaluated the intrinsic spatial resolution of the large-area iQID by measuring the line spread function (LSF) using commercial off-the-shelf (COTS) slits (LenoxLaser). The metric for spatial resolution was the full width at half maximum (FWHM) of the LSF, determined by Gaussian least-squares fitting, as previously done for a similar system [ 6 ]. On the other hand, the TranScreen LE phosphor screen and 10 μm glass slit were used for LAiQID beta spatial resolution measurements.
The spatial alpha resolution is 94.7 µm LSF FWHM with the 5 µm tungsten slit and 25 µm thick ZnS:Ag phosphor layer scintillator. The effective pixel size for spatial resolution measurements was 60 µm based on the CMOS pixel size magnification. Slit measurements and corresponding LSF FWHM data show differences in phosphor and plastic substrate thicknesses between ZnS:Ag and TranScreen LE, which may explain resolution differences; beta particles also travel farther than alphas, reducing the spatial resolution [37].

Energy Response
- Methods
- Results
- Discussion
Total internal reflection (TIR) (Figure 17) is the total reflection of glare between two transparent media in which incident light travels through the medium with a higher refractive index if the angle of incidence is greater than the limiting critical angle. On the other hand, the TranScreen LE phosphor screen does not collimate betas from 14C and gammas from 241Am. Therefore, these particles with a lower (less than 90o) angle of incidence have a lower energy resolution because particles lose energy through interactions with air and absorbing layers.
Instead, these sources were placed directly on the TranScreen LE's phosphor screen and relied on its high sensitivity for low beta. Alphas were not measured in beta/gamma mode as beta/gamma are not recorded as events in the alpha mode image (0.05 V intensification gain). Alphas therefore provide a saturation signal in the beta/gamma imaging mode that makes their presence easy to distinguish from beta/gamma.

Detection Uniformity
- Methods
- Results
- Discussion
The overall light collection efficiency decreased by a factor of two from the center to the edge of the cone. The collection efficiency for LAiQID drops by approximately two from the center of the taper to the edge. The bundle of coated fibers surrounding the taper transmits the elemental part of the high-resolution irradiation image via multiple fibers.
This reduction in light collection efficiency is likely due to light leakage and variations in the fiber optic taper and blur across the ZnS scintillator. However, this thesis did not perform a flat-field correction because the measured count rates and absolute efficiencies were not greatly affected by the non-uniform overall light-harvesting efficiency. Absolute efficiencies, unlike integrated light, did not change from center to edge of the scintillator because the intensity scintillation flashes were brighter enough to pass the lower detection threshold.

Detection Efficiency & Minimum Detectable Activity
- Methods
- Results
- Discussion
Based on the sources evaluated for this study, the lowest efficiency was measured for 14C, which emits the lowest energy betas (~50 keV average, 156 keV endpoint) and no gamma x-rays. The low absolute efficiency for low-energy betas demonstrates the low sensitivity of the large-area iQID for detecting low-energy betas. This result supports the overall findings, as the MCNP modeling results (Appendix) validated the same conclusion.
One exciting finding is the choice of TranScreen LE, as the scintillator supported the large-area iQID's ability to improve the absolute efficiency of low-energy betas. In addition, 210Pb is in secular equilibrium with another beta-emitter, 210Bi (mean 0.389 keV, endpoint 1.1614 MeV), and this isotope provides most of the detected signal.

Count-rate Capability
- Methods
- Results
- Discussion
Therefore, the main difference between both methods is the increased detector area due to the fiber optic taper. As shown in Figure 22 below, from Equation 18 above, the probability of two photons interacting at a certain distance (R) decreases with the fiber optic taper. The probability density function of two-photon interaction distances has a wider distribution with the fiber optic taper.
Two configurations for iQID imagers are 25 mm iQID (an image intensifier only) [6] and 100 mm large-area iQID imager containing a fiber optic taper and image intensifier. At 1,000 events per frame, the large-area iQID would have 132 overlapping events, while the smaller iQID had 856 overlapping events. The upper activity sampling ranges for the large-area iQID can be quantitatively imaged using experimental data with an analytical algorithm.
![Figure 22: Image compares the calculated probability density distribution. Two configurations for iQID imagers are 25mm iQID (only an image intensifier) [6] and 100mm large-area iQID imager that contains a fiber-optic taper and image intensifier](https://thumb-ap.123doks.com/thumbv2/123dok/11039389.0/90.918.191.733.159.434/compares-calculated-probability-distribution-configurations-intensifier-contains-intensifier.webp)
Dead Time
- Methods
- Results
In other words, only "dead" events detected in a paralyzed system can delay the detector's timing behavior and reduce dead time losses. In the paralyzable model, the second and third events (same as the fourth and fifth events) coincide, extending the dead time by one more. Calculation of corrected live times using knowledge of system dead times can improve the quantitative accuracy of a detector's performance.
Two beta sources previously characterized by the large-area iQID, 99Tc and 90Sr/90Y, were used to determine the dead time of the large-area iQID. The system dead time is evaluated using background and source observed event rates of the dual-source and dead time model types. These results provided insight into the characterized timing behavior (i.e., dead-time model) of the large-area iQID.

Chapter Conclusions
Spatial Pileup Analysis
- Imaging with HEXITEC and large-area iQID
Spatial stacking analysis was performed for the large area iQID and HEXITEC to further investigate the counting rate. As a result, the analytical spatial stacking algorithm calculates the average number of events per frame detected on the CMOS sensor. Once validated, the MC algorithm used characterized 241Am count data to calculate the spatial stacking for the large-area iQID.
Analytical MATLAB and the Monte Carlo algorithm plotted the number of spatial groups of pileup events versus the average number of event groups per frame for both detectors. The MC algorithm calculated spatial accumulation for HEXITEC (Figure 28) and large-area iQID (Figure 29). As expected, Fig. 29 shows a close match between the derived analytical solution and the MC spatial stacking algorithm for LAiQID.

Quantitative Imaging at Higher Count-rates
- Scenario 1: Effect of gating image intensifier on count-rate
- B Results: Beta Imaging Mode
- C Results: Alpha Imaging Mode
- D Discussion
- Scenario 2: Linearity of count-rate versus source activity
This demonstrated the effectiveness of the gated image intensifier on the count rates of the large area iQID. New, unsupervised large area iQID baseline background measurements (Figure 36) and 99Tc baseline measurements (Figure 39) were first performed. New baseline background measurements of the large-area gated iQID imager were performed to characterize the new system.
Baseline measurements for 99Tc were performed for the non-gated and gated imaging settings of the large-area iQID imager. This is approximately 5x the total number of non-occluded background measurements discussed above. New background measurements of the iQID large closed area imager alpha imager were performed to characterize the new system.
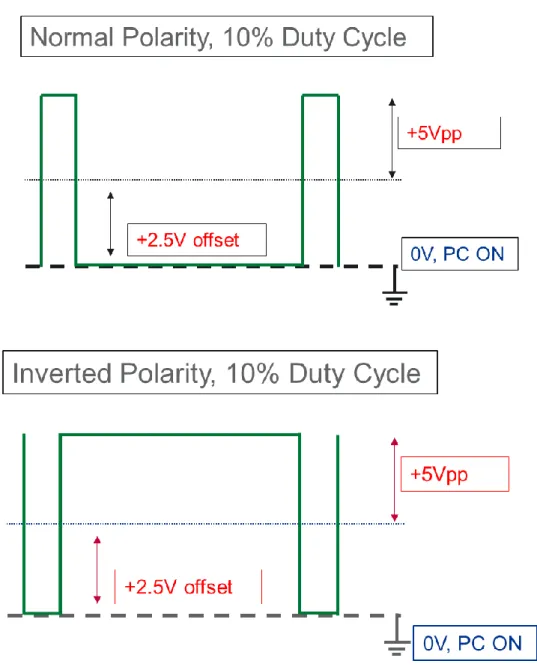
Overall, these results of the large-area iQID gating image intensifier showed its proper characterization. The iQID large area imaging shutter also imaged the 241Am hot source at 0.1% duty cycle.

Particle and energy discrimination
- Introduction
- Methods
- Results
- Discussion
I assume that clustering intensity and area would be better suited for particle and energy discrimination with the large-area iQID imager. Isolate beta/gamma emissions in the large-area iQID imager using ROI analysis of characterized energy response data and applying data cuts based on cluster area and cluster intensity. This new chart can be used to determine the figure of merit for beta/gamma discrimination with the large-area iQID imager.
The high spatial resolution of the large-area iQID imager makes it possible to see characteristic source differences. This shows that the cluster area was a suitable option for distinguishing beta and gamma events in the large-area iQID imager. To test this potential capability, post-processing MATLAB metrics were used to analyze the large-area iQID imager image data.

Image Co-registration
- Introduction
- Methods
- Results
- Discussion
Changes to the autoradiograph image and the photograph will take place directly in the image domain. The co-registered image of the autoradiograph and the photograph of the uranium glass shapes is shown in Figure 79. In Figure 79, the automated image co-registration scheme was successful on the left side of the image because the co-registered image shows the features of both images.
Until this dissertation, the image co-registration technique has not been applied to large-area iQID. The geometric transformation was greatly improved by applying these intensity and spatial methods to the image co-registration scheme. This further improved co-registration optimization, leading to a successful co-registered autoradiograph image and photograph.
![Figure 75: Process flow chart of intensity-based automatic image registration classification [67]](https://thumb-ap.123doks.com/thumbv2/123dok/11039389.0/181.918.232.674.92.456/figure-process-chart-intensity-based-automatic-registration-classification.webp)
Electrostatic Air Precipitator Film Imaging with iQID
- Introduction
- Methods
- Results
- Discussion
The imaging area is the significant difference between the iQID imagers: the large area iQID system and a smaller iQID system (image area ø 40 mm). These two methods will determine the utility of iQID imaging with an electrostatic strip sample. An image of the strip sample with electrostatically deposited 222Rn air particles can be seen in Figure 80.
This tape sample is printed on top of the input window of the large-area iQID. Next, the time-slice iQID imaging technique and Bateman equation were applied to analyze the electrostatic tape sample. This instability is essential to be aware of when making short-term half-life measurements with the large-area iQID.

Previous MCNP Modeling Study with Large-area iQID
Particle and Energy Discrimination on Smaller iQID system
- Properties of Phosphor Screens Used for Large-area iQID
- Current Operating Settings of LA-iQID
- Results of alpha and beta spatial resolution measurements for each slit
- Alpha and Beta MDA results of iQID imager, average background counts per area,
- Current Operating Settings of the large-area iQID
- Observed Results from the Two-Source Dead Time Measurement
- Comparison of the large-area iQID imager and
- Summary of the Cluster Intensity and Area Histograms for each Non-gated and Gated Measurement
- Results of ROI Analysis for Gated Inverted Polarity Measurements
- Source Information both 241 Am sources
- Theoretical Calculations for Spatial Pileup Analysis of 241 Am sources
- Imaging Results of Electrostatic Air Sample on the Large-area iQID
- Schematic description of how an X-ray escapes from material and its effect on the pulse-height spectrum
- Schematic Demonstration of Compton Scattering within a Material between an incoming incident photon
- Insulators and semiconductor band structure for electron energies [15]
- Image of the IAEA Clean Laboratory in Seibersdorf, Austria [25]
- Image of IAEA cotton swipe kit for environmental sampling [25]
- XRF map produced from the TRIPOD system. Darker colors indicate higher concentrations of Uranium
- Schematic demonstrating the difference in light collection efficiency between fiber-optically coupled
- Schematic operation of total internal reflection [52]
- Schematic design of single lens optical imaging system with from a phosphor screen output window to
- Schematic of tandem lens imaging system from the phosphor screen on the MCP to the CMOS readout
- Example 21 x 21 event cluster large-area iQID image of a Am-241 gamma source. Imaging parameters
- Schematic operation of Total Internal Reflection (TIR)
- Example of one event cluster image (21 x 21 pixels) for beta/gamma and alpha interactions of 241 Am (top)
![Figure 6: Image of IAEA cotton swipe kit for environmental sampling [25].](https://thumb-ap.123doks.com/thumbv2/123dok/11039389.0/39.918.190.729.290.612/figure-image-iaea-cotton-swipe-kit-environmental-sampling.webp)
![Figure 13: Schematic design of single lens optical imaging system with from a phosphor screen output window to CMOS readout device [53]](https://thumb-ap.123doks.com/thumbv2/123dok/11039389.0/65.918.96.749.599.955/figure-schematic-design-single-optical-imaging-phosphor-readout.webp)