Rainfall on Barro Colorado Island and seven other sites in the middle of the isthmus decreased significantly over time. -season forest and clearing temperatures on Barro Colorado Island have been elevated during each of the three El Nino events that have occurred in the past 16 years. Under the supervision of the Smithsonian Tropical Research Institute, the flora and fauna of Barro Colorado Island continue to be subjects of intense international scientific activity.
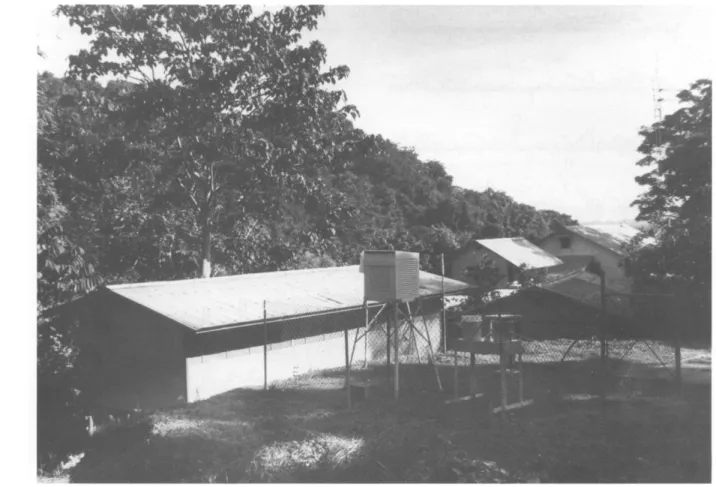
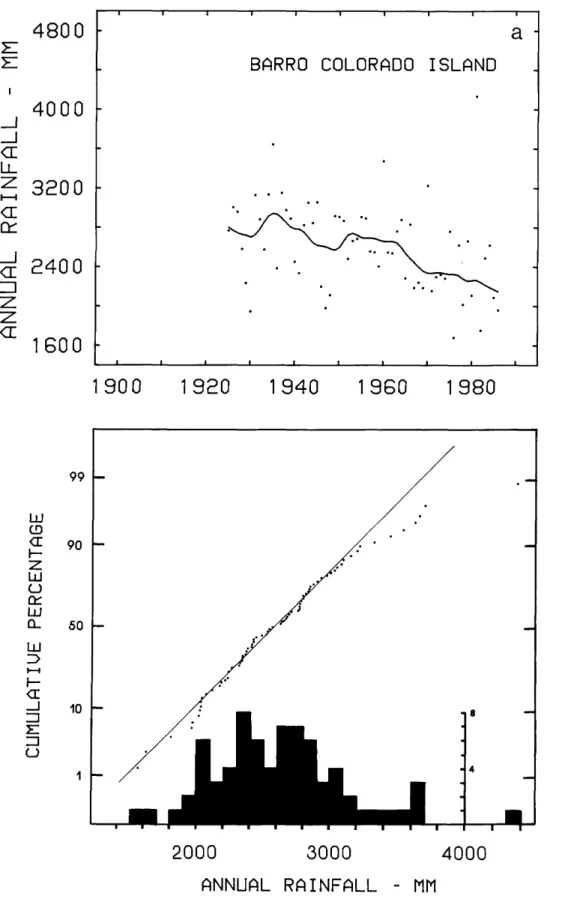
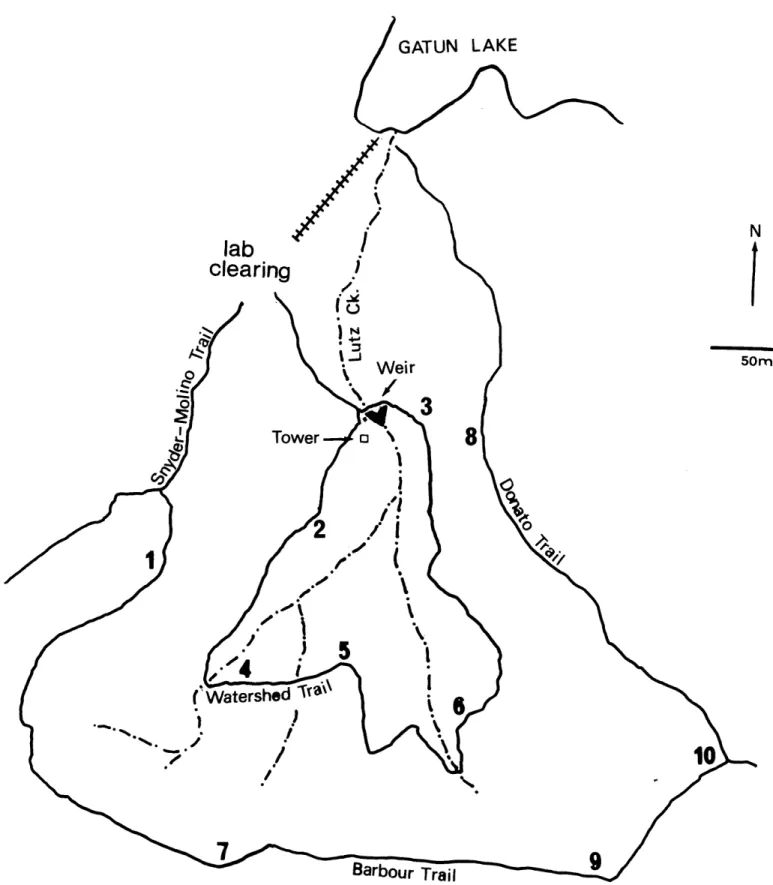
The Lutz Tower, located near the weir in the lower part of the watershed (Figure 2), provides data more representative of the forest on Barro Colorado Island. Using the slope of the least squares regression line as a trend indicator, rainfall on Barro Colorado Island appears to be decreasing at an average rate of 8 mm per year.
BARRO COLORADO ISLAND
ANNUAL RAINFALL - MM
2000 3000 4000 ANNUAL RAINFALL - MM
PPT = 1820 + S7*LAT R SQR=0.88
MONTE LIRIO
LATITUDE (MIN)
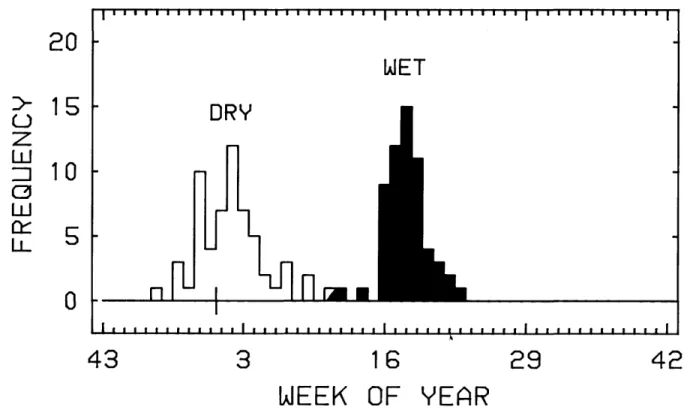
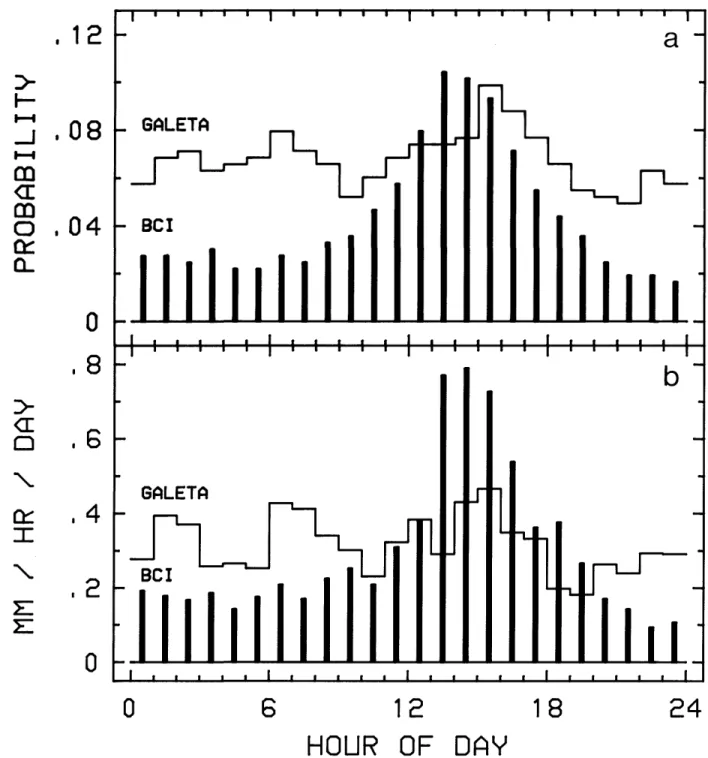
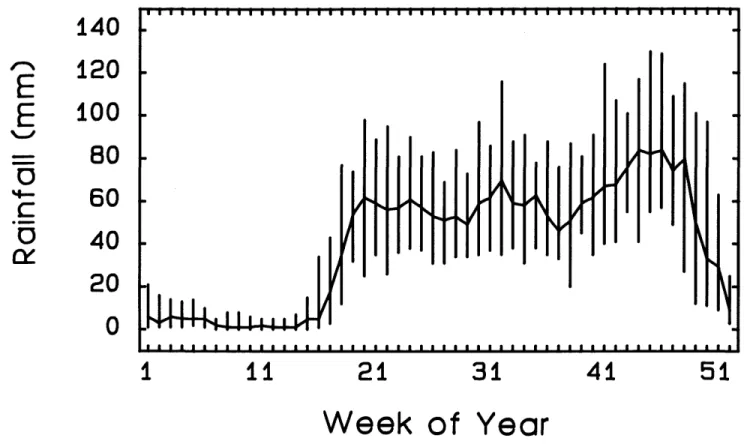
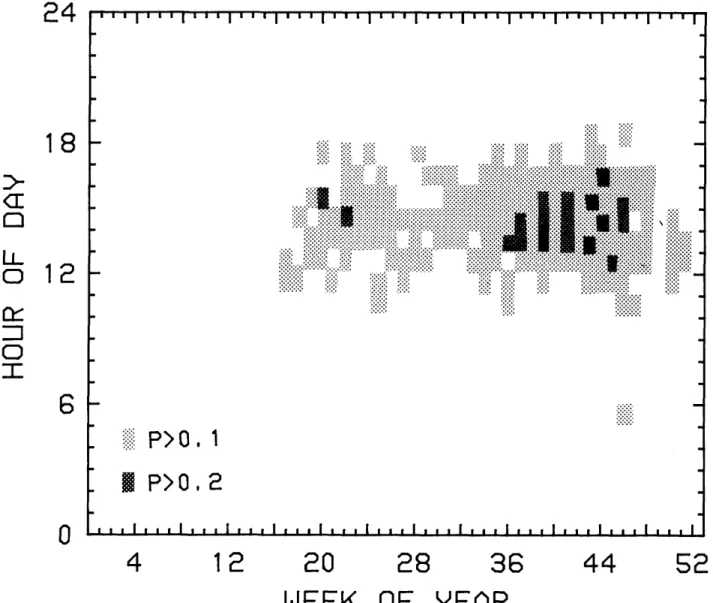
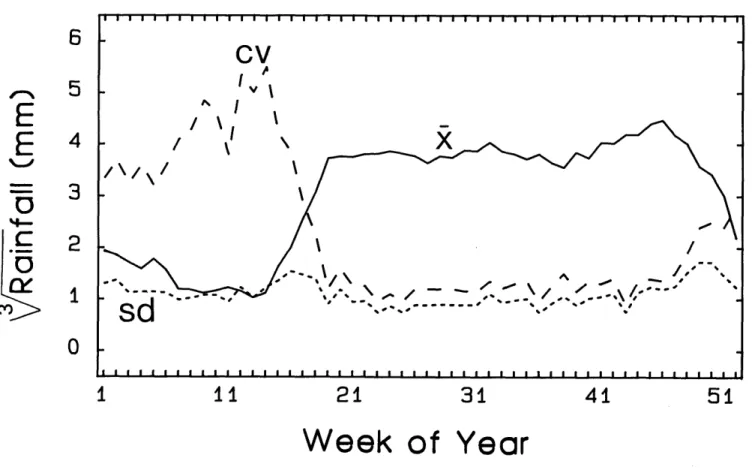
Although there are clearly variations in conditions, especially wet periods that occur during dry seasons, the method is fairly objective, as it agrees with most people's subjective sense of the changing tropical seasons on Barro Colorado Island. The march of daily probabilities of precipitation over the year follows almost the same pattern as the amount of precipitation by date (Figure 9). The convective nature of precipitation on Barro Colorado Island is clearly demonstrated by the highly non-uniform distribution (Figure 10).
The forested surface of Barro Colorado Island is quickly heated by the sun, causing the surrounding air to rise, cool, condense and release moisture as rain in unstable mid-afternoon tropical storm conditions. As air moves inland, it must rise, and the resulting "orographic precipitation" may explain the more uniform hourly distribution of precipitation observed along the Caribbean coast.
On Barro Colorado Island, much of the rain associated with a convective storm can fall within minutes, with storms lasting an hour or more (Figure 12). Between May 1983 and December 1985 there were 64 storms with precipitation totaling at least 25 mm, for which we have detailed data (Table 2). Maximum rainfall in one minute exceeded 30% of the total catch in 21 storms, and 50% in 8 storms.
Although intense rain can occur at any time during the storm, there is a strong tendency for the highest intensities to occur more frequently in the first half of the storm (41 of 64).
PROBAB
HOUR OF DAV
HOUR OF DAY
12.5 Total
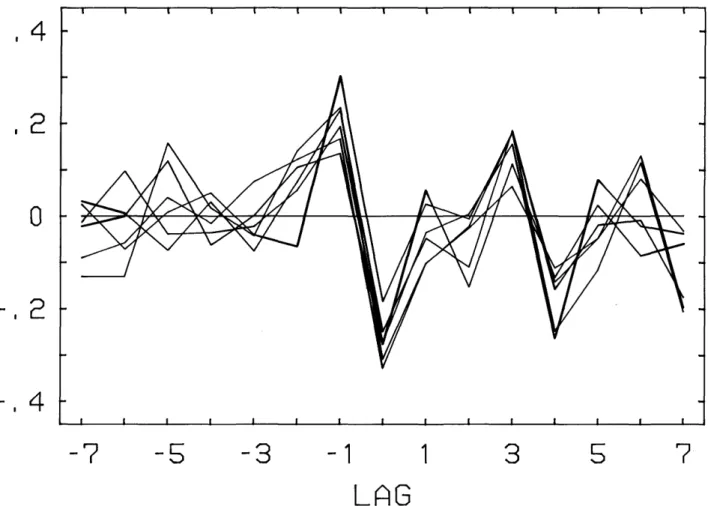
The appearance of El Nifio in the eastern Pacific near Panama* coincided with the early end of that year's wet season on the island of Barro Colorado and a dry season of unusual ferocity. First, the strong positive correlation with lag -1 indicates that Panamanian rainfall in one year is usually positively correlated with the El Nifio index in the following year. This is why Panama* tends to experience particularly heavy rains the year before a strong El Nifio develops.
Second, the strong negative correlation between rainfall and the El Nifio index with a lag of zero suggests that rainfall during El Nifio years in Panama is usually lower than normal. Annual rainfall therefore tends to shift from higher than normal to lower than normal before and during the expression of an El Nifio in Panama."
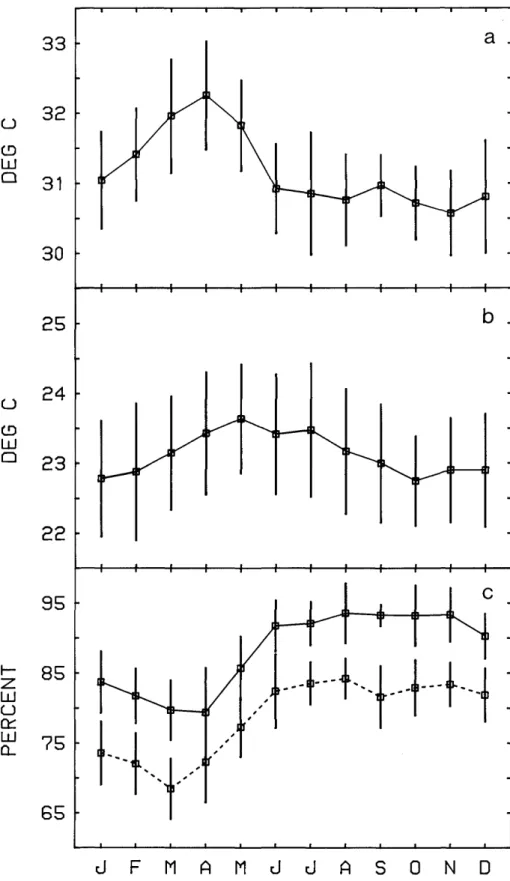
E L NINA CONNECTION.—El Nifio is a warm southerly flowing surface current that appears most years off the coast of Ecuador and Peru in December. El Nifio, perhaps the most powerful event this century, brought devastating drought to the rainforests of eastern Borneo (Leighton and Wirawan, 1986) and Malaysia (Ashton et al., 1988), overheating and death to the Pacific coast of Panama. " (Glynn, 1984), devastating storms and nutrient depletion of algal beds in southern California (Zimmerman and Robertson, 1985; Dayton and Tegner, 1984), and unusually high tides to the Pacific Northwest coast (Paine, 1986) While maximum temperatures peak in the late dry season, the lowest temperatures peak in the first three months of the wet season.
Maximum temperatures run one to four degrees C warmer in the open than in the woodland over much of the record. Maximum temperatures at 40 m are more or less the same as those measured in the open at 1.5 m (Figure 18).
RELATIVE HUMIDITY Appendix Tables C1-C9
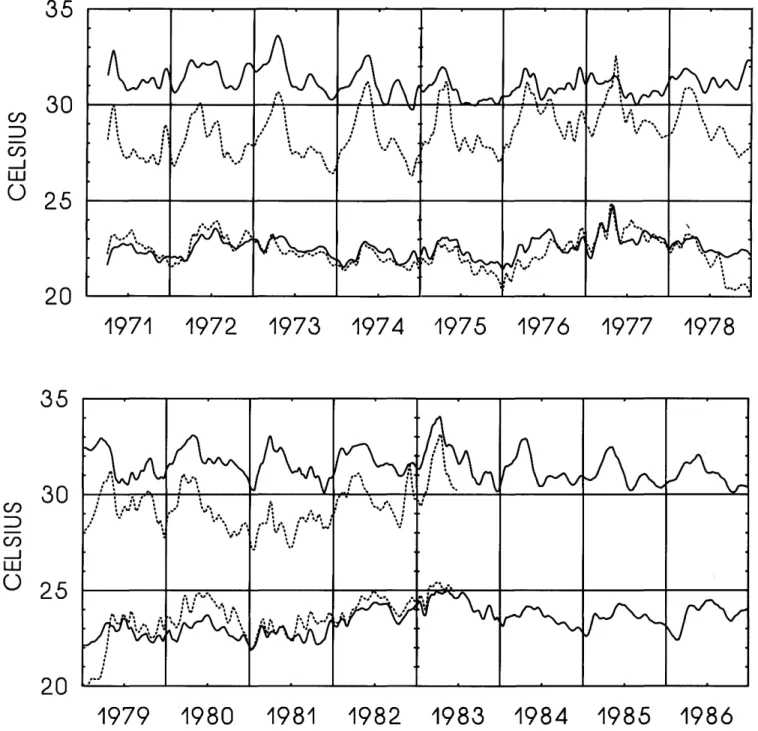
Minimum temperatures, on the other hand, do not appear to differ consistently between forest understory and laboratory clearings across the range, with the exception of 1980, when understory minimum temperatures averaged about half a degree higher than laboratory clearing minimum temperatures. The deep drop in forest minimum temperatures during the last three months of 1978 and first few months of 1979 is noteworthy. Maximum and minimum temperatures were recorded for slightly more than two years at heights of 1, 20 and 40 m above the forest floor on the Lutz tower.
Maximum temperatures at the upper canopy station are on average about 2 °C higher than readings near the forest floor. Thus, somewhere between the usual lowest and highest temperatures (05:00 and 13:00), the temperature structure of the forest air turns.
AIR MOVEMENT Appendix Tables D1-D5
The maximum temperature of the clearing and the forest are closest during the dry period of some years, perhaps during periods of canopy decline.
BCI - - - GALETA
In situ readings of midday wind speed were taken at four heights on the Lutz tower between July 1978 and August 1979 using a Thermonetics Series 102 hot-wire anemometer (Thermonetics Corp., San Diego, California) (Figure 21a). Galeta Point Marine Laboratory (also an MRI anemometer, Cubit et al., 1988) on the Caribbean coast are compared in Figure 23. Assuming that the instruments had roughly similar friction characteristics, the data show that the peak dry season winds on the island Barro Colorado are about one-third as strong as those along the Caribbean coast.
Wet season air movement on Barro Colorado Island is approximately 1/3 to 1/z of that recorded on the Caribbean coast. Discover midday wind speed measurements using a four-level hotwire anemometer on the Lutz Tower between August.
FOREST
CLEARING
DAILY MIN-MAX TEMPERATURES
I1IN MAX
CLEARING-1M
They also show the early onset of the trade winds in November 1982, which accompanied the onset of the El Nino event, which lasted until mid-1983.
SOLAR RADIATION Appendix Tables E1-E3
Relative Humidity in Clearing
GEOLOGY AND SOIL CHARACTERISTICS
A stream with a broad, flat bedrock bed cuts through the lower part of the catchment and gives no indication of a significant outlet for water from the catchment other than through the spillway. Soil samples were removed from ten sites in the catchment (the same sites from which soil moisture is monitored) and ten sites on the plateau in 1983, and physical characteristics were determined in laboratories at the Univer-. The soil in the Lutz catchment and the island plateau appear to have about the same silt content (25%-27%).
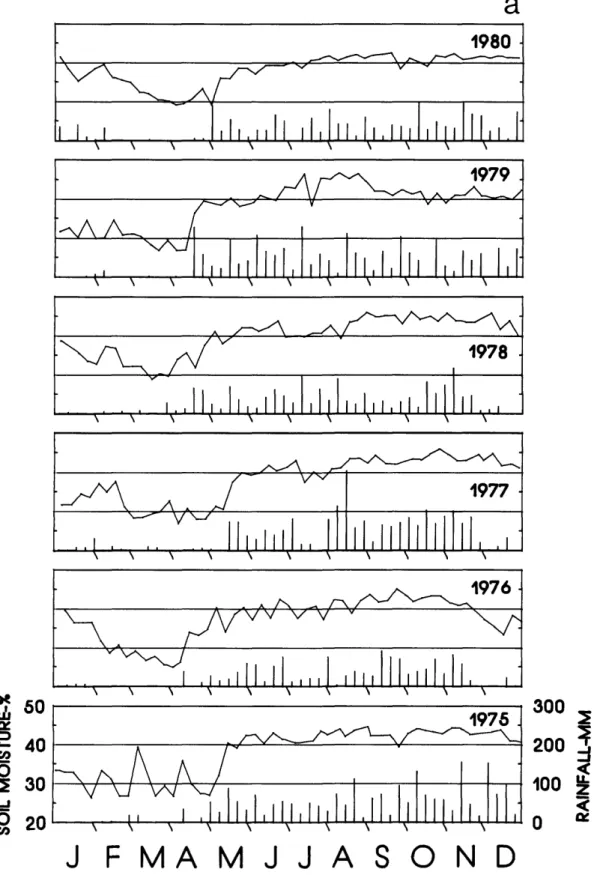
Soil moisture content of the Lutz watershed was determined gravimetrically at one- to two-week intervals from December 11, 1974 to the end of 1989 (Figure 25). From the beginning of the survey until October 1979, two soil moisture plugs were removed from the top 5 cm of soil at each of five stations along a 20 m transect in the lower watershed (see station in Figure 2).
PPM Na
Where two lines appear on a graph, the lower indicates soil moisture at 30-40 cm, the upper indicates soil moisture at 0-10 cm.
MTT 1
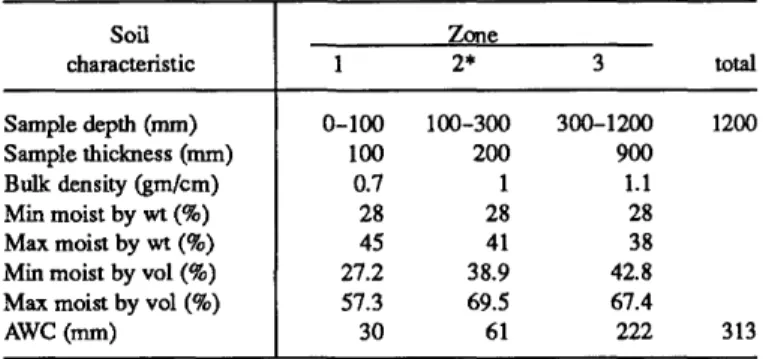
Bulk density appears to vary with depth, according to the unpublished report on the soils of Barro Colorado Island by Michael Keller. 34;Available moisture" is defined as the amount of water in the soil that can potentially be extracted by plants. Available moisture is calculated as the soil depth times the portion of the depth occupied by water (i.e. VSM).
In this study, an average soil depth of 1.1 m is assumed as in Dietrich et al. 1982); however, since both surface (0-10 cm) and deep (30-40 cm) soil moisture measurements were taken, the total available moisture can be adjusted to reflect actual differences. Soil moisture and bulk density for 10–30 cm are assumed to be the arithmetic mean of the soil immediately above and below (Table 8).
15 25 35 DEPTH (CM)
DEPTH (CM)
PRECIPITATION
RUNOFF
STORAGE
Minimum values (dry season samples) achieved by deep samples are approximately the same as surface samples. When the rainy season begins, the moisture content of soil rises to 30-40 cm faster on the plateau than in the Lutz catchment. Movement of moisture is probably impeded or trapped by deep soils and an underlying andesitic shell as evidenced by the "swamp" on one part of the plateau.
RUNOFF Appendix Tables G1-G2
EVAPOTRANSPIRATION Appendix Table HI
EVAPORATION RATE (MM/DY)
The catchment received, on average, 2587 mm of rain per year during this period (1975 has been omitted due a gap in
In general, a 500 mm increase in annual precipitation leads to a 400 mm increase in runoff and a 100 mm increase in transpiration evaporation. Evaporation measured with a Class A pan in the laboratory clearing produced significantly lower values than the transpiration evaporation values obtained above from the moisture budget. While evapotranspiration rates in the pan were typically half of the actual evapotranspiration values during the wet season months, they were significantly higher than the actual evapotranspiration during the dry season months in the Lutz watershed.
Total evapotranspiration rates are likely to be useful as an index of forest evapotranspiration only if (1) the values are summed at intervals of at least one year and (2) if a correction factor is specified. How do estimates of evapotranspiration from Barro Colorado Island compare with those from other studies. Evapotranspiration is highest for the low-slope, high-precipitation watersheds of Maryland and Florida, and lowest for the forested mountain watersheds at Hubbard Brook, Walker Branch, and Coweeta.
Thus, there is still a relatively wide range of estimates of evapotranspiration (45%–81% of annual precipitation) for the Amazon basin. The earliest (McGinnis et al., 1968), conducted during wet season months in the Darien Province, reported that about 67% of the precipitation (1768 mm in 221 days) returned as either evaporation or transpiration. Read constructed a moisture budget for the forest of Isla de Maje" based on a two-year record of precipitation and canopy interception.
Estimates of evapotranspiration significantly lower than those for Barro Colorado Island were obtained during a 4-year study by the Panama Canal Commission on the Rio Agua Salud, an inland watershed about 9 km east of Barro Colorado Island (Table 11). . Across the data, the mean value from Barro Colorado Island appears to lie comfortably close to the major axis. Nevertheless, from a diverse collection of studies, some more thorough than others, it appears that evapotranspiration falls between 50 and 60 percent of precipitation in average years.
SOLAR RADIATION
WIND SPEED
TEMP PET
THORNTHUAITE
PENMAN PAN
PENMAN
TH0RNTHUA1TE
MM PER MONTH
AET=1126+.3P, R SQR=.40
PRECIPITATION - MM
1972 day
1982 day
9 71 64 Min 63 61 54
^i[—mvommomc—ocncocMr—rHcooor—vovDmcM^oromrHr—^rc—co cnoooo^r—c—ovor—mooocMcooo^*mcnoco^a«coc—csjCMmooo^m cMvooocovoooinoocncncnr—VD -— CM i cncnr—VD in C—VOOD CM c—*r coco c—ocncMOcooc—c—co^roocnOrHco^cnocnmOrHcoocomcMc—covo cocovomc—VDOoc—O'J'vocMOO'rmcovomooocorHVDmcMCM^i'r—«3"oovcnmOrHcoocomcMc—covo cocovomc—VDOoc—O'J'vocMOO'rmcovomooocorHVDmcMCM^i'r—«3"oovcnmOrHcoocomcMc—covo cocovomc—VDOoc—O'J'vocMOO'rmcovomooocorHVDmcMCM^i'r—«3"oovcnmOrHcoocomcMc—covo cocovomc—VDOoc—O'J'vocMOO'rmcovomooocorHVDmcMCM^i'r—«3"oovcnmOrHcoocomnoc—rcooomcoomnc oc —cM^rmm o o c n r o e o e o c — v o m r - v o ^r^r m VD co VDVD oo eo co moo oo one—co ^r CM CMC—. MCMcnxTroop-roxrroxTVD CM 00 xr m O CM rH xr xr XT CO XT O m C M CO XT VO. VO IT) t-H C^ CM LO CO CM rH tH rH rH . mcMrocMOCTiOOCTioooocOrHroininrHncocncMroeftcoLncooMncMiO'3'rcooMncMiO'3' rco^rf>rcooMncMiO'3' . cocor ^CM^'iorocMCOr^cMr^cOLn^r^r^r.
Sioli, redaktør, The Amazon: Limnology and Landscape Ecology of a Mighty Tropical River and Its Basin, side 501-519.
Washington, D.C.: Smithsonian Institution Press
Smithsonian Institution Press
Lockwood, J.G
Paine, R.T
Pinker, R
Portig, W.H
Panami City: Impresora de la Nacion, INAC
Rasmussen, E.M
1983. Meteorological Aspects of the El Nino/Southem Oscillation
Read, R.G
1977. Microclimate as Background Environment for Ecological Studies of Insects in a Tropical Forest Journal of Applied Meteorology,
Rubinoff, R
Dordrecht: DR W. Junk Publishers
Shuttleworth, W.J
Smythe, N
Springer-Verlag
Smithsonian Institution
Vivo Escoto, J.A
Wilkinson, L
Windsor, D.M