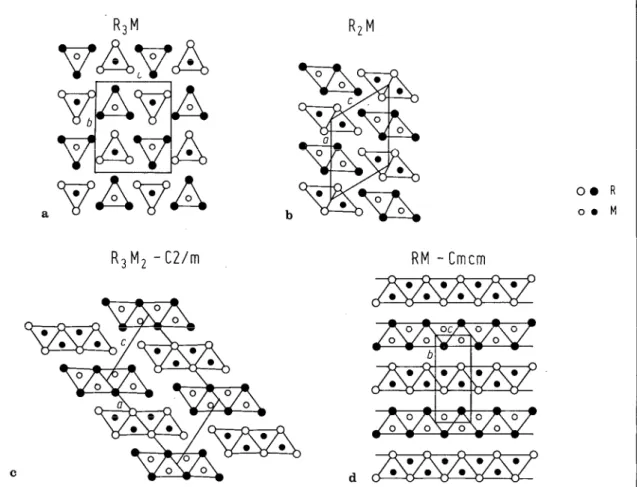
Different types of structures differ in the ratio between the number of RM blocks and the number of RM blocks. If the sum of the printed numbers in the minimum sequence of blocks is formed, the first ciphers are separated from the other ciphers. both sums correspond to the general composition formula for a specific type of structure. a) R, M, (b) R, M and (c) types of RM-Pnma structures interpreted from the periodic unit cell stacking of the hexagonal close-packed core structure. The analysis predicts an increase in the stability of RM, compounds in the sequence M=Mn.
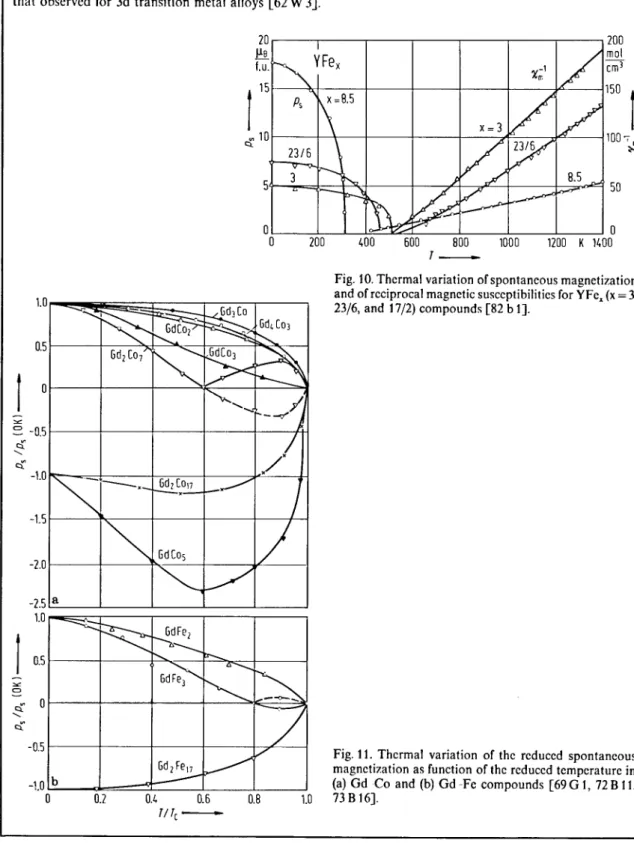
In the following, some general characteristics of the magnetic behavior of ferromagnetic and ferrimagnetic RM, compounds will be presented:. The degree of localization of the 3d transition metal magnetic moments is a function of the Curie temperature. This model explained the decrease of the magnetic moment of the transition metals with increasing rare earth content, Fig.
The presentation of the models used to describe the magnetic properties of RM compounds is not complete.
![Fig. 2. Phase diagrams of (a) Sm-Mn [78 m 11, (b) Sm-Fe [71 B 171, (c) Sm-Co [73N 1, 77 P6] and (d) Sm-Cu [75 K 61 systems](https://thumb-ap.123doks.com/thumbv2/123dok/10240788.0/4.756.31.672.71.989/fig-phase-diagrams-sm-mn-sm-fe-systems.webp)
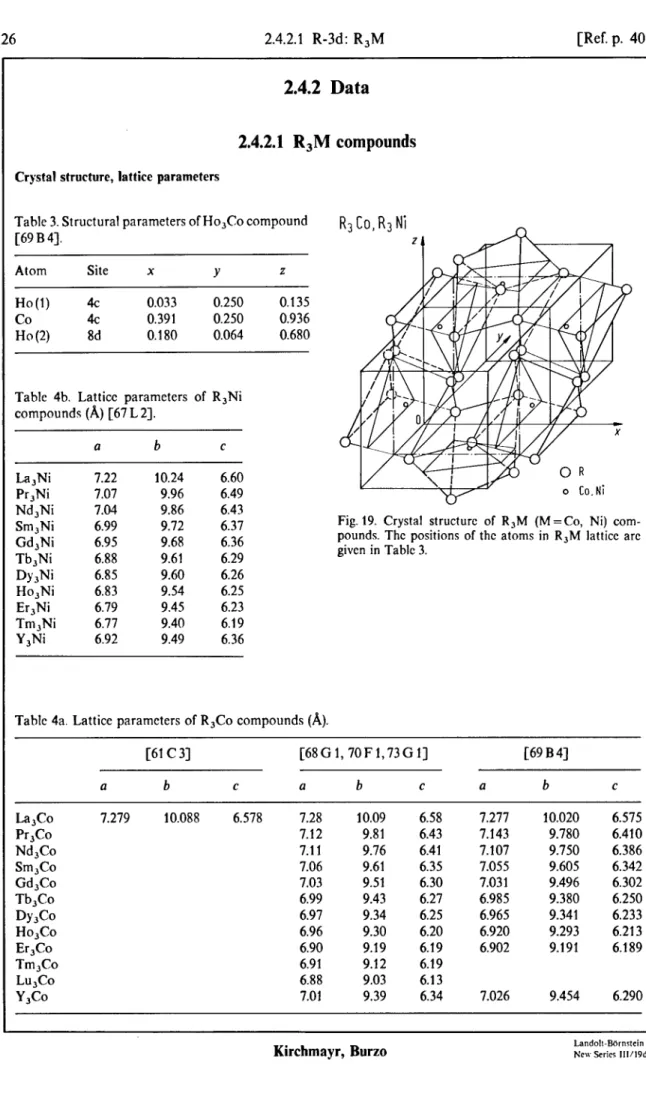
Data
R,M compounds
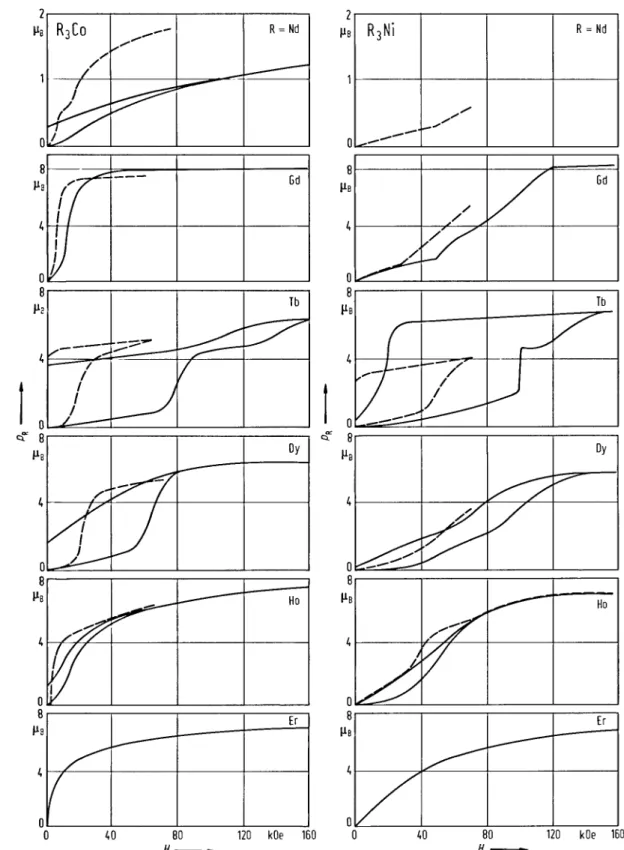
Magnetic field dcpcndcncc of the magnetization in R&o and R,Ni compounds in pulsed magnetic fields [72P 33. The critical field strength in pulsed magnetic field is greater than for static field, cf. Composition dependence of the critical magnetic field at 4.2K in some pseudobinary Gd,Co,- ,M, (M = Fe, Ni) compounds [73P 33.
Such anisotropy comes from crystal potential, low symmetry of the crystalline structures and from the crystal field effect on the conduction band. Projection of the magnetic structure of Er,Co at 4.2 K on the (o,b) and (h,c) planes dctcrmincd by neutron diffraction mcasurcmcnts [73 G 11. Projection of the magnetic structure of Er,Ni at 4.2 K on the (a,b) plane, showing an antiferromagnetic arrangement of the Er moments.
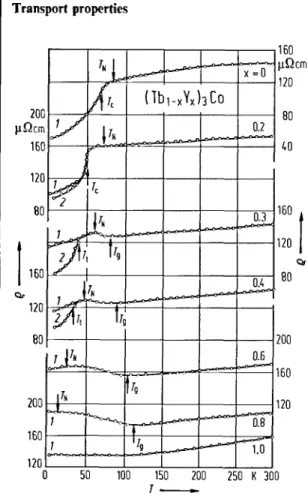
The data indicated by I wcrc obtained on samples bcforc the magnetic field was applied and with 2 after the samples were maggctizcd from 0 to 3.5 7: The N&cl tcmpkraturcs are indicated by arrows.
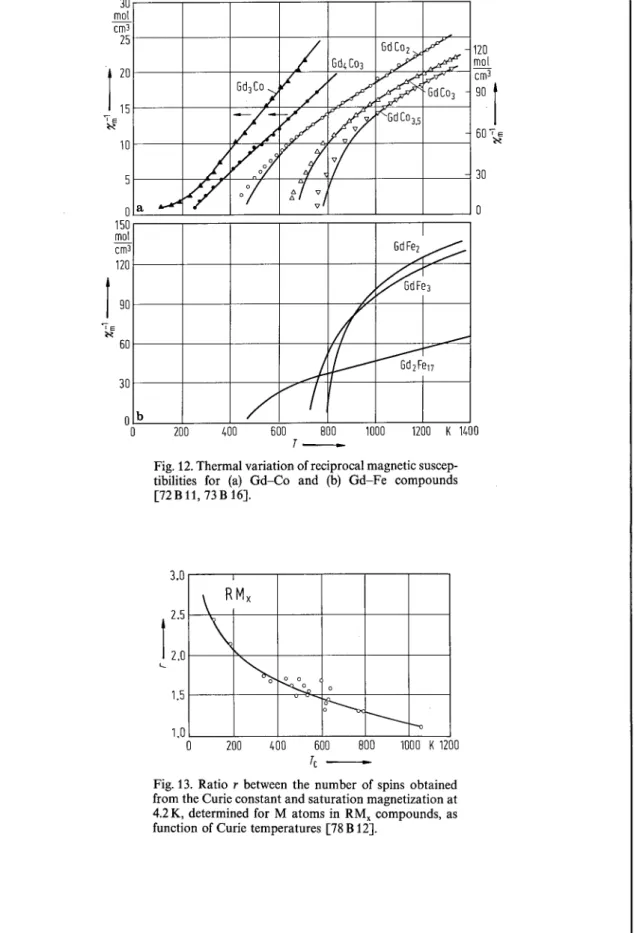
R,M, compounds
Thermal variation of the reciprocal magnetic susceptibility for R,Ni, (R=La, Ce, Pr, Nd) compounds. After subtracting the phonon drag contribution, a negative diffusion TEP is left on layer 7; characteristic of a Kondo lattice. Thermal variation of the reciprocal magnetic susceptibility for Ce,Co, compound in the temperature range (a) 4.2..1OOOK, and (b) 4.2..1OOK.
A very small change in the thermal motion of the magnetic susceptibility appears above the melting point, TM = 750 K. The anomalously low values of the magnetic susceptibility could be understood by assuming that Co is non-magnetic and Ce is a tempraturc-depcndcnt mixed- valcncc -state ion [84 0 33. Temperature delimitation of the valence of Ce in Ce,Co, inferred from XPS measurements (broken lint).
This interaction accounts for the slower temperature depcndencc than expcctcd for isolated ions [85A 11.
R, 2M, compounds
RsM, compounds
R,M, compounds
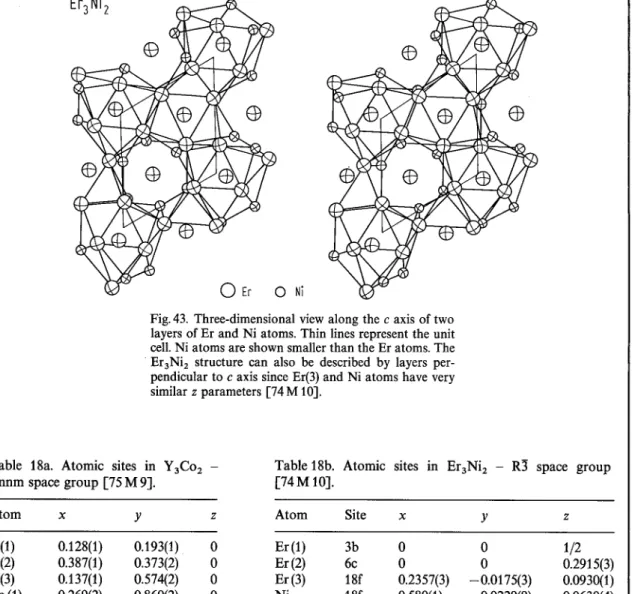
Large circles represent Y atoms, small circles in the centers of prisms represent Ni atoms. The drawing of trigonal prisms becomes important if we add 100 to the underlined entered values 100x [77 L 11.
R,M,(R,M,) compounds
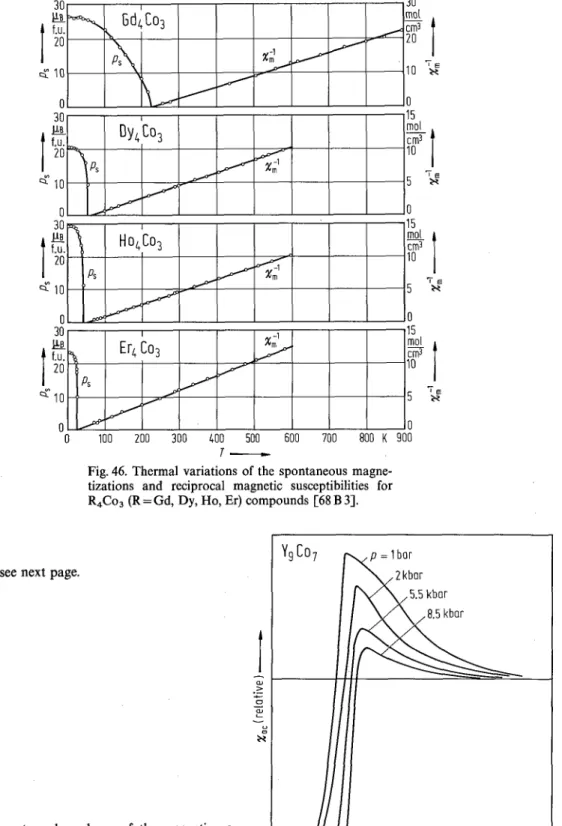
Thermal variations of spontaneous magnetizations and reciprocal magnetic susceptibility for compounds R,Co3 (R = Gd, Dy, Ho, Er) [68 B 31. Temperature dependence of magnetic susceptibility to alternating current for various applied pressures for Y&o,. Below the Curie temperature and in a zero magnetic field, we observe an apparent broadening of the Miissbauer quadrupole spectrum. This may be evidence that ferromagnetic ordering survives the appearance of superconducting ordering in Y,Co,.
Composition dependence of (filled symbols) the Curie temperature Tc and (open symbols) the superconducting transition temperature, T, in (Y, -,RJ,Co,. Thcsc samples are not superconducting down to 70 mK. Temperature dependence of Y&o, electrical resistivity at different pressures [83H5] As also appears from fig.
A broad hump in the magnetic region, followed by a peak at 2.5 K typical of supcr- conductivity, is shown [82 S 31. b) shows the tcmpcraturc dcpcndcncc of thcrmopowcr Q of Y&o,.
RCo, -&RCoO& compounds
LOCO,_
RNi compounds
The structure of the quenched sample, TbNi(h), is from the Pnma space group, while the structure from Thermal variation of reciprocal magnetic susceptibility for PrNi and NdNi compounds along the three main crystallographic directions [84 F 23. For PrNi, the variation of susceptibility to fields applied along the c and a axes follows the Curie-Weiss law with equal slopes corresponding to the effective moment of Pr3+.
Thermal change of spontaneous magnetization for a NdNi single crystal and the angle cp from p in the a direction [84 F 21. The dependence of magnetization on the field along the a axis is characteristic of metamagnetic behavior (critical field H , .=45 kOe). Thermal changes in the magnetic susceptibility of CeNi, measured along the c axis at ambient pressure and under 3 and 5 kbar, and thermal changes in the magnetic susceptibility of a polycrystalline LaNi sample at ambient pressure [87 G 31.
Temperature bounds on (a) the spontaneous magnetization along the D axis and (b) the mutual magnetic susceptibility xi' for a Tb,sYo,Ni single crystal. The substitution of Ce by La in CeNi,Pt, -= leads to a decrease in the Curie temperature, Tc. Pressure dependence of the relative Curie temperatures and spontaneous magnetizations at 4.2K for CeNi,Pt,-, compounds with x SO.85.
In-plane CeNi magnetic moment density projections (ab) induced at 20 and 140 K by a magnetic field of 46.2 kOe applied along the c axis. The thermal stability of the magnetic moment modulation depends on the nature of the ion R. The magnetic field depcndencc of the longitudinal magnetostriction at 4.2 K, along the c-axis of a DyNi single crystal.
Negative magnetoresistance was observed with a rotation of the magnetization rotation along the c axis when the field was applied along the c axis and the current was parallel to the b axis. This anomaly corresponds to a faster decrease of the magnetic entropy and is attributed to the transformation of the modulated magnetic structure towards the antiphase magnetic structure.
R,M, compounds
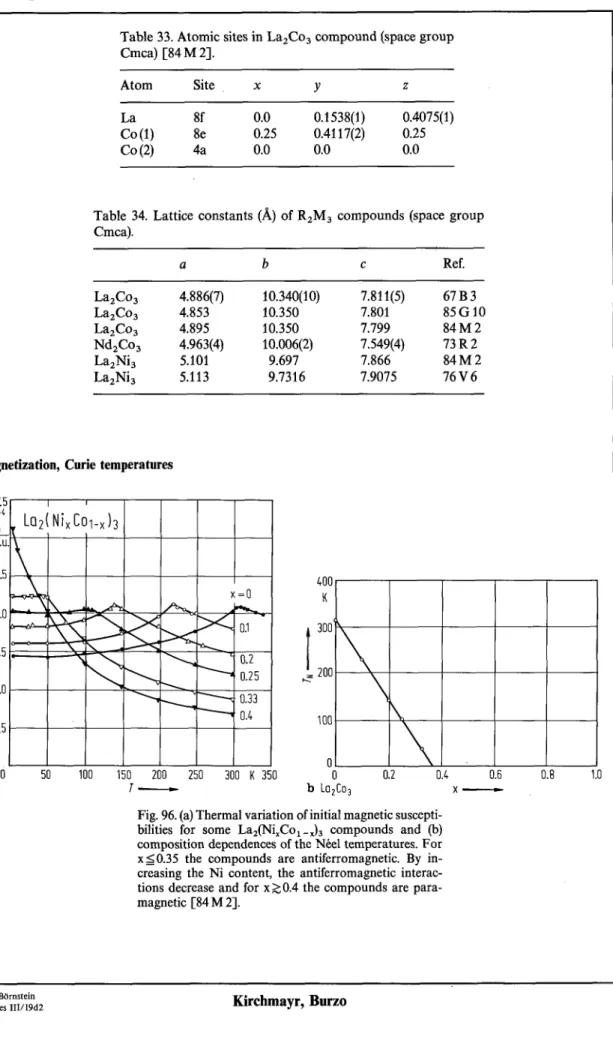
Lattice constants (A) of R2M, compounds (space group Cmca). a) Thermal variation of initial magnetic susceptibilities for some La,(Ni,Co,-J, compounds and (b) compositional dependences on the N&e1 temperatures. By increasing the Ni content, the antiferromagnetic interactions decrease and for x20.4 the compounds are paramagnetic [ 84 M 21. The antifcrromagnetic interactions occur bc- twccn Co atoms around SA separated by La atom zones.
The negative interactions arise from an indirect Co-La-Co interaction through the 3d-5d hybridization and the negative polarization of the spins of the 5d electrons by Co magnetic moments. Magnetic moments of Co atoms in La&o and La,(Co,Ni,) determined by neutron diffraction studies at T= 5 K.
RM, compounds
The large anomalies in the dilation arc are attributed to the distance depcndencc of the exchange energy between Mn atoms [8602]. The area of cocxistencc of the paramagnctic and antiferromagntic phases (AF + P) depends on the sample preparation [86 0 23. Temperature dependence of the lattice parameters of HoCo, and NdCo, normalized to the respective RT values.
A tetragonal distortion of the MgCu-type cubic structure was shown to occur below the Curie temperature. The tetragonal distortion of the MgCu-type cubic structure was shown below the Curie temperature. Variation of lattice parameter as a function of hydrogen content x in ErFc,H and TbFe,H at room temperature [87 F4].
The temperature dependence of the cell distortion measured by neutrons corresponds to a slight decrease in the rhombohedral distortion caused by hydrogen (y>90”). The Y, -, Sc, Mn system shows a much different thermal expansion than the Al system. Here, the transition from the antichromamagnetic to the nonmagnetic state is of the first order in Y, -, Sc, Mn,.
Dependence of the Curie temperature Tc in RFe,H, hydrides on the relative variation of lattice parameters a(x)/a(O) for R = Ho, Er, Tm and Lu [84 D 41. In Y,Zr, - XFe, the change of the magnetic moment is smooth with a maximum value of about x=0.35. For x 2 0.75 they exceed those of the parent compounds and for x 20.85 the magnetic moment is almost constant.
Composition dependence of the saturation magnetizations at 4.2K and the Curie temperatures for Y(Fe,-,CoJ, and their hydrides [83F9] Variation of the Curie temperatures of the R(Co, -XAIX), compounds in the low -Al- concentration range The presence of a small amount of Al, Ga or Ge leads to a large increase in the magnetic energy.
Composition Dependence of the Curie temperature Tc, effective Co magnetic moment pee, and saturation Co magnetic moment at OK, ps, in Y(CO,-~Al,), compounds [87Y II].
- RM, compounds
Dependence on the composition of the spontaneous moment ps and the number of revolutions S defined by p&. In YMn, the change of electronic state at TN causes the collapse of the magnetic moment of Mn. A spin glass transition was demonstrated in Y(Mn,-,Al,). a) ThMn basal plane projection, magnetic structure at 5 K.
Its shape, elongated perpendicular to the Fe-Ho direction, is an effect of the projection overlap with the Ho density. These can be correlated with the expansion or contraction of the structure due to the presence of hydrogen. Compositional dependence of the effective spectroscopic splitting factor, avg in the Gd,Y, -XFe, system at room temperature.
Temperature dependence of the line width AH at 1.92 T>Tc and g values for Gd(Co,Al,-,), compounds. By increasing the Co content, a break in the bottleneck of the relaxation of conduction electron magnetization to the lattice is observed. This is attributed to the influence of the increased conduction electron density when R3+ ions are replaced by Ce4+.
The relative intensity of the paramagnetic signal with respect to the ferromagnetic one was greatly reduced for x = 0.12 compared to x = 0.08. Temperature dependence of thermal expansion for (a) GdMn, (b) TbMn and clcctric resistances for (c) GdMn and (d) TbMn, [83 M 11. This may be due to the appearance of some cracks in the crystal with large axial distortion associated with deformation crystal structures.
Therefore, the difference between the experimental points and the dashed line gives the magnetic heat capacity of the Mn sublattice. 23 J mol- r K- ’ is expected from the perturbation of localized spin S= 3/2, reflecting an itinerant nature of the Mn magnetic moment. Composition dependence of the mean hypertin magnetic fields at "Fe in Y(Fe, -$o.Js, Dy(Fe, -$o&.
An increase in Fe magnetic moment upon absorption of hydrogen up to x = 2.7 has been demonstrated [79 N 31.
![Fig. 22. Temperature dependence of the critical magnetic field in Gd,Co compound [68 G I]](https://thumb-ap.123doks.com/thumbv2/123dok/10240788.0/34.762.361.675.73.356/fig-temperature-dependence-critical-magnetic-field-gd-compound.webp)