VOSviewer Manual
Nees Jan van Eck and Ludo Waltman 31 October 2023
Manual for VOSviewer version 1.6.20
1
Table of contents
1 Introduction ... 3
2 Terminology ... 5
3 User interface ... 7
3.1 Main panel ... 8
3.1.1 Network visualization ... 9
3.1.2 Overlay visualization ... 9
3.1.3 Density visualization ... 10
3.1.4 Zooming and scrolling ... 12
3.2 Options panel ... 13
3.3 Information panel ... 17
3.4 Overview panel ... 17
3.5 Action panel ... 18
3.5.1 File tab ... 18
3.5.2 Items tab ... 21
3.5.3 Analysis tab ... 21
3.5.4 Create Map wizard ... 25
4 File types... 40
4.1 Map and network files ... 40
4.1.1 Map files ... 40
4.1.2 Network files ... 42
4.2 Corpus and scores files ... 43
4.2.1 Corpus files ... 43
4.2.2 Scores files ... 43
4.3 Thesaurus files ... 44
4.4 Cluster colors, overlay colors, and density colors files ... 44
4.4.1 Cluster colors files ... 44
4.4.2 Overlay colors files ... 45
2
4.4.3 Density colors files ... 45
5 Advanced topics ... 46
5.1 Using command line parameters ... 46
5.2 Making a map available online ... 51
5.3 Increasing the availability of memory ... 52
References ... 53
3
1 Introduction
VOSviewer is a software tool for creating maps based on network data and for visualizing and exploring these maps. The functionality of VOSviewer can be summarized as follows:
• Creating maps based on network data. A map can be created based on a network that is already available, but it is also possible to first construct a network. VOSviewer can be used to construct networks of scientific publications, scientific journals, researchers, research organizations, countries, keywords, or terms. Items in these networks can be connected by co-authorship, co- occurrence, citation, bibliographic coupling, or co-citation links. To construct a network, bibliographic database files (i.e., Web of Science, Scopus, Dimensions, Lens, and PubMed files) and reference manager files (i.e., RIS, EndNote, and RefWorks files) can be provided as input to VOSviewer. Alternatively, VOSviewer can download data through an API (i.e., OpenAlex API, Crossref API, Europe PMC API, and several others).
• Visualizing and exploring maps. VOSviewer provides three visualizations of a map: The network visualization, the overlay visualization, and the density visualization. Zooming and scrolling functionality allows a map to be explored in full detail, which is essential when working with large maps containing thousands of items.
Although VOSviewer is intended primarily for analyzing bibliometric networks, it can in fact be used to create, visualize, and explore maps based on any type of network data.
VOSviewer has been developed in the Java programming language. Because Java is platform-independent, VOSviewer runs on most hardware and operating system platforms. VOSviewer can be downloaded from www.vosviewer.com. It can be used freely for any purpose.
This manual pertains to version 1.6.20 of VOSviewer. The manual is organized as follows. We first introduce some terminology in Chapter 2. We then discuss the user interface of VOSviewer in Chapter 3, and we explain the file types used by VOSviewer in Chapter 4. Finally, we consider a number of advanced topics in Chapter 5.
For additional information about VOSviewer, we refer to a paper that we have written (Van Eck & Waltman, 2010). This paper provides a general introduction to VOSviewer. It also discusses in considerable detail the technical implementation of
4
specific elements of the software. Similar information, including a step-by-step tutorial, can also be found in a more recent book chapter (Van Eck & Waltman, 2014).
5
2 Terminology
When working with VOSviewer, it is important to understand the terminology used by the software. We now introduce this terminology.
Maps created, visualized, and explored using VOSviewer include items. Items are the objects of interest. Items may for example be publications, researchers, or terms. A map normally includes only one type of item. It is for example uncommon to have a map that includes both publications and terms. Between any pair of items there can be a link. A link is a connection or a relation between two items.
Examples of links are bibliographic coupling links between publications, co- authorship links between researchers, and co-occurrence links between terms. A map normally includes only one type of link. Also, between any pair of items, there can be no more than one link. Each link has a strength, represented by a positive numerical value. The higher this value, the stronger the link. The strength of a link may for example indicate the number of cited references two publications have in common (in the case of bibliographic coupling links), the number of publications two researchers have co-authored (in the case of co-authorship links), or the number of publications in which two terms occur together (in the case of co- occurrence links). Sometimes the links between items all have a strength of one.
VOSviewer then does not show the strength of a link. Items and links together constitute a network. Hence, a network is a set of items together with the links between the items.1
Items may be grouped into clusters. A cluster is a set of items included in a map.2 Clusters are non-overlapping in VOSviewer. In other words, an item may belong to only one cluster. Clusters do not need to exhaustively cover all items in a map.
Hence, there may be items that do not belong to any cluster. Clusters are labeled using cluster numbers. If there is only one cluster, this cluster usually has cluster number 1, if there are two clusters, these clusters usually have cluster numbers 1 and 2, and so on.
1 In the literature, a network is sometimes referred to as a graph. Likewise, an item is sometimes called a node or a vertex, a link is sometimes called an edge, and the strength of a link is sometimes called an edge weight. These terms are not used by VOSviewer, but they may be used by other software tools for network analysis and network visualization.
2 In the literature, a cluster is sometimes referred to as a community, but this term is not used by VOSviewer.
6
Items may have various attributes in VOSviewer. If items have been assigned to clusters, cluster numbers are an example of an attribute. Of special importance are the weight and score attributes. These attributes are represented by numerical values. Weight attributes are restricted to non-negative values. Score attributes do not have this restriction. A weight of an item should in some way indicate the importance of the item. An item with a higher weight is regarded as more important than an item with a lower weight.3 In the visualization of a map, items with a higher weight are shown more prominently than items with a lower weight.
A score attribute may indicate any numerical property of items.4 However, since weight attributes are already used to indicate the importance of items, it is recommended to use score attributes to indicate other properties. Score attributes are considered only in the overlay visualization of a map (see Subsection 3.1.2), not in the network visualization and the density visualization. Items may have multiple weight and multiple score attributes. The weight and score attributes that are used in the visualization of a map can then be selected in the options panel of VOSviewer (see Section 3.2).
There are two standard weight attributes, referred to as the Links attribute and the Total link strength attribute. For a given item, the Links and Total link strength attributes indicate, respectively, the number of links of an item with other items and the total strength of the links of an item with other items. For example, in the case of co-authorship links between researchers, the Links attribute indicates the number of co-authorship links of a given researcher with other researchers. The Total link strength attribute indicates the total strength of the co-authorship links of a given researcher with other researchers.
In addition to the standard Links and Total link strength attributes, items may also have custom weight attributes. Custom weight attributes are discussed in Subsection 3.5.4.
3 More precisely, VOSviewer assumes weight attributes to have a ratio scale. In other words, if an item has a weight that is twice as high as the weight of another item, the former item is regarded as twice as important as the latter item.
4 Unlike weight attributes, score attributes are not assumed to have a ratio scale. Score attributes may also have an interval or an ordinal scale. In other words, the minimum requirement for score attributes is that it makes sense to compare two items based on whether one item has a higher score than the other item.
7
3 User interface
The main window of VOSviewer is shown in Figure 1. It consists of the following five panels:
• Main panel. This panel presents a visualization of the currently active map.
Zoom and scroll functionality can be used to explore the map in full detail.
• Options panel. This panel can be used to make adjustments to the visualization of the currently active map presented in the main panel.
• Information panel. This panel presents descriptions of items in the currently active map.
• Overview panel. This panel presents an overview of the currently active map. A rectangular frame indicates the area in the map that is shown in the main panel.
• Action panel. This panel can be used to perform different kinds of actions, such as creating a new map, opening or saving an existing map, making a screenshot, and updating the layout or the clustering of a map.
VOSviewer provides three visualizations, referred to as the network visualization, the overlay visualization, and the density visualization. As can be seen in Figure 1, the Network Visualization, Overlay Visualization, and Density Visualization tabs in the main window of VOSviewer can be used to switch between the visualizations.
A status bar is available at the bottom of the main window of VOSviewer. The status bar provides information about the currently active map. It shows the number of items in the map, the number of clusters to which the items have been assigned, the number of links between the items, and the total strength of the links. Moreover, when the mouse pointer is moved over an item in the main panel, the status bar provides information about this item. Likewise, when the mouse pointer is moved over a link between two items, the status bar provides information about this link.
In the next sections, the five panels in the main window of VOSviewer are discussed in more detail.
8
Figure 1. Main window of VOSviewer. The numbers designate (1) the main panel, (2) the options panel, (3) the information panel,
(4) the overview panel, and (5) the action panel.
3.1 Main panel
As can be seen in Figure 1, the main panel presents a visualization of the currently active map. Zoom and scroll functionality can be used to determine the area in the map that is shown in the main panel. Three visualizations are available in the main panel: The network visualization, the overlay visualization, and the density visualization.
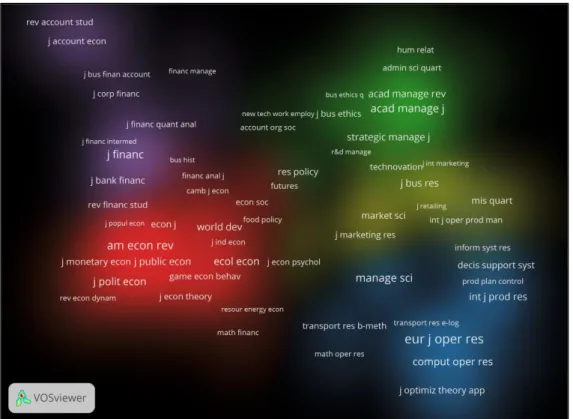
To illustrate the different visualizations, we use a map of a co-citation network of 232 journals in the fields of economics, management, and operations research (for more details, see Van Eck & Waltman, 2010). The map is available in the files journal_map.txt and journal_network_sparse.txt, which are distributed together with VOSviewer. To open the map in VOSviewer, click the Open button on the File tab in the action panel, select the VOSviewer map file journal_map.txt and the VOSviewer network file journal_network_sparse.txt, and click the OK button.
1
3 5 2
4
9
3.1.1 Network visualization
In the network visualization, items are represented by their label and by default also by a circle. The size of the label and the circle of an item is determined by the weight of the item. The higher the weight of an item, the larger the label and the circle of the item. For some items the label may not be displayed. This is done in order to avoid overlapping labels. The color of an item is determined by the cluster to which the item belongs. Lines between items represent links. By default, at most 1000 lines are displayed, representing the 1000 strongest links between items.
An example of the network visualization is shown in Figure 2. The distance between two journals in the visualization approximately indicates the relatedness of the journals in terms of co-citation links. In general, the closer two journals are located to each other, the stronger their relatedness. The strongest co-citation links between journals are also represented by lines.
Figure 2. Network visualization.
3.1.2 Overlay visualization
The overlay visualization is identical to the network visualization except that items are colored differently. There are two ways in which items can be colored in the overlay visualization. If items have scores, the color of an item is determined by
10
the score of the item, where by default colors range from blue (lowest score) to green to yellow (highest score). On the other hand, if items have user-defined colors (specified using the red, green, and blue columns in a VOSviewer map file;
see Subsection 4.1.1), the color of an item is determined by the user-defined color of the item. If items have neither scores nor user-defined colors, the overlay visualization is not available.
An example of the overlay visualization is shown in Figure 3. A color bar is shown in the bottom right corner of the visualization. The color bar is shown only if colors are determined by scores of items. The color bar indicates how scores are mapped to colors. In the overlay visualization shown in Figure 3, colors indicate impact factors of journals. For example, journals colored blue have an impact factor below 1, journals colored green have an impact factor around 2, and journals colored yellow have an impact factor of 3 or higher.
Figure 3. Overlay visualization.
3.1.3 Density visualization
There are two variants of the density visualization. We first discuss the item density visualization, followed by the cluster density visualization. The Item density and Cluster density radio buttons in the options panel can be used to
11
switch between the two variants of the density visualization. We refer to Van Eck and Waltman (2010) for a discussion of the technical implementation of the density visualization.
In the item density visualization, items are represented by their label in a similar way as in the network visualization and the overlay visualization. Each point in the item density visualization has a color that indicates the density of items at that point. By default, colors range from blue to green to yellow. The larger the number of items in the neighborhood of a point and the higher the weights of the neighboring items, the closer the color of the point is to yellow. The other way around, the smaller the number of items in the neighborhood of a point and the lower the weights of the neighboring items, the closer the color of the point is to blue. An example of the item density visualization is shown in Figure 4.
Figure 4. Item density visualization.
The cluster density visualization is available only if items have been assigned to clusters. The cluster density visualization is similar to the item density visualization except that the density of items is displayed separately for each cluster of items. In the cluster density visualization, the color of a point in the visualization is obtained by mixing the colors of different clusters. The weight given to the color of a certain
12
cluster is determined by the number of items belonging to that cluster in the neighborhood of the point. Like in the item density visualization, the weight of an item is taken into account as well. An example of the cluster density visualization is shown in Figure 5.
Figure 5. Cluster density visualization.
3.1.4 Zooming and scrolling
To facilitate the detailed exploration of a map, VOSviewer offers zoom and scroll functionality. In the main panel, zooming and scrolling can be done in the following three ways:
• Using the mouse. To zoom in, move the mouse upwards while keeping the right mouse button pressed. The other way around, to zoom out, move the mouse downwards while keeping the right mouse button pressed. As an alternative, the mouse wheel can be used to zoom in and out. To scroll through a map, move the mouse while keeping the left mouse button pressed.
• Using the navigation buttons in the top right corner of the main panel (see Figure 1). Use the plus and minus buttons to zoom in and out. Use the arrow buttons to scroll through a map.
13
• Using the keyboard. Use the plus and minus keys to zoom in and out. Use the arrow keys to scroll through a map.
3.2 Options panel
The options panel can be used to make adjustments to the visualization of the currently active map presented in the main panel. The network visualization, the overlay visualization, and the density visualization each provide somewhat different options. Some of the options are not always available. The options panel shows only the options that are relevant for the currently active map.
When the network visualization or the overlay visualization is selected, the following options may be available:
• Visualization.
o Scale. This slider determines the size of the labels of items in the visualization of the currently active map. It also determines the thickness of the lines used to display links between items.
o Weights. When items have multiple weight attributes, the Weights drop down list determines the currently selected weight attribute. This weight attribute then determines how prominently items are shown in the visualization of the currently active map. The higher the weight of an item, the larger the label of the item in the visualization.
o Scores. This drop down list is available only if the overlay visualization is selected. When items have multiple score attributes, the Scores drop down list determines the currently selected score attribute. This score attribute then determines the coloring of items in the visualization of the currently active map. By default, the higher (lower) the score of an item, the closer the color of the item is to yellow (blue).
• Labels.
o Size variation. The higher the weight of an item, the larger the label of the item in the visualization of the currently active map. The Size variation slider determines the strength of this effect.
o Circles and Frames. These radio buttons determine how items are represented in the visualization of the currently active map. If the Circles radio button is selected, items are represented by their label and by a circle.
If the Frames radio button is selected, items are represented by their label displayed within a rectangular frame.
14
o Max. length. This text box determines the maximum length of a label displayed in the visualization of the currently active map. If the length of the label of an item exceeds the maximum length, only the first part of the label is displayed.
o Font. This drop down list determines the font that is used to display the labels of items in the visualization of the currently active map. The availability of fonts in the Font drop down list depends on the use of CJKV (Chinese, Japanese, Korean, and Vietnamese) characters in the labels of items. If the labels of items do not include CJKV characters, a number of fonts are available, with the Open Sans font being selected by default. If the labels of items do include CJKV characters, only the SansSerif font is available. The SansSerif font ensures that CJKV characters are displayed correctly.
• Lines.
o Size variation. The stronger the link between two items, the thicker the line that is used to display the link in the visualization of the currently active map. The Size variation slider determines the strength of this effect.
o Min. strength and Max. lines. In the visualization of the currently active map, links between items can be displayed using lines. The Min. strength and Max. lines text boxes determine, respectively, the minimum strength of links displayed in the visualization and the maximum number of links displayed in the visualization. If the number of links that have the required minimum strength exceeds the maximum number of links, only the strongest links are displayed.
o Colored lines. This check box determines whether links are displayed using gray lines or colored lines.
o Curved lines. This check box determines whether links are displayed using straight lines or curved lines.
• Colors.
o Cluster Colors. This button is available only if the network visualization is selected. The button offers four options:
▪ Edit colors. This option is the default choice. Choose this option to edit the current cluster colors in the Edit Cluster Colors dialog box.
▪ Import colors. Choose this option to import cluster colors from a cluster colors file (see Subsection 4.4.14.4).
15
▪ Export colors. Choose this option to export the current cluster colors to a cluster colors file (see Subsection 4.4.1).
▪ Use default colors. Choose this option to use the default cluster colors.
o Overlay Colors. This button is available only if the overlay visualization is selected and if items have scores. The button offers four options:
▪ Set colors range. This option is the default choice. Choose this option to bring up the Set Overlay Colors Range dialog box. This dialog box can be used to change the minimum and the maximum score that determine how the scores of items are mapped to colors. By default, scores less than or equal to the minimum score are mapped to blue, intermediate scores are mapped to green, and scores greater than or equal to the maximum score are mapped to yellow.
The Set Overlay Colors Range dialog box can also be used to determine how the scores of items are normalized. By default, no normalization is applied. If the Divide by mean option is selected in the Normalize scores drop down list, the scores of items are normalized by dividing each score by the mean score of all items.5 If the Subtract mean option is selected, the scores of items are normalized by subtracting from each score the mean score of all items. Finally, if the Subtract mean and divide by st. dev. option is selected, the scores of items are normalized by first subtracting from each score the mean score of all items and by then dividing by the standard deviation of the scores of all items (i.e., a z-score normalization). Working with normalized scores is an advanced feature of VOSviewer that should be used only in special cases. For most purposes, we recommend not to normalize scores.
▪ Import colors. Choose this option to import overlay colors from an overlay colors file (see Subsection 4.44.4.2).
▪ Export colors. Choose this option to export the current overlay colors to an overlay colors file (see Subsection 4.4.2).
5 This option is available only if the scores of items all have the same sign. In other words, the scores of items must either all be non-negative or all be non-positive.
16
▪ Use predefined colors. Choose this option to use predefined overlay colors. Eight different color schemes are available.6 To use the default overlay colors, choose the Viridis color scheme.
o Black background. This check box determines whether the visualization of the currently active map has a white or a black background color.
When the density visualization is selected, the following options may be available:
• Visualization.
o Scale. This slider determines the size of the labels of items in the visualization of the currently active map.
o Weights. When items have multiple weight attributes, the Weights drop down list determines the currently selected weight attribute. This weight attribute then determines how prominently items are shown in the visualization of the currently active map. The higher the weight of an item, the larger the label of the item in the visualization. The selected weight attribute is also used in the calculation of the density of items.
• Labels. These options are identical to the options provided when the network visualization or the overlay visualization is selected (except that the Circles and Frames radio buttons are not available).
• Density.
o Kernel width. This slider determines the value of the kernel width parameter. We refer to Van Eck and Waltman (2010) for more information about this parameter.
o Item density and Cluster density. These radio buttons determine whether the item density visualization or the cluster density visualization is selected.
• Colors.
o Density Colors. This button is available only if the item density visualization is selected. The button offers three options:
6 The color schemes available in VOSviewer, both for overlay colors and for density colors, have been obtained from Matplotlib, a plotting library for Python. Some color schemes have been slightly adjusted.
For more information about the color schemes, see https://matplotlib.org/users/colormaps.html. For a further discussion of the use of different color schemes in VOSviewer, see www.cwts.nl/blog?article=n- r2s274.
17
▪ Import colors. This option is the default choice. Choose this option to import density colors from a density colors file (see Subsection 4.4.3).
▪ Export colors. Choose this option to export the current density colors to a density colors file (see Subsection 4.4.3).
▪ Use predefined colors. Choose this option to use predefined density colors. Eight different color schemes are available. To use the default density colors, choose the Viridis color scheme.
o Cluster Colors. This button is available only if the cluster density visualization is selected. The button offers four options:
▪ Edit colors. This option is the default choice. Choose this option to edit the current cluster colors in the Edit Cluster Colors dialog box.
▪ Import colors. Choose this option to import cluster colors from a cluster colors file (see Subsection 4.4.1).
▪ Export colors. Choose this option to export the current cluster colors to a cluster colors file (see Subsection 4.4.1).
▪ Use default colors. Choose this option to use the default cluster colors.
o White background. This check box is available only if the cluster density visualization is selected. The check box determines whether the cluster density visualization has a black or a white background color.
3.3 Information panel
The information panel is available only if items have a description attribute.
Description attributes may for example have been made available using the description column in a VOSviewer map file (see Subsection 4.1.1). The information panel presents descriptions of items in the currently active map. When the mouse pointer is moved over an item in the main panel, the description of the item is shown in the information panel.
3.4 Overview panel
The overview panel presents an overview of the currently active map. Each item in the map is represented by a small colored dot. A rectangular frame is displayed in the overview panel to indicate the area in the currently active map that is shown in the main panel. By left-clicking in the overview panel, it is possible to move to a different area in the currently active map. This new area is then shown in the main panel.
18
3.5 Action panel
The action panel can be used to perform different kinds of actions. The panel consists of three tabs: The File tab, the Items tab, and the Analysis tab. These tabs are discussed in Subsections 3.5.1, 3.5.2, and 3.5.3. The Create Map wizard, which can be accessed from the File tab, plays an important role in VOSviewer.
This wizard is discussed separately in Subsection 3.5.4.
3.5.1 File tab
The File tab can be used to perform a number of basic actions. The following buttons are available on the File tab:
• Map.
o Create. Use this button to create a new map. The button brings up the Create Map wizard. This wizard is discussed in detail in Subsection 3.5.4.
o Open. Use this button to open an existing map. The button brings up the Open Map dialog box. To open a map, a VOSviewer map file and optionally also a VOSviewer network file (see Section 4.1) can be provided.
Alternatively, a VOSviewer JSON file, a GML file, or Pajek files can be provided.7
o Save. Use this button to save the currently active map. The button brings up the Save Map dialog box. A map can be saved in a VOSviewer map file and a VOSviewer network file (see Section 4.1). Alternatively, a map can be saved in a VOSviewer JSON file, in a GML file, or in Pajek files.
o Share. Use this button to share the currently active map by making it available online. The map is uploaded to a cloud storage service and opened in VOSviewer Online, a web-based version of VOSviewer. The following
7 VOSviewer JSON files are used by VOSviewer Online as the default file type. VOSviewer Online is a web-based version of VOSviewer available at https://app.vosviewer.com. For more information about VOSviewer JSON files, see https://app.vosviewer.com/docs/file-types/json-file-type/. GML (graph modeling language) files are supported by various software tools for network analysis and network visualization, for example by Gephi, a software tool for network visualization available at https://gephi.org. Pajek is a software tool for social network analysis (De Nooy, Mrvar, & Batagelj, 2011). It is available at http://pajek.imfm.si/doku.php. VOSviewer supports Pajek network, matrix, partition, and vector files.
19
cloud storage services are supported: Google Drive, Microsoft OneDrive, and Dropbox.8
The share feature can be used only if you have an account for one of the above-mentioned cloud storage services and if you accept VOSviewer’s request to get authorization to access your account. The specific permissions that you need to grant to VOSviewer depend on the cloud storage service that you are using. In the case of Google Drive, VOSviewer creates a folder VOSviewer in which it stores the maps that you choose to share. In the case of Microsoft OneDrive and Dropbox, maps are stored in a special app folder. VOSviewer does not access or modify any other files in your cloud storage.
Maps are stored in your cloud storage in VOSviewer JSON files. Be aware that these files are publicly accessible. If you no longer want a map to be available online, you need to delete the corresponding the JSON file from your cloud storage.
o Screenshot. This button offers four options:
▪ Save. This option is the default choice. Choose this option to save a screenshot of the visualization of the currently active map presented in the main panel. The screenshot resembles the visualization of the currently active map as closely as possible. However, if the Optimize labeling check box in the Screenshot Options dialog box (see below) is checked, the visibility of labels in the screenshot is optimized. This means that some labels not visible in the visualization of the currently active map may be visible in the screenshot. Screenshots can be saved in a number of graphic file formats. For most purposes, we recommend the PNG format. Some formats, such as EPS, PDF, and SVG, use vector graphics to save a screenshot. This has the advantage that the screenshot can be resized without loss of quality.
▪ Print. Choose this option to print a screenshot of the visualization of the currently active map presented in the main panel.
▪ Copy to clipboard. Choose this option to copy a screenshot of the visualization of the currently active map presented in the main panel.
8 More information is available in a blog post (https://www.leidenmadtrics.nl/articles/vosviewer-goes- online-part-2) and a video (https://youtu.be/3sEc-6kFRig).
20
The screenshot is copied to the clipboard and can for example be pasted into a Word document or a PowerPoint presentation.
▪ Options. Choose this option to bring up the Screenshot Options dialog box. This dialog box can be used to change some settings related to screenshots.
The Scaling drop down list determines the resolution (i.e., the number of pixels) of a screenshot. The resolution is calculated relative to the resolution of the main panel. Using a scaling of 100%, screenshots have the same resolution as the main panel. Using the default scaling of 200%, screenshots have a resolution that is twice as high (i.e., twice as many pixels horizontally and vertically) as the resolution of the main panel. The Scaling drop down list has no effect on screenshots that are saved in a file format that uses vector graphics.
The Optimize labeling check box determines whether the visibility of labels in a screenshot is optimized. Optimizing the visibility of labels means that some labels not visible in the visualization of the currently active map presented in the main panel may be visible in a screenshot.
The Include border check box determines whether a border is included around a screenshot.
The Transparent background check box determines whether a screenshot has a transparent background. A screenshot can have a transparent background only if the network visualization or the overlay visualization is selected. A transparent background is supported when copying a screenshot to the clipboard and when saving a screenshot in PDF, PNG, or TIFF format. Other graphic file formats do not support a transparent background.
21
• Info.
o Manual. Use this button to open the VOSviewer manual. This requires an internet connection.
o About VOSviewer. This button brings up the About VOSviewer dialog box. This dialog box provides information about VOSviewer. It shows the version number of VOSviewer, a copyright notice, a license text, a link to the VOSviewer website, a list of software libraries used by VOSviewer, the version number of Java, and the amount of memory that is used by VOSviewer.
3.5.2 Items tab
The Items tab presents a list of items in the currently active map. By default, a list of all items in the map is presented. However, a filter can be used to restrict the list to a subset of the items in the map. To do so, enter a filter string in the Filter text box. This yields a list of all items with a label that contains the filter string.
The Group items by cluster check box determines how items are listed. If the check box is unchecked, items are simply listed alphabetically. If the check box is checked, items are first grouped by cluster and then listed alphabetically within each cluster.
By double-clicking on an item on the Items tab, it is possible to zoom in on the item in the visualization of the currently active map presented in the main panel.
3.5.3 Analysis tab
The Analysis tab can be used to update the layout and the clustering of the currently active map. This is done using the VOS layout technique and the VOS clustering technique.9 The Analysis tab can also be used to change the parameters of these techniques. The following options are available on the Analysis tab:
• Normalization. Use the normalization method drop down list to determine how the strength of the links between items is normalized. Normalized link strengths are used as input for the VOS layout technique and the VOS
9 Together these two techniques provide a unified framework for layout and clustering. We refer to Van Eck, Waltman, Dekker, and Van den Berg (2010), Waltman, Van Eck, and Noyons (2010), Waltman and Van Eck (2013), and Van Eck and Waltman (2014) for more information about these techniques.
22
clustering technique. The following options are available in the normalization method drop down list:
o No normalization. If this option is selected, no normalization is performed.
We generally do not recommend this option.
o Association strength. If this option is selected, the association strength method is used for normalizing the strength of the links between items.
Apart from a multiplicative constant, this method is identical to Eq. (6) in Van Eck and Waltman (2009). This option is selected by default.
o Fractionalization. If this option is selected, the fractionalization method is used for normalizing the strength of the links between items. Apart from a multiplicative constant, this method is identical to Eq. (13) in Van Eck and Waltman (2009).
o LinLog/modularity. If this option is selected, normalization is performed in the same way as in the LinLog layout technique and the modularity clustering technique. For more information about these techniques, we refer to Newman (2004) and Noack (2007, 2009).
• Layout.
o Attraction and Repulsion. These parameters influence the way in which items are located in a map by the VOS layout technique. The Attraction parameter must have an integer value between -9 and +10. The Repulsion parameter must have an integer value between -10 and +9. The value of the Repulsion parameter must be lower than the value of the Attraction parameter. For most purposes, our recommendation is to set the Attraction and Repulsion parameters to values of, respectively, 2 and 1.
Values of 2 and 0 or values of 1 and 0 sometimes also yield good results.
o Use default values. This check box determines whether default values of the attraction and repulsion parameters are used when a new map is created using the Create Map wizard (see Subsection 3.5.13.5.4). If the check box is checked, default parameters values are used. These default parameters values depend on the type of map that is created.10 If the check
10 The repulsion parameter has a default value of -1 when creating a map of a co-authorship network of authors. It has a default value of 0 when creating a map of a co-occurrence network of keywords or a map of a citation network of documents. In all other cases, the repulsion parameter has a default value of 1. The attraction parameter always has a default value of 2.
23
box is not checked, the parameter values specified in the Attraction and Repulsion text boxes are used.
o Advanced Parameters. This button brings up the Advanced Layout Parameters dialog box. This dialog box can be used to change a number of more advanced parameters of the VOS layout technique. The following parameters are available:
▪ Random starts. This parameter determines the number of times the optimization algorithm of the VOS layout technique is run. Each time the optimization algorithm is run, a different layout may be obtained. The best layout obtained in all runs of the optimization algorithm is used as the final layout. The higher the value of the Random starts parameter, the higher the quality of the final layout that is obtained.
▪ Max. iterations. This parameter determines the maximum number of iterations performed by the optimization algorithm of the VOS layout technique. The higher the value of the parameter, the higher the quality of the layout that is obtained. In general, the default value of the parameter works well and does not need to be changed.
▪ Initial step size, Step size reduction, and Step size convergence.
These are technical parameters of the optimization algorithm of the VOS layout technique. The parameters must have values between 0.000001 and 1. In general, the default values of the parameters work well and do not need to be changed.
▪ Random seed. This parameter determines the seed of the random number generator used by the optimization algorithm of the VOS layout technique. The seed must be a non-negative integer.
o Update Layout. This button is available only if information is available about the links between the items in the currently active map. Use this button to update the layout of the currently active map using the VOS layout technique.
• Clustering.
o Resolution. This parameter determines the level of detail of the clustering produced by the VOS clustering technique. The parameter must have a non- negative value. The higher the value of the parameter, the larger the number of clusters produced by the VOS clustering technique. We recommend to try out different values for the Resolution parameter and to
24
use the value that yields the most appropriate level of detail for one’s purposes.
o Min. cluster size. This parameter determines the minimum size of clusters produced by the VOS clustering technique. Each cluster produced by the VOS clustering technique is expected to include at least the minimum number of items specified by this parameter. The Min. cluster size parameter can be used to simplify the clustering results obtained from the VOS clustering technique by getting rid of small and uninteresting clusters.
o Merge small clusters. This check box determines how the VOS clustering technique handles small clusters. Small clusters are clusters that do not have the minimum cluster size specified by the Min. cluster size parameter. If the check box is checked, small clusters are merged into larger clusters. If the check box is not checked, small clusters are discarded and their items have no cluster assignment.
o Advanced Parameters. This button brings up the Advanced Clustering Parameters dialog box. This dialog box can be used to change a number of more advanced parameters of the VOS clustering technique. The following parameters are available:
▪ Random starts. This parameter determines the number of times the optimization algorithm of the VOS clustering technique is run. Each time the optimization algorithm is run, a different clustering may be obtained.
The best clustering obtained in all runs of the optimization algorithm is used as the final clustering. The higher the value of the Random starts parameter, the higher the quality of the final clustering that is obtained.
▪ Iterations. This parameter determines the number of iterations performed by the optimization algorithm of the VOS clustering technique.
The higher the value of the parameter, the higher the quality of the clustering that is obtained. In general, the default value of the parameter works well and does not need to be changed.
▪ Random seed. This parameter determines the seed of the random number generator used by the optimization algorithm of the VOS clustering technique. The seed must be a non-negative integer.
o Update Clustering. This button is available only if information is available about the links between the items in the currently active map. Use this button to update the clustering of the currently active map using the VOS clustering technique.
25
• Rotate/flip.
o Rotate. Use this button to rotate the currently active map. The Degrees to rotate parameter determines the number of degrees by which the map is rotated.
o Flip Horizontally. Use this button to flip the currently active map in horizontal direction.
o Flip Vertically. Use this button to flip the currently active map in vertical direction.
3.5.4 Create Map wizard
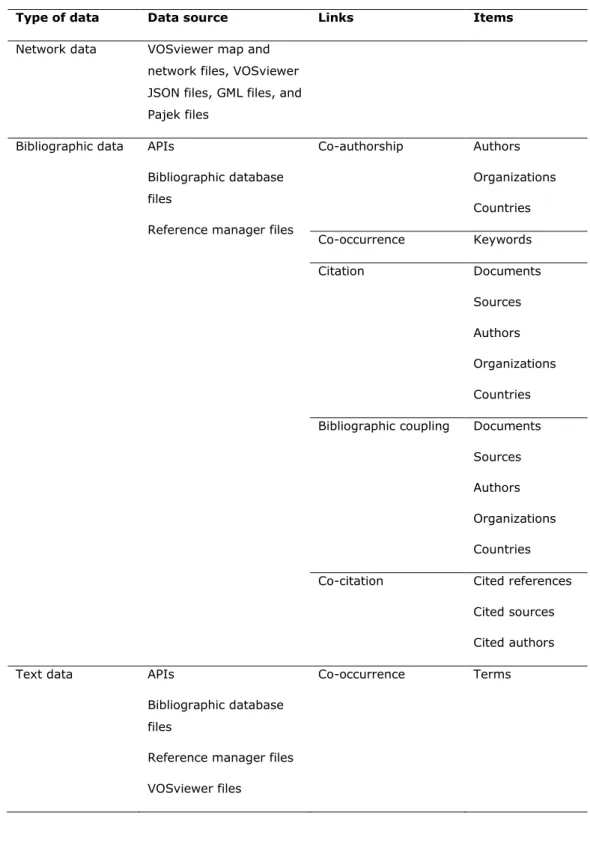
The Create Map wizard can be used to create a new map. There are a number of ways in which a new map can be created. The Create Map wizard offers a guide through the various options in a number of steps. A summary of the main options provided by the wizard is presented in Table 1.11
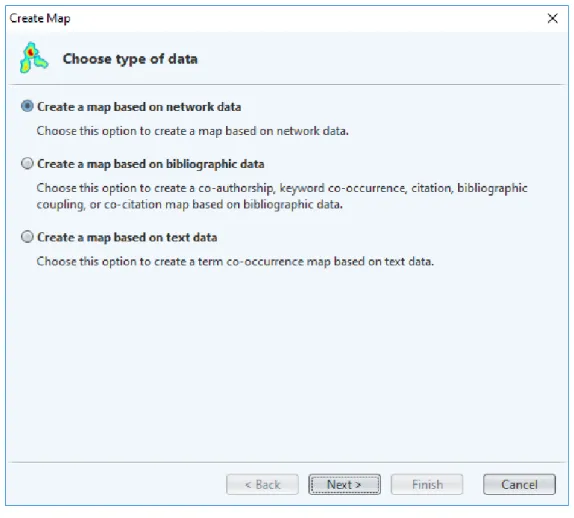
As can be seen in Table 1, a map can be created based on network data, bibliographic data, or text data. The choice between these three types of data is made in the first step of the Create Map wizard, as shown in Figure 6.
When a map is created based on network data, VOSviewer needs to be provided with information about the items in the network and the links between the items.
This information can be made available in a VOSviewer network file, possibly complemented with a VOSviewer map file (see Section 4.1). Alternatively, the information can be made available in a VOSviewer JSON file, in a GML file, or in Pajek files. There are no restrictions on the nature of the items and the links in a network. The items and the links will typically be of a bibliometric nature, but this is not a requirement.
11 The terminology used in Table 1 is identical to the terminology that is used in the Create Map wizard.
Elsewhere in this manual, we sometimes use a different terminology. Documents may be referred to as publications, sources as journals, and authors as researchers.
26
Table 1. Summary of the main options provided by the Create Map wizard for creating a new map.
Type of data Data source Links Items
Network data VOSviewer map and network files, VOSviewer JSON files, GML files, and Pajek files
Bibliographic data APIs
Bibliographic database files
Reference manager files
Co-authorship Authors Organizations Countries Co-occurrence Keywords
Citation Documents
Sources Authors Organizations Countries Bibliographic coupling Documents
Sources Authors Organizations Countries Co-citation Cited references
Cited sources Cited authors
Text data APIs
Bibliographic database files
Reference manager files VOSviewer files
Co-occurrence Terms
27
Figure 6. First step of the Create Map wizard.
When a map is created based on bibliographic data or text data, first a network is constructed based on the data that is made available to VOSviewer and then a map is created based on the constructed network. As can be seen in Table 1, different types of networks can be constructed. Bibliographic data can be used to construct a network of co-authorship, co-occurrence, citation, bibliographic coupling, or co- citation links.12 Depending on the type of link, different types of items are supported, as shown in Table 1. Text data can be used to construct a network of co-occurrence links between terms. As discussed in more detail below, terms are identified in the text data using natural language processing algorithms.
12 A citation link is a link between two items where one item cites the other. Citation links are treated as undirected by VOSviewer. Hence, no distinction is made between a citation from item A to item B and a citation in the opposite direction. A bibliographic coupling link is a link between two items that both cite the same document. A co-citation link is a link between two items that are both cited by the same document.
28
Bibliographic data can be downloaded by VOSviewer through an API or the data can be made available to VOSviewer in bibliographic database files and references manager files. VOSviewer supports the APIs of OpenAlex, Crossref, Europe PMC, Semantic Scholar, the OpenCitations Corpus (OCC), the OpenCitations Index of Crossref open DOI-to-DOI citations (COCI), and Wikidata. Furthermore, support is provided for bibliographic database files from Web of Science, Scopus, Dimensions, Lens, and PubMed. Reference manager files from EndNote and RefWorks are supported, in addition to RIS files. APIs, bibliographic database files, and reference manager files can also be used to make text data available to VOSviewer. Text data is obtained from the titles and abstracts of documents. Alternatively, text data can be made available in a VOSviewer corpus file, possibly complemented with a VOSviewer scores file (see Section 4.2).
Below, a number of topics related to the Create Map wizard are discussed in more detail.
APIs
The APIs (application programming interfaces) supported by VOSviewer are listed in Table 2. Using these APIs, VOSviewer is able to download data based on which a map can be created. The use of the APIs requires an internet connection. There are four ways in which the APIs can be used. We now briefly discuss each of the four options.
Table 2. APIs supported by VOSviewer.
API Documentation
OpenAlex https://docs.openalex.org/how-to-use-the-api/api- overview
Crossref https://api.crossref.org
Europe PMC https://europepmc.org/RestfulWebService Semantic Scholar https://api.semanticscholar.org
OCC https://w3id.org/oc/api/v1
COCI https://w3id.org/oc/index/coci/api/v1 Wikidata https://w3id.org/oc/index/wikidata/api/v1
The first option is to specify an API request URL. VOSviewer will download data for all documents returned by this request URL. The first option is available only for the OpenAlex, Crossref, and Europe PMC APIs. Only specific URL parameters are
29
considered. These URL parameters are 'search' and 'filter' for the OpenAlex API, 'query' and 'filter' for the Crossref API, and 'query' for the Europe PMC API. Other URL parameters are ignored. The request URL does not need to include parameters to control paging. Examples of request URLs for the different APIs are provided in Table 3. For more information, we refer to the documentation of the different APIs (see Table 2).
Table 3. Examples of request URLs.
API Example request URL
OpenAlex https://api.openalex.org/works?search=vosviewer&filter=type:article,language:en Crossref https://api.crossref.org/works?query.bibliographic=vosviewer&filter=type:journal-article Europe PMC https://www.ebi.ac.uk/europepmc/webservices/rest/search?query=(TITLE:\"vosviewer\")
The second option is to specify a search query. VOSviewer will download data for all documents that match the specified search criteria. The second option is available only for the OpenAlex, Crossref, and Europe PMC APIs. Moreover, there are various restrictions on the search criteria that can be specified, especially in the case of the Crossref API.
The third option is to provide a set of DOIs to VOSviewer. The DOIs are provided in a DOI file. Any text file that contains DOIs can be used as a DOI file. VOSviewer will identify all DOIs contained in a DOI file. It will then download data for all available documents with a matching DOI. The third option is available for all APIs.
The fourth option is to make an API call outside VOSviewer, to save the data resulting from the API call in a JSON file, and to provide the JSON file as input to VOSviewer. For each API, the documentation (see Table 2) explains how a call to the API can be made. An example in which the Crossref API is called and the resulting data is provided as input to VOSviewer is presented in a blog post available at www.cwts.nl/blog?article=n-r2r294. The fourth option is available for all APIs.
Bibliographic database files
VOSviewer supports five types of bibliographic database files: Web of Science files, Scopus files, Dimensions files, Lens files, and PubMed files.
Web of Science can be accessed at www.webofscience.com. A subscription is required. When exporting data from Web of Science, make sure that the Web of Science Core Collection database is selected. We recommend to use the so-
30
called classic version of Web of Science, since this version offers more extensive possibilities for exporting data than the new version that was introduced recently.
To go to the classic version of Web of Science, choose the Products option followed by the Web of Science (Classic) option. To export data in the classic version of Web of Science, choose the Export option followed by Other File Formats option, and choose either the Plain Text or the Tab-delimited file format. Although VOSviewer supports both file formats, we recommend the use of the tab-delimited format. When asked which data elements to download, choose the Full Record and Cited References option. Downloading cited reference data is necessary for identifying citation, bibliographic coupling, and co-citation links between items.
Scopus can be accessed at www.scopus.com. A subscription is required. To export data from Scopus, choose the CSV export option. (Do not choose the Download option!) Make sure that the data is exported in a CSV file and that all data elements are included.
Dimensions can be accessed at www.dimensions.ai. The free version of Dimensions, for which no subscription is needed, can be used. A user account is required. To export data from Dimensions, choose the Save / Export option, followed by the Export for bibliometric mapping option.
Lens can be accessed at www.lens.org. To export data from Lens, choose the Export option. Make sure that the data is exported in a CSV file and that all data elements are included.
PubMed can be accessed at https://pubmed.ncbi.nlm.nih.gov/. To export data from PubMed, choose the Save option and the PubMed format. Data exported from PubMed cannot be used for identifying citation, bibliographic coupling, and co- citation links between items. Hence, when working with PubMed data, some options in the Create Map wizard will not be available.
Different data sources have different limitations for the amount of data that can be exported. Web of Science and Scopus enable users to export data for at most 500 and 2000 documents, respectively. The free version of Dimensions enables users to export data for at most 2500 documents. Larger numbers of documents are supported when a subscription-based version of Dimensions is used. Lens and PubMed enable users to export data for at most 50,000 and 10,000 documents, respectively.
To export larger amounts of data, the data needs to be exported in multiple batches. Each batch needs to be saved in a separate file. To facilitate working with
31
data exported in multiple batches, VOSviewer offers the possibility to create a map based on data from multiple files. The files must all be from the same data source.
Combining data from different data sources is not possible. If there are duplicate documents in the data provided as input to VOSviewer, the documents will automatically be deduplicated.
Reference manager files
VOSviewer supports three types of reference manager files: RIS files, EndNote files, and RefWorks files.
The RIS file format is a general file format for bibliographic data. It is supported by a large number of databases and software tools, such as EBSCOhost, Mendeley, ProQuest, Publish or Perish, and Zotero.
The EndNote and RefWorks file formats are supported by the EndNote and RefWorks reference managers, respectively. They are also supported by other databases and software tools, such as the China National Knowledge Infrastructure.
Data from reference manager files cannot be used for identifying citation, bibliographic coupling, and co-citation links between items.
Thesaurus files
When a map is created based on bibliographic data or text data, there often is a need to perform data cleaning. A VOSviewer thesaurus file can be used for this purpose.
When creating a map based on bibliographic data, a VOSviewer thesaurus file can be used to merge different variants of a source title, an author name, an organization name, a country name, or a cited reference.13 This may for example be useful when the name of a researcher is written in different ways in different documents (e.g., with the first initial only or with all initials). A VOSviewer thesaurus file can then be used to indicate that different names in fact refer to the same researcher.
When creating a map based on text data, a VOSviewer thesaurus file can be used to merge terms. This may be useful not only for merging synonyms (e.g., ‘h-index’
and ‘Hirsch index’), but also for correcting spelling differences (e.g., ‘behavior’ and
13 An alternative approach to data cleaning is the use of the OpenRefine tool available at https://openrefine.org. A tutorial explaining the use of OpenRefine to clean Web of Science or Scopus data can be found at https://bit.ly/2H9l31z.
32
‘behaviour’). In addition, it may also be useful for merging abbreviated terms with full terms (e.g., ‘JIF’ and ‘journal impact factor’). A thesaurus file can also be used to ignore terms. For example, when working with titles and abstracts of scientific publications, one may want to ignore general terms such as ‘conclusion’, ‘method’, and ‘result’.
We refer to Section 4.3 for a technical discussion of VOSviewer thesaurus files.
Processing of cited references
When constructing citation, bibliographic coupling, or co-citation networks based on Web of Science, Scopus, or Crossref JSON files, VOSviewer needs to process the cited references in these files. This can be a highly challenging task, because cited references may be provided in many different formats and may suffer from various types of ambiguities and inconsistencies. Below we discuss how cited references are processed by VOSviewer.
VOSviewer starts by parsing cited references in order to identify their constituent elements, such as author names, publication years, source titles, volume numbers, and so on. Each of these elements is converted to lower case, so that subsequent processing of cited references is done in a case-insensitive manner. There can be considerable variation in the way in which cited references are formatted, especially when working with Scopus files. Parsing is therefore far from straightforward, and VOSviewer may not always be able to completely parse a cited reference.
After cited references have been parsed, a citation, bibliographic coupling, or co- citation network can be constructed. We first consider the construction of a citation network. To construct a citation network, a so-called match key is created for each cited reference. This is done according to the following three rules:
1. Use as the match key the combination of the name of the first author, the publication year, the volume number, and the begin page number.
2. If no match key has been obtained in step 1, use as the match key the combination of the name of the first author, the publication year, the source title, and if available the begin page number. This rule is applied only if there is no volume number.
3. If no match key has been obtained in steps 1 and 2, use the DOI as the match key.
In rules 1 and 2, only the last name and the first initial are considered in the name of the first author. Also, in rule 2, only the first three alphanumeric characters are considered in the source title. Furthermore, when working with Scopus files, the
33
begin page number may be replaced by an article number in rule 1. Finally, in the case of Crossref JSON files, rules 1 and 2 are skipped and only rule 3 is applied.
To construct a citation network, VOSviewer also creates two match keys for each document. The first match key is obtained according to rules 1 and 2 described above. The second match key is given by the DOI of a document.
A citation link between two documents is established if one document includes a cited reference that has a match key corresponding with one of the two match keys used to represent the other document.
We now consider the construction of a bibliographic coupling network. Again a match key is created for each cited reference. The rules are the same as described above for the construction of a citation network, except that a fourth rule is added:
4. If no match key has been obtained in steps 1, 2, and 3, use the raw reference string as the match key.
The number of bibliographic coupling links between two documents equals the number of pairs of cited references in the two documents that have the same match key. (This assumes that the default full counting method is used. For more details, see the discussion on full counting vs. fractional counting provided below.) When working with Crossref JSON files, only rules 3 and 4 are used to obtain match keys. Moreover, rule 4 sometimes cannot be used, because raw reference strings are not always available in Crossref JSON files.
When a citation or bibliographic coupling network is constructed at the aggregate level of sources, authors, organizations, or countries, citation or bibliographic coupling links are aggregated from the level of individual documents to the aggregate level. For instance, to calculate the number of bibliographic coupling links between two sources S1 and S2, we consider all pairs of documents D1 and D2 such that D1 has been published in S1 and D2 has been published in S2. The number of bibliographic coupling links between S1 and S2 equals the sum over all pairs D1 and D2 of the number of bibliographic coupling links between D1 and D2.
Finally, we consider the construction of a co-citation network. No match keys are used to construct a co-citation network. When a co-citation network is constructed at the level of cited references, the raw reference strings are used as the unit of analysis. At the level of cited sources, source titles extracted from the raw reference strings are used as the unit of analysis. At the level of cited authors, author names extracted from the raw reference strings are used as the unit of analysis. When working with Web of Science or Crossref JSON files, only first authors are taken into account.
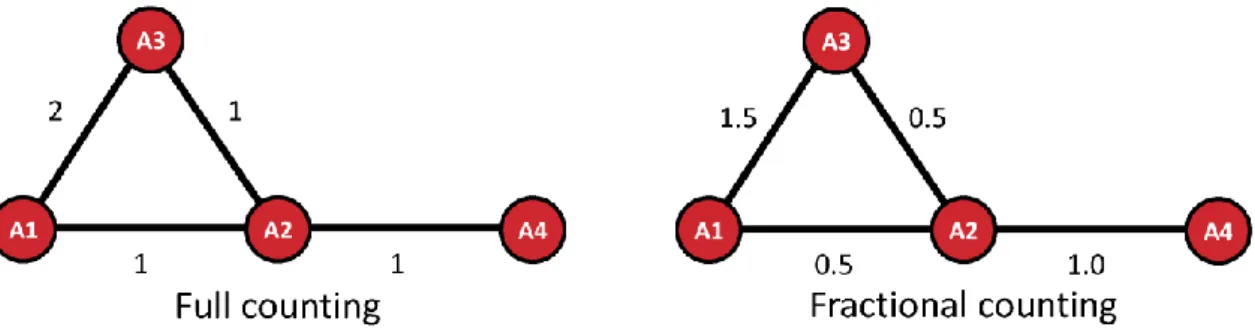
34 Full counting vs. fractional counting
When a map is created based on bibliographic data, the Create Map wizard offers a choice between two counting methods. By default, full counting is used. The alternative is to use fractional counting.
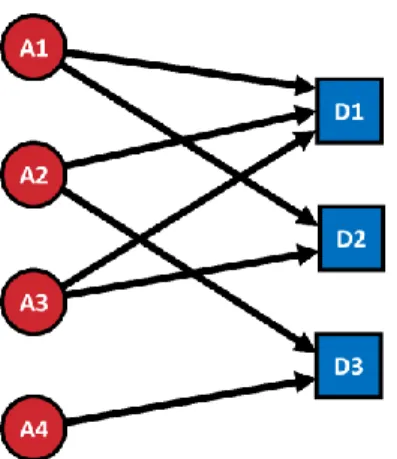
To illustrate the difference between the two counting methods, we consider an example in which a co-authorship network is constructed. As shown in Figure 7, we have four authors, labeled A1, A2, A3, and A4, and three documents, labeled D1, D2, and D3. D1 is authored by A1, A2, and A3, D2 is authored by A1 and A3, and D3 is authored by A2 and A4. The networks constructed using full and fractional counting are presented in Figure 8. We note that the only difference between the two networks is in the strength of the links.
In the full counting network, the link between A1 and A3 has a strength of 2. This indicates that A1 and A3 have co-authored two documents, namely D1 and D2.
The other links have a strength of 1, indicating that for each of these links the associated authors have co-authored one document.
The idea of fractional counting is to reduce the influence of documents with many authors. When fractional counting is used, the strength of a co-authorship link between two authors is determined not only by the number of documents co- authored by the authors but also by the total number of authors of each of the co- authored documents. In the case of fractional counting, when an author has co- authored a document with n other authors, this yields a strength of 1 / n for each of the n co-authorship links. The total strength of the n co-authorship links then equals 1. This is different from the full counting case, in which each of the n co- authorship links has a strength of 1, resulting in a total strength of the n co- authorship links of n.
Figure 7. Authorship links between four authors and three documents.