A further approximation is possible if you look at a lallina close to the front of the fat target. The aim of the experiment is to obtain the scattering cross section as a function of the energy (excitation curve) and of the angle (angular distribution). Suppose the difference between the energy of the particles seen by the magnetic spectrometer is E.
The condition of the leading edge of the target can be assessed by looking at the Li6.
CALIBRA TION OF APP ARA TUS 1. Electrostatic Analyzers
The 900 electrostatic analyzer was calibrated using the Li 7 at various times during the high energy portion of the experience. The average value of nine determinations was taken at various times during the experiment. was C'E:A. The magnetic spectrum constant used then was the average of the above values for each specific run.
No special effort was made to keep the integrator trigger voltage constant from run to run; however, the same capacitor was used for the copper scattering as for the Li6.
TARGET PREPARATION
A furnace was located below each distribution chamber so that with the use of a long target rod Li vapors could be performed and the targets moved directly up into the distribution chamber. The best targets achieved with this structure were possible: mainly due to the improved local vacuum. An additional feature of the new setup was the use of a very clean carbon rod "ball" type.
An indication of the quality of the objectives obtained with the two different setups is found by comparing the contamination peaks in the profiles of Figures 3 and 5.
STOPPING POWER MEASUREMENTS
However, a procedure was eventually developed so that Li 6. targets were not used for a period longer than eight hours. and relative deterrent powers deteriorated. The results of this determination are given in figure 12 and show that experimentally the stopping power for Li follows the Bloch curve at higher energy.
CORRECTIONS TO YIELDS
The true number of counts is estimated by counting at a very low counting rate. This correction was found to be necessary for the copper calibrations and Li6 front angle yields. In this experiment, the corrections for this effect were less than one percent for proton scattering, but were slightly larger for Li6.
While the experiment is being performed, one should check the operation of the scalar and the current leakage of the integrator.
EXPERIMENTAL RESULTS 1. Excitation Curves
THEORETICAL ANALYSIS OF THE DATA
DISCUSSION OF THE THEORETICAL EQUATION
Y l ' of the output channel, and arn.nuclear fraction fssll1 f for the formation and decay of a nuclear state with a certain spin J. The differential cross section for the distribution from the magnetic sub-state v of the spin of the input channel s to the magnetic sub- state v' of the output :spin channel is found by squaring the appropriate element of the amplitude matrix. For a given decay mode, the kernel part of the decay probability can be divided by defining the reduced width.
It was not possible, due to the divergent cross-section:at forward angle.s· and the unknown s-wave background, to perform a similar analysis in the case of Li6.
CONCLUSIONS
The p-wave scattering is consistent with resonant scattering by a state of spin and parity J?r = 5/2- with resonant parameters consistent with those from the mirror plane in Li 7. The s-wave scattering phase shift in"the 3/2 + spin channel (figure 51) does not show a resonance in the region from 0.45 to 2.9 Mev, but qualitatively follows the energy variation of charged hard sphere scattering with an interaction radius of about 2 fermis 35 Mev excitation in the compound nucleus Be 7. it must have a small r /r and a. a This state must then appear in the elastic scattering of He3.
It should also be noted that the mirror plane of this proposed state could not be generated in the Li6. The s-wave scattering phase shift in the 1/2+ spin channel has qualitatively the same behavior as that in the 3/2+ channel at low energy, but starts to show resonant behavior at about 1. The parameter s for the 3/2 + state ( proposed by Marion to explain the energy and angular variation of the Li 6(p, a)He 3 reaction) was obtained from the rearranged Li6.
APPENDIX I
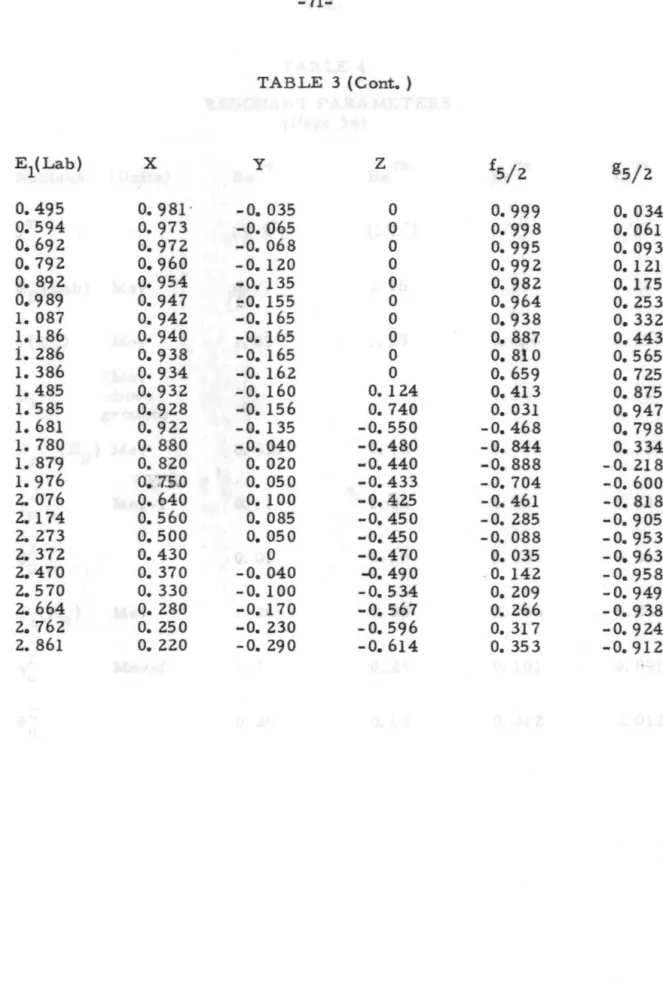
The ratio between the elastic scattering cross section and the Rutherford cross section is therefore An example of a scattering analysis will be given for the case El(Lab) :: 1. Since the method used is described in Section III-c, only an outline of the procedure with specific figures will be given here.
The program was written so that most of the calculations could be done on a Burrough 220 computer. An attempt to fit the data with only s-wave protons was first made by calculating the values of the slopes of the six lines Y:: A( e)X + B( e) and six sections. The six lines were then drawn in the complex plane and shown in Fig. 47.
The above intercepts H(9) were then added to the s-wave intercepts to obtain the dotted lines in Figure 47. It is clear that there is still no intersection and that the s-wave, p-wave interference intercepts ZG(9) must be added to the intercepts B( 9) + H( 9). These additional intercepts were added to the B(9) + H(9) intercepts to obtain the lines plotted in Figure 49.
An additional constraint on the above choice was that all three complex points are reasonable extrapolations of the values found at lower and higher energies. 1 The second line shows the experimentally determined ratios that must be compared with the calculated ratios.
APPENDIX III
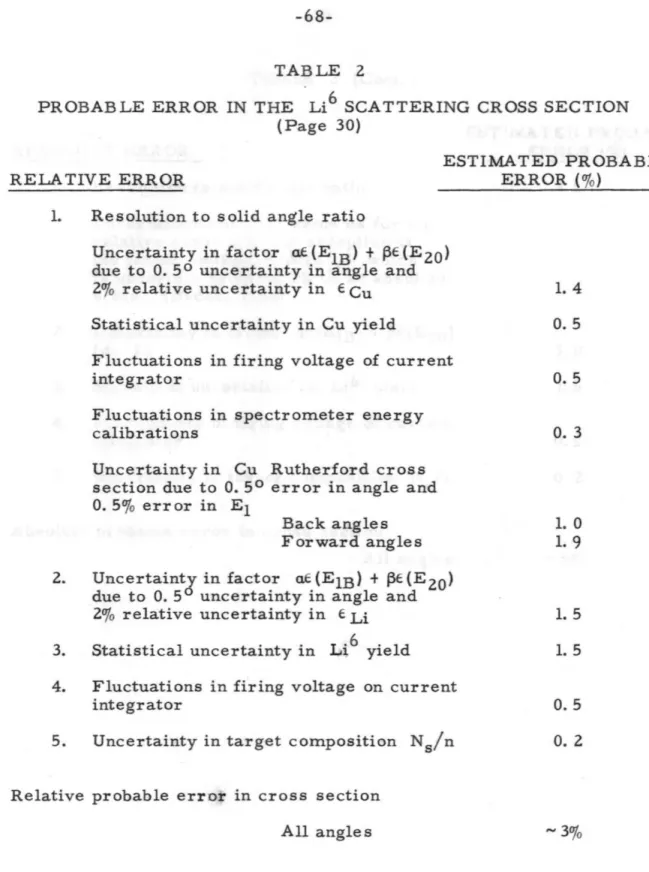
Different values of the channel spin mixing parameter M were chosen and an analysis was performed in the same way as for the 5/2 case and the 1/z case. However, for cases where the 3/Z state is almost entirely formed by the 1/2 spin channel or the 3/Z spin channel, an adjustment can be made to the data with a different choice of s-wave backing. 5 uncertainty in angle and 2"/0 relative uncertainty in € Li Statistical uncertainty in Li.6 yield Fluctuations in ignition voltage on current integrator.
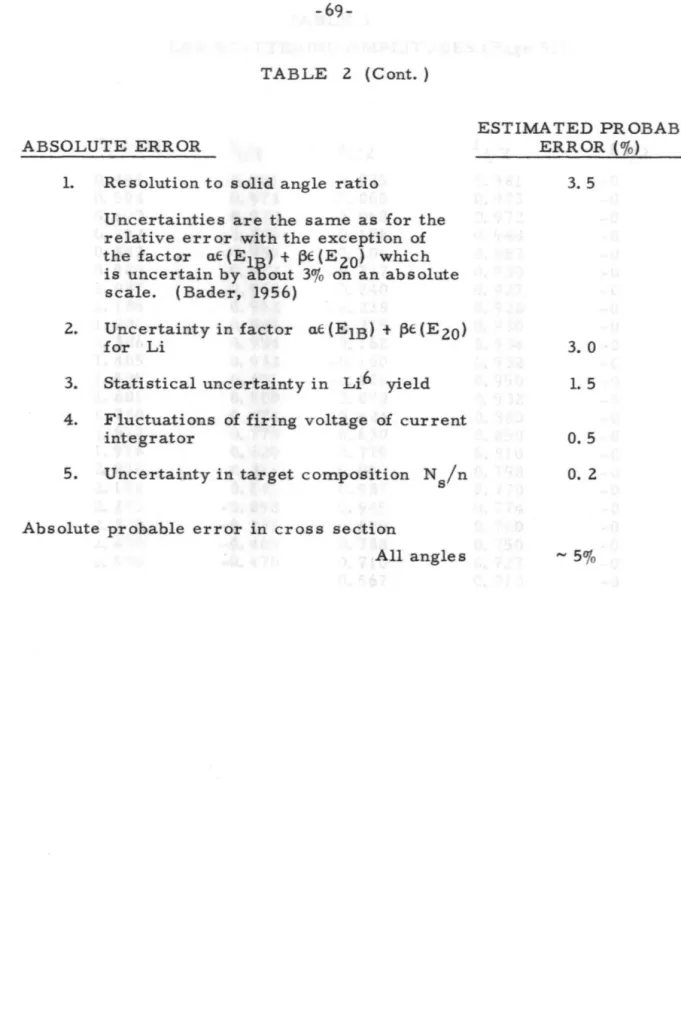
Uncertainties are the same as for the relative error with the exception of the factor a€ (E IB ) + f3€ (E 20) which is uncertain by about 3% on an absolute scale. The perpendicular to the target surface is oriented at an angle 81 from the direction of the incident beam and at an angle 8. Particles hitting the front surface of the target with bombardment energy EIB scatter or form a reaction at the surface and leave angle 8 .
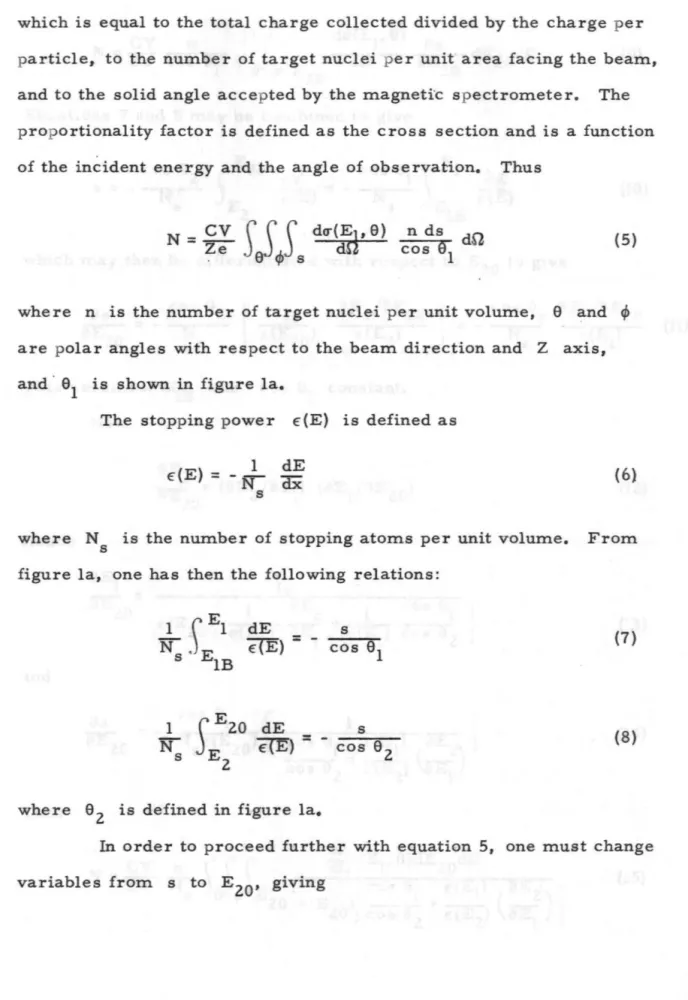
El will be less than EIB and similarly the energy of the particle accepted by the spectrometer E. Figure band c represents the scattering situation in the determination of the stopping cross section for protons in lithium. The voltage across a precision resistor is plotted on the abscissa and is proportional to the current through the flux=eter in the magnetic spectrom.eter.
As indicated on page 13, this current is inversely proportional to the square root of the energy of the particles accepted by the magnetic spectrometer. Most of the protons will penetrate the target, scatter at a certain point and also exit in the same direction as the protons from which they were scattered.
FLUXMETE R (volts)
The fixed points are measurements by Bader et al., (Bader, 1956) and Warters et al. (Warters. 1953) of the stopping cross section for protons in Li. Relative stopping power measurements made in this experiment are indicated by crosses and triangles and show that the Bloch curve does indeed apply to lithium as well as to all the other elements (Whaling, 1958). In this graph, the difference between the true number of counts and the number of counts recorded for a given load collected is plotted against the reciprocal of the number required for collection.
An estimate of the true number of counts is found by counting very low. The ratio of the measured elastic scattering cross section to the Rutherford scattering cross section from a point charge is plotted as a function of laboratory proton energy (in Mev) for three C. The crosses indicate data taken on the 2-Mev machine and dots indicate data derived from measurements on the 3- Mev the machine.
The curve marked with open circles is calculated for the 5/2-p-wave resonance state as shown on page 27. The curve marked with crosses is the sum of the Rutherford cross section and the cross. The triangles represent the s-wave scattering cross section calculated from the s-wave scattering amplitudes determined in the data scattering analysis.
The solid curve through the experimental points is the sum of the s-wave background, the 5/2-p-wave resonance mode, and the Rutherford cross section; and represents a theoretical fit to the data. In the following figures, the ratio of the measured scattering cross section to the calculated Rutherford cross section is plotted as a function of the center of mass angle. 700• The curves are calculated from Equation 97 using the values of the scattering amplitudes derived from the analysis and given in Table 3 and shown in Figure 48.
The curve shown by the dots is the measured superposition of the thick target a++ and.

Integrated reaction cross section for Li6. Page 30) The low energy data indicated by the solid line are those of Sawyer and Phillips, (Sawyer, 1953). The curve indicated by the open circles is that calculated for a 5/2-p-wave resonant condition as shown on page 49. The curve indicated by crosses is the difference between this curve and the measured curve and the s-wave response background was assumed in the analysis of the scattering data.
I NTEGRATEO REACTION CROSS-SECTION
AMPLITUDE MATRIX
AND P- WAVE FIT
The coefficients IT sl(E.l) shown in this diagram are obtained from the analysis of the scattering data directly from the coefficient Z, as shown on page 51. The s-wave scattering amplitudes can be written in terms of phase shifts in the following way: =. The 3/2 spin channel exhibits this behavior over the entire studied area and in particular does not exhibit any resonance behavior near 1 Mev.
WAVE SCATTERING PHASE SHIFTS