The literature shows that the mechanical properties of porcelain are often measured without measuring the elastic properties. When the modulus of elasticity and fracture surface energy are included in the analysis of the strength data, the porcelains behave in a completely brittle manner, showing that the proposed theories describing the mechanical behavior are unnecessary. This work shows a direct relationship between failure stress and elastic modulus of quartz and alumina porcelains with a uniform defect population.
Real-time age effects on strengths were found to be non-existent and cyclic exposure to high-pressure steam caused the unglazed test sample to increase significantly in strength.
Introduction
Mechanical Properties of Porcelains
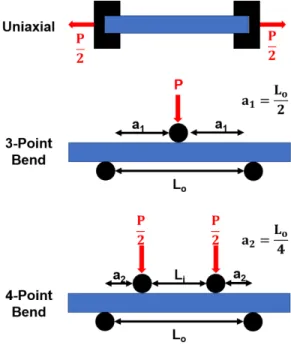
Mechanical Testing of Brittle Materials
However, due to the geometry of the test, the samples must be gripped, with stresses concentrated locally at the gripping locations. Therefore, the probability that the largest error will cause failure increases, resulting in statistically lower strengths. As a result, a 4-point bend test configuration is preferred due to the larger volume tested and ease of implementation.
However, the curvature of the bar generates a high stress intensity on the tensile bar surface, concentrating the stress in a small volume.
Fractography
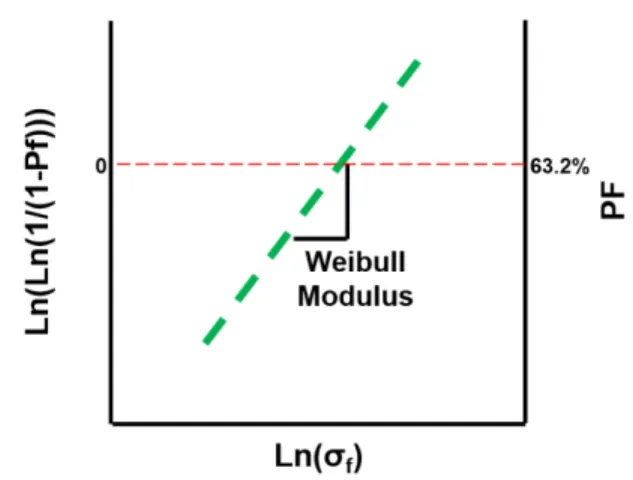
Weibull Statistics
Experimental Procedure
Sample Preperation
Extrusion
Glazing
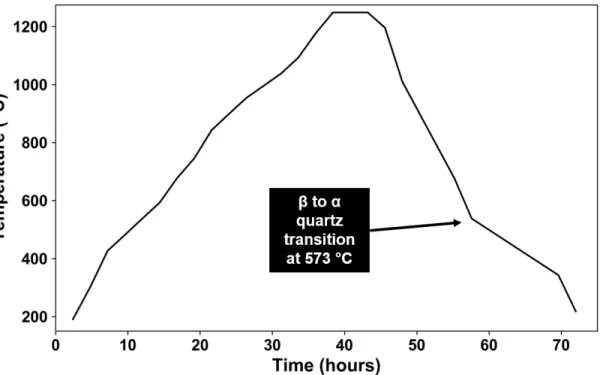
Firing
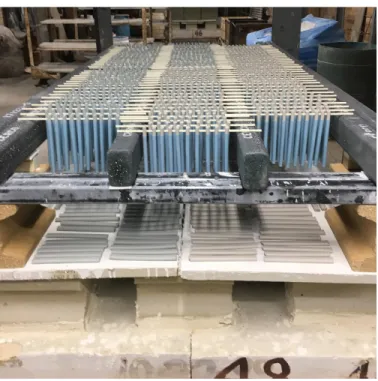
Glazed bent rods can be seen suspended from alumina rods and spanned over SiC beams.
Characterization
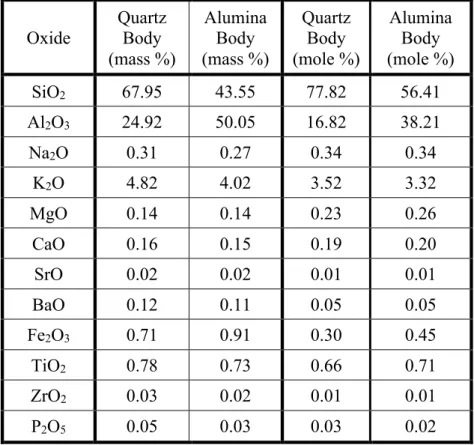
- Chemical Composition of Porcelain Bodies
- Mineralogy
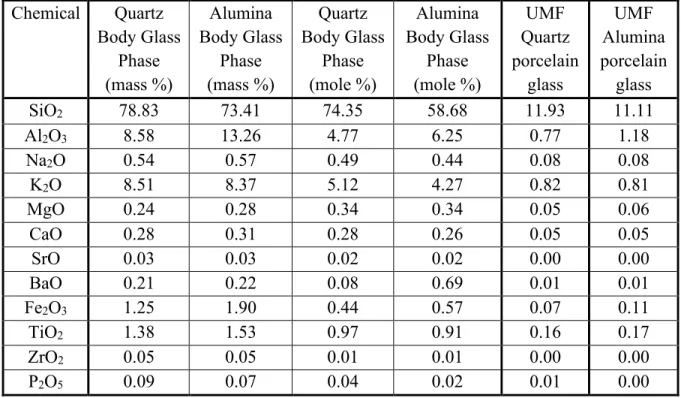
- Glass Phase Composition
- Apparent Bulk Density
- Elastic Modulus
- Glaze Chemistry
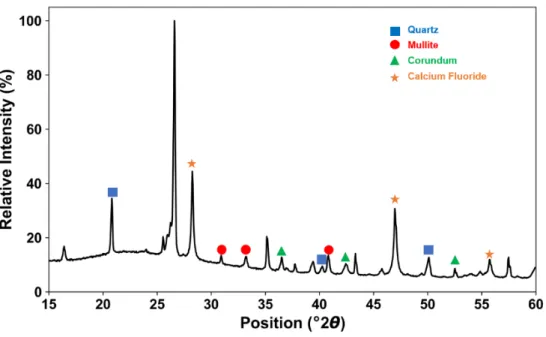
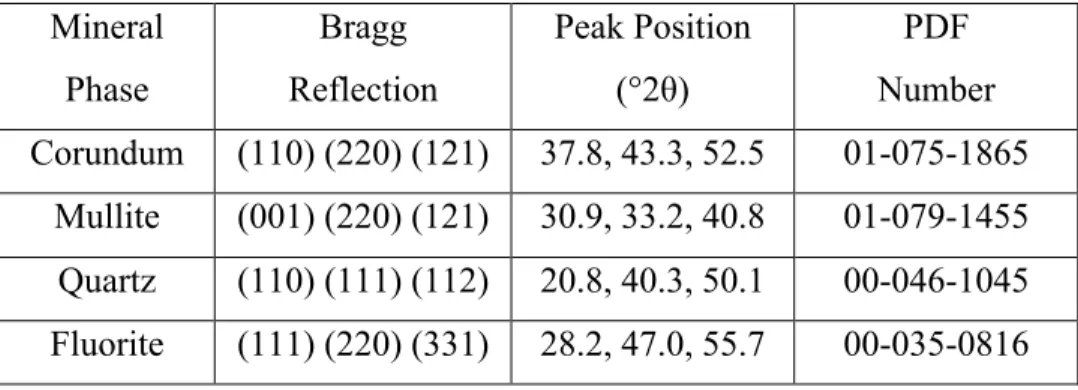
Analysis software (Jade, v.9, Materials Data Inc., Livermore, CA, USA) was used to determine peak areas of three non-overlapping peaks (Table II) per mineral phase. Peak areas are compared to three CaF2 peaks to determine quantitative mineralogical values based on a previously generated calibration curve (Table III).25,26 Note that mineralogical values assume no porosity in the fired bodies. Apparent bulk density (ρapp) and water absorption of the two porcelain composites were determined using a standard method adapted for small sample sizes by measuring to the nearest 0.1 mg.27 Resulting values are presented in Table V.
Two methods, dysplastic and acoustic, were used to determine the elastic modulus of the porcelain bodies and compared with calculated elastic modulus from rule of mixture (ROM). A calibration curve is generated from the loaded displacement behavior and applied to the crosshead displacement collected for the porcelain. An example of load-displacement curves for the raw data, instrument compliance and corrected data is presented in Figure 10.
Raw data load-displacement relationships, instrument compliance, and corrected data are obtained by subtracting the instrument compliance from the raw load-displacement behavior. The thickness of the sample was used to determine the speed of the acoustic wave in the material. Transverse (v156, Olympus IMS, Tokyo, Japan) and longitudinal (v110, Olympus IMS, Tokyo, Japan) transducers were coupled to the sample with honey, and then acoustic waves were applied.
Note that these values differ from those in Table III due to the introduction of blank space in the material. UMF, also known as Seger's formula, was used to characterize glaze based on its chemistry.
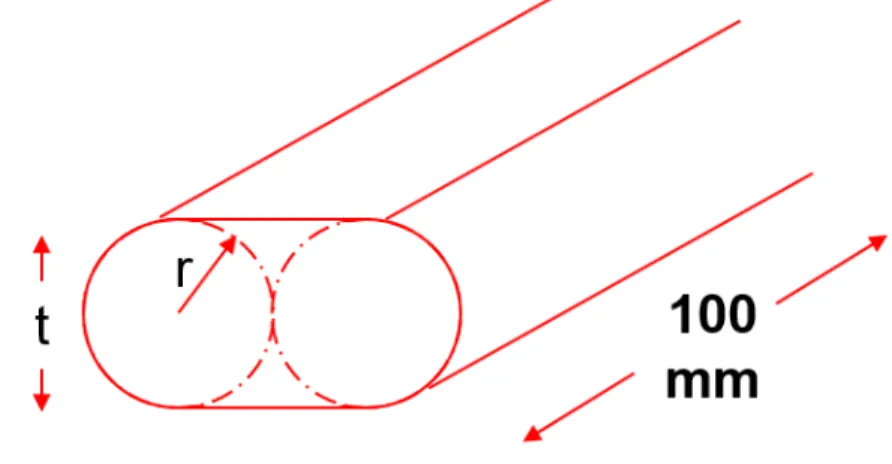
Test Specimen Design
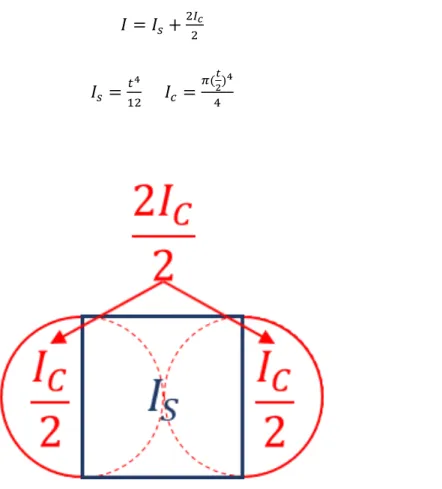
Substituting Equation 9 and Equation 11 into Equation 8 results in Equation 12 describing the stress at failure for the new test geometry. Where Pf and tf are, respectively, the load in newtons and the thickness at failure in meters resulting in stress values in pascals. A loading rate of 1 mm/min using a mechanical test frame (Model 5566, Instron Company, Norwood, Massachusetts) equipped with a 10 kN load cell was used to determine the failure load.
A fully articulated device provided normal loading on the surface of the specimen in accordance with a standard test method.22.
Fractography
Critical Flaw Size Calculations
Aging
Age of test specimens being tested and the corresponding number of test specimens being tested.
Aging in the Presence of Steam
Results and Discussion
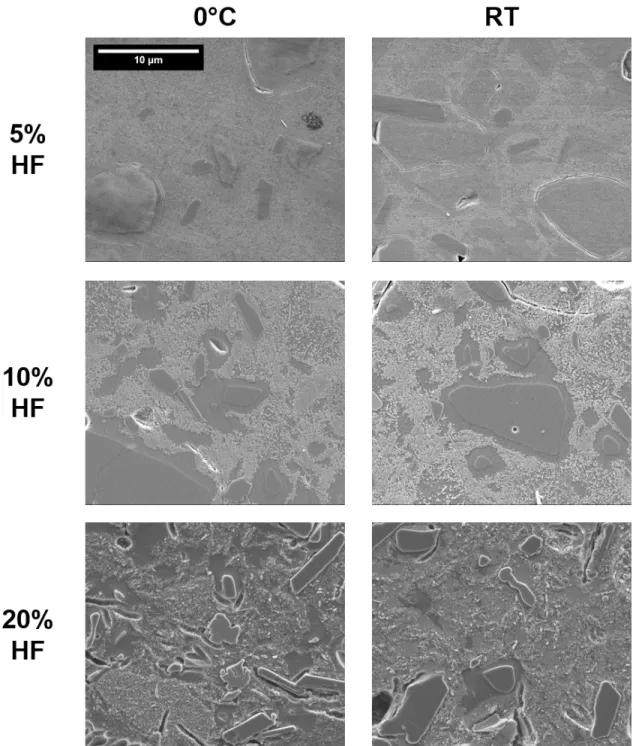
Microstructures – Determination of Etching Conditions
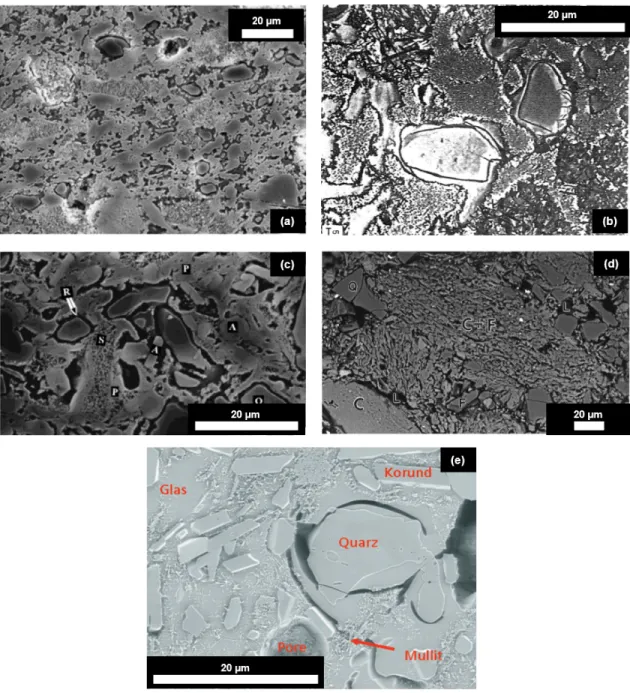
The microstructures of quartz and alumina porcelain etched under ideal conditions are shown in Figure 15. Microstructural features in (a) quartz and (b) alumina porcelain etched for 10 seconds in 10 wt. % HF at room temperature.
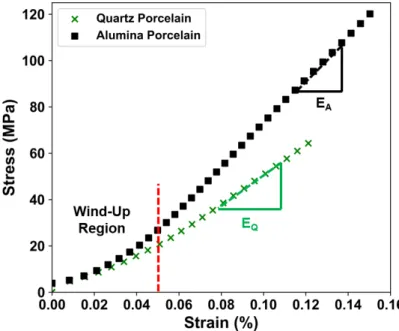
Stress-Strain Relationships
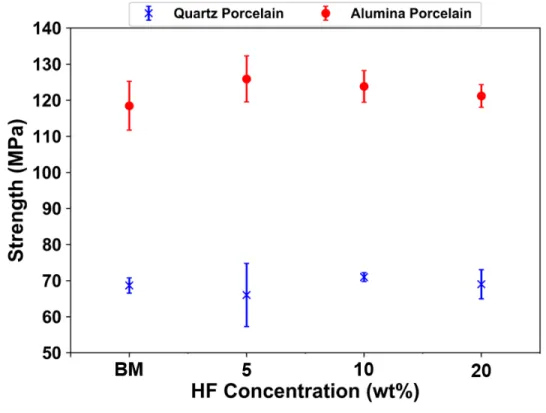
Both samples show the same constituents, with the alumina porcelain having higher levels of corundum. Failure criteria for brittle materials are directly related to the modulus of elasticity due to its relationship to fracture surface energy. However, elastic modulus is rarely discussed in relation to the strength of porcelain.3,5,8 It has been shown that the strength scales linearly with the elastic modulus, which directly affects the strength of porcelain.7.
Values obtained using the pulse-echo technique are in good agreement with the literature7,23 and approximately 30% higher than those obtained by displacement. Pulse-echo modulus of elasticity, also referred to as zero-strain modulus of elasticity, values were used for strain at failure and critical flaw size calculations. The elastic modulus, Eo, is not reported for the polished sample since the composite effects of
Real Time Aging
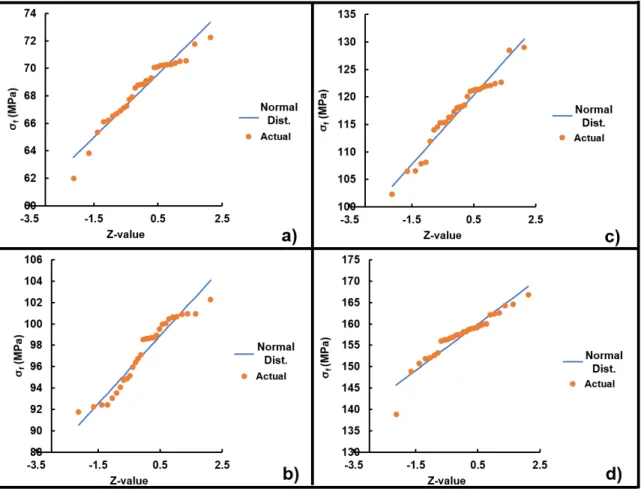
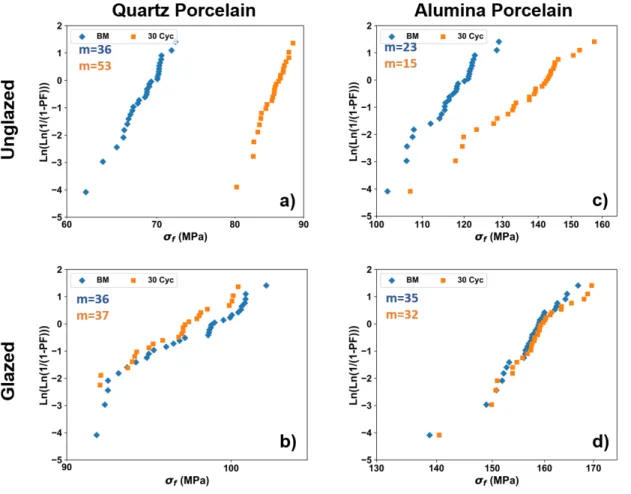
The composite stress at failure plotted against a Weibull distribution is shown in Figure 18 for the four sample sets tested at and 0.3 years. The alumina porcelain is about 45% stronger than the quartz porcelain which scales linearly with the difference in elastic modulus between the two systems. It is suggested that both porcelain bodies have the same defect populations as they were processed in the same manufacturing environment.
Stress at failure plotted against Weibull distribution for sets of specimens tested for the indicated times: (a) unglazed quartz porcelain (b) glazed quartz porcelain (c) unglazed alumino-porcelain and (d) glazed alumino-porcelain. It is evident from the four subplots that there are minimal changes in strength over the time interval evaluated. Parametric estimation (Figure 19), however, of the data sets shown in Figure 18, identifies a possible concurrent population of defects for the glazed aluminum samples, accounting for approximately 4% of the population, and a possible exclusive population of defects in the set of unglazed alumino-porcelain samples. , comprising.
An exclusive population of defects could be due to 1) variations in processing or 2) variation in mechanical testing. All samples were tested by the same operator, eliminating testing issues, and all samples were processed and fired together.
Origins of Failure
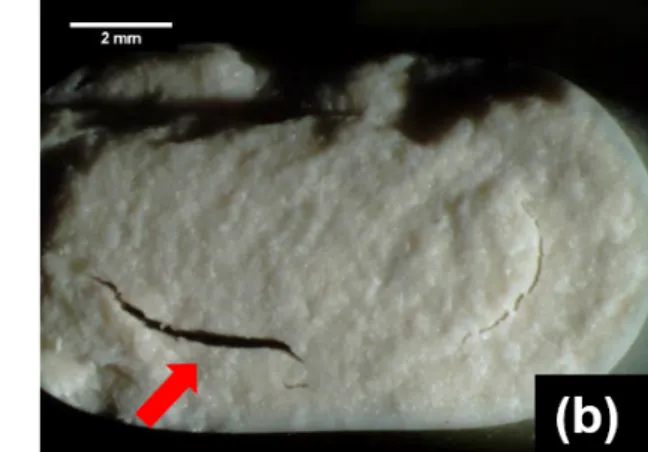
It was found that all unglazed test specimens failed at the tensile surface of the test specimen. Quartz grains at the fault origin are close in size to the calculated critical fault sizes. This generates a radial tensile stress in the quartz grains (and tangential compression) that increases as a function of grain size.
The initiation of failure within an individual quartz particle indicates two important conditions of quartz in porcelain: (1) the quartz particle is intimately bound to the glass matrix (and failure does not initiate in the matrix nor at the quartz-matrix interface); and (2) the elastic modulus of the quartz particle is higher than the surrounding matrix. Therefore, the act of mechanical testing adds additional stress to a quartz grain resulting in cracking of the quartz grain. Changes in porcelain composition are unrelated to defect population and degree to the elastic modulus of the porcelain body.
This indicates that flaw populations introduced in the processing of the test specimen are smaller than the effective size of the strained quartz grains. Defect size and strain at failure are not shown for the glazed specimens due to the unknown effects of the glaze on the modulus of elasticity. A Weibull distribution plotted as a function of the inverse critical flaw size (1/c) for unglazed quartz and alumina porcelain.
Therefore, the elastic modulus of the porcelain directly controls its strength, and not the residual quartz grain size. It has been shown that the elastic modulus is affected by the firing temperature, which determines the density (degree of porosity), and by the composition of the porcelain body.33-35 Therefore, these two variables can be used to create a porcelain body with high develop strength.
Aging in the Presence of Steam
Weibull plots comparing strengths after exposure to high-pressure steam for benchmark samples of (a) quartz porcelain, (b) glazed quartz porcelain, (c) alumina porcelain, and (d) glazed alumina porcelain. In order to investigate the increase in the strength of the porcelains after autoclaving, scanning electron images of the test sample surfaces were collected.
Matrix Cracking
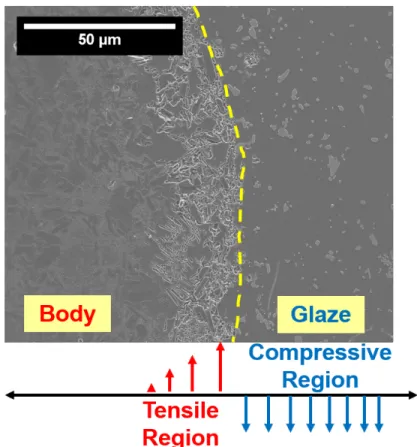
Microcracks can be expected to elongate due to cyclic exposure to high-pressure steam from both of these variables, resulting in a weaker test specimen. However, the compression glaze and the bulk body in the nervous state do not appear to be altered. It is reasonable to extrapolate this result to similar stress states present around quartz particles in an amorphous matrix due to the thermal expansion mismatch between the quartz and the glass matrix.
Role of Etching on Strength
- Summary and Conclusions
- Future Work
- References
- Apendix
The strength depends on the overall modulus of elasticity of the porcelain system, which dictates when sufficient stress is applied to fracture the quartz grain, which is already in a stressed state due to cooling, as mentioned earlier. Unglazed porcelain consistently failed on the tensile surface; however, the glazing caused the fault origins to be pushed towards the neutral axis. This indicates that the additive strain resulting from the CTE misalignment in the quartz grain is greater than the defects caused by the process.
This finding differs from previous theories that suggest failure initiates in the matrix through cracks resulting from CTE misalignment. The benefits of the four test groups will continue to be followed for the next three decades, allowing for the conclusion of a completely distinctive porcelain case. A test specimen aging on the roof of the McMahon Engineering Building at Alfred University on an unusually sunny day.
Seider, "Comparison of Strength of Triaxial Porceains Containing Alumina and Silica," Journal of the American Ceramic Society, 50 [7]. Ftikos, “Effect of firing conditions, filler grain size and quartz content on flexural strength and physical properties of sanitary porcelain,” Journal of the European Ceramic Society. Cook, "Effect of Grinding and Firing Treatments on Crystalline and Glass Content and the Physical Properties of Appliance Bodies," Journal of the American Ceramic Society.
Ambrozic, “Flexural strength of alumina ceramics: a comparison of Weibull statistics based on a very large experimental data set,” Journal of the European Ceramic Society. Yamamoto, “Applicability of crack propagation data to failure predictions in porcelain,” Journal of the American Ceramic Society.