More than just a cutoff: Medication refill adherence is linearly related to biomarkers of treatment response in hypothyroidism
by Kimberley ES Kondratieff
Thesis
Submitted to the Faculty of
the Graduate School of Vanderbilt University in partial fulfillment of the requirements
for the degree of MASTER OF SCIENCE
In
Biomedical Informatics December 12, 2020 Nashville, Tennessee
Approved:
Thomas A. Lasko (Chair), MD, PhD Candace D. McNaughton, MPH, MD, PhD Michael E. Matheny, MD, MS, MPH, FACMI
Acknowledgements
This thesis would not have been possible without the able help of my committee members. My heartfelt thanks go to Tom Lasko, my mentor, for setting my feet on this path and keeping them there when the going got rough, providing invaluable analytical insight, polishing my writing until it shines, and shaping me into the researcher I am today; to Michael Matheny, for teaching me to frame the scope of my research, asking excellent questions, and guiding me through the vast and wild thicket of VA data; and to Candace McNaughton, for giving her boundless
enthusiasm to this project, sharing her vast knowledge of the adherence literature, and suggesting we go after those wily cut points in the first place. My gratitude also goes to Michelle Griffith for insight and advice on the clinical aspects of thyroid disease. I am also deeply grateful to the National Library of Medicine; without the T32 and T15 training grants, I would have had to scramble much harder to fund my work! Finally, my deepest thanks to my family—Cynthia, Serguey, and Christopher—for providing sanity walks, free meals, and a cool place to sleep in the summer heat while I labored away to finish this manuscript.
Table of Contents
Acknowledgements ... ii
List of tables ... v
List of figures ... vi
1. Introduction and background ... 1
Introduction ...1
Methods of adherence measurement ...3
Use and shortcomings of adherence cut points ...6
Thyroid diseases as model conditions ...8
2. Assessing the relationship between levothyroxine refill adherence and serum TSH levels .. 12
Overview ... 12
Materials ... 12
The VA CDW ... 12
Refill and lab records in the CDW ... 13
The VINCI workspace ... 14
Methods ... 14
Preliminary feasibility study ... 14
Record selection ... 15
Data cleaning... 17
Adherence calculation... 18
Determination of medication adherence preceding TSH lab values ... 20
Analysis of the medication refill adherence-treatment success relationship ... 22
Results ... 23
Patient cohort ... 23
Determining the relationship between refill adherence and treatment success ... 26
Examining the continuous refill adherence-TSH relationship ... 28
Discussion ... 29
3. Clinical factors influencing the adherence effect on serum TSH ... 35
Overview ... 35
Methods ... 35
Subgroup definition ... 35
Data cleaning... 36
Effect of indication for treatment on the refill adherence-treatment success relationship ... 36
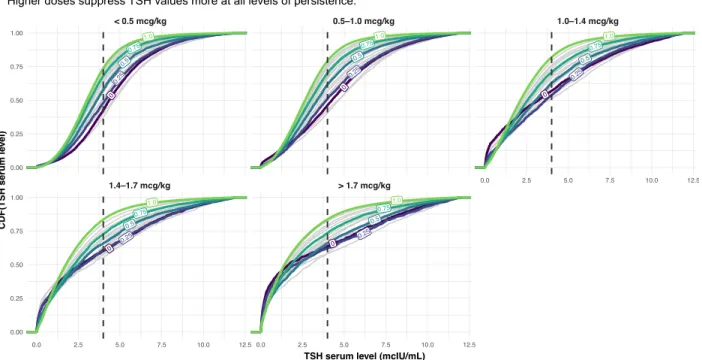
Effect of dose on the refill adherence-treatment success relationship ... 37
Results ... 38
Effect of indication on the refill adherence-treatment success relationship ... 38
Effect of weight-based levothyroxine dose received on the refill adherence-treatment success relationship 40 Discussion ... 44
4. Conclusions ... 51
Conclusion ... 51
Study limitations ... 52
Limitations due to patient demographics, biology, and behavior ... 52
Limitations related to treatment received ... 54
Definitional limitations ... 54
Future directions... 57
Appendix ... 64
References... 66
List of tables
Table 1: Statistics for patient subgroups. ... 23 Table 2: By-indication linear regression fit parameters. ... 39
List of figures
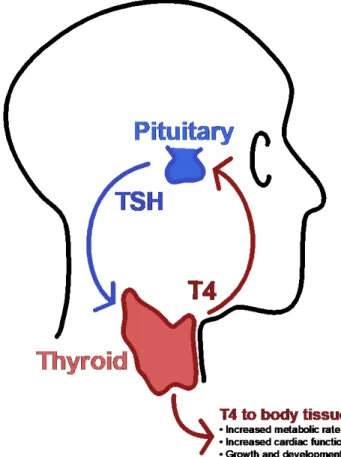
Figure 1: Diagram of the pituitary-thyroid feedback loop ... 9
Figure 2: Calculating a PDC trajectory from a supply diary ... 18
Figure 3: Method of calculating preceding adherence for lab draws. ... 20
Figure 4: Inclusion-exclusion flowchart ... 24
Figure 5: Linearity of adherence-treatment success relationship ... 26
Figure 6: Distribution of times between medication refills and following serum TSH draws... 27
Figure 7: Effect of adherence on serum TSH value distributions ... 28
Figure 8: Effect of treatment indication on treatment success ... 38
Figure 9: Effect of treatment indication on serum TSH value distributions ... 40
Figure 10: Effect of weight-based dose on treatment success ... 41
Figure 11: Effect of weight-based dose on serum TSH value distributions ... 42
Figure 12: Interactions between adherence, dose, and indication for treatment ... 43
Appendix Figure 1: Site-level replication of the inverse dose-treatment success relationship. . 64
1. Introduction and background
Introduction
Accurate, appropriate methods for quantifying medication adherence have generated considerable research focus for the last fifty years[1–8], and understandably so: adequate medication-taking remains necessary for effective pharmacotherapy[9–11] and patients still do not take their medications as prescribed for a wide range of conditions[6,12,13]. Reasons for inadequate adherence are numerous and include psychosocial, environmental, and economic factors affecting both patients and providers. Adherence itself is understood to be a complex set of behaviors (filling, remembering, ingesting, and refilling medications) that changes over time[9,10,14–18]. Patient expectations and experiences of symptoms and side effects further influence their adherence behaviors[9,10,14,18,19]. Proper methods of quantifying adherence and linking it to appropriate outcomes are foundational for any study seeking to understand its complexity.
Choices of outcomes shape the development and understanding of adherence measures. While the effects of adherence on healthcare costs, mortality, and morbidity, are well-studied, comparatively few studies examine the direct biochemical effects of adherence.
Biomarker levels are commonly measured or used as treatment targets in studies of
hypertension, hypercholesterolemia, HIV disease, diabetes, and other chronic diseases, but the exact shape of the relationship between adherence and these direct outcomes of medication- taking is rarely characterized.
This knowledge gap has significant implications for both adherence research and clinical care. Research conducted using pharmacy refills as a measure of adherence makes certain
assumptions on patient behavior (patients are assumed take all doses of medications they refill as prescribed, ingesting the correct dose and number of doses per day, at the correct time[3]) and physiology (patients are assumed to absorb all the medication they take[17]). These assumptions often cannot be directly verified in practice. While the limitations of pharmacy refill records as a measurement of patient medication adherence are widely acknowledged in the literature, there are few studies that seek to characterize these limitations[17]. Studies that do try to bound the errors of refill adherence typically compare refill adherence to another, often indirect, adherence measure, with conflicting results[20–22].
In addition, many adherence studies operate under the assumption that adherence, however it is measured, can be reduced to a dichotomous variable during statistical analysis of its effect on outcomes. Patients are thus classed as “adherent” or “nonadherent” on the basis of pre-specified adherence thresholds, for which there is little clinical justification or empirical support in the literature. Not only do studies using dichotomous realizations of adherence lose statistical power by dichotomizing continuous variables[17,23–25], but the thresholds assumed may not provide actionable knowledge to care providers who cannot directly measure an individual patient’s adherence. Furthermore, care providers typically use clinically available phenomena—signs, symptoms, and lab values—to guide patient treatment, rather than oft- studied endpoints of (non)adherence like aggregate healthcare costs or mortality.
We hypothesize that the relationship between clinical biomarkers and medication adherence is continuous and cannot be adequately represented by treating adherence as dichotomous. We further hypothesize the shortcomings of pharmacy refill records as proxies
adherence on a medication and biomarker levels affected by that medication. To test these hypotheses, we conducted a large-scale retrospective study of levothyroxine refill adherence and serum TSH levels in a national cohort of Veterans within the Veterans Health
Administration hospital system. As a part of our study, we additionally developed computational and visual analysis methods to understand our results.
Methods of adherence measurement
Current methods of assessing medication adherence span a range of direct and indirect methods with differing advantages and biases[3,5,26].
Direct methods—such as patient observation, ingestible sensors[27,28], and blood testing for measurable drugs or their metabolites[29,30]—assess actual ingestion of
medication. While these give almost-certain evidence that medications have been taken, they are costly in both time and money, difficult to scale, and intrusive to patients. Blood testing provides only a single indication of whether a patient has or has not taken medication at a specific time point; unless repeated measurements are made, it does not assess adherence over time[29]. Depending on biological half-lives of the metabolites in question, blood testing may give only limited insight into whether the correct dose was ingested, and whether doses were ingested at prescribed time intervals[29,30]. Further, it is not possible to conduct
retrospective studies using direct methods of measurement unless data already exist for direct drug measurements or observed medication-taking.
Indirect methods measure proxies for medication ingestion and may be objective (based on pharmacy refill records, pill counts, or pill cap monitoring devices)[3] or subjective
(medication diaries, patient self-report, or physician assessment)[2]. While indirect methods cannot assess whether patients actually ingested medications, objective records-based methods can be used to estimate historical adherence from pre-existing patient data[3,8], to varying degrees of resolution in time. Among indirect, objective measurements of adherence, pill cap monitoring devices are regarded as the gold standard, as it is assumed patients rarely open a pill bottle without taking their medication[17]. But, like direct measurements of adherence, pill cap monitoring data and pill count data are generally only collected as part of prospective studies of adherence behavior. Records-based measures of adherence, on the other hand, can be calculated from pre-existing historical data, making them an attractive target for adherence researchers. Increasing availability of pharmacy claims data linkable to patient data has led to proliferation of studies using records-based adherence proxies.
The most common numerical formulations for records-based adherence proxies are the medication possession ratio (MPR) and proportion of days covered (PDC)[3,8]. While
formulations of both vary by publication, MPR may generally be calculated as:
(1) 𝑀𝑀𝑀𝑀𝑀𝑀 = total days supply of medication obtained in period number of days in observation period
The value of MPR can be greater than 1 due to oversupply when medications are refilled early (by the patient or due to automatic pharmacy refills), and thus it can overestimate
adherence. PDC, which measures the number of days in the time period “covered” by adequate medication, is therefore preferred. It may be expressed as a ratio or percentage and can be
(2) 𝑀𝑀𝑃𝑃𝑃𝑃 = number of days for which patient has sufficient medication number of days in observation period
Properly, PDC and MPR only measure a subset of adherence behaviors because they do not directly assess patient behavior after receipt of medication; patients may refill medication but then not ingest it, or ingest it some of the time but not all of the time, or ingest it in other ways that were not prescribed. The deficits of using refill adherence as an adherence
measurement are commonly acknowledged in the literature[5,8,13,17,20]. Among patients who refill medications but do not take them, the association between refill adherence and outcomes is weak[13,31]. Burnier (2019)[17] identifies this gap between refill adherence measures and actual patient behavior as a major hindrance in establishing the role of
adherence in patient outcomes. As support, he highlights several instances where studies using similar methods on the same drug and outcome measure demonstrated ambiguity in the level of medication refill adherence needed to achieve good outcomes.
A less-considered factor contributing to these ambiguous results is a lack of data on the detailed relationship between refill adherence and biochemically measured treatment success.
The long-term outcomes measured in many adherence studies—mortality, morbidity, cost of care—are mediated through a medication’s effect on biological systems, and clinicians typically use biomarkers rather than end points such as mortality to guide patient care. The
pharmacological activity of a medication may depend highly on patient adherence and therefore would be reflected in biomarker levels for certain medical conditions.
Few large-scale data-driven studies relate continuous, longitudinal adherence measures—measured by any method, whether direct or indirect—to the direct biochemical
outcomes of medication-taking. Outcomes such as mortality[32–34], hospitalization[32,35], or care costs[36–39] are more common. Large-scale studies using biomarkers as proximate endpoints frequently measure them a single time and/or only on long time intervals (e.g. HIV viral load at the end of a patient-year or the end of the study period[40]). Adherence assessed on long intervals may also obscure differences between patients who may have significantly different adherence patterns over the course of the study[4,40,41]. A wider variety of biomarkers are used in small-scale studies[42–45], but these studies also use less scalable methods of adherence evaluation such as pill counts and medication event monitoring systems[46,47], or potentially biased ones such as patient self-report. Further, it is rarely the case that such studies relate continuous adherence to continuous biomarker outcomes, versus discretizing both measures and potentially losing important detail[46].
One exception to these general trends is a study conducted on a cohort of diabetic Veterans by Egede et. al.[48] The authors compared glycosylated hemoglobin A1C levels to refill adherence (measured as MPR) on various antidiabetic agents. They used quarterly (90 day) measurements of both A1C and MPR, and found evidence suggesting the relationship between MPR and A1C is continuous and linear. This suggests that considerable information is lost in studies that dichotomize adherence outcomes, at least in the case of adherence to diabetic medications.
Use and shortcomings of adherence cut points
Despite recommendations to treat patient adherence as a continuous variable[3,5],
measures of patient adherence are instead commonly dichotomized into “adherent” or
“nonadherent” on basis of a pre-chosen cut point, typically 80%[17]. This cut point is often arbitrary, unsupported by research and generally chosen as a matter of convention[1], rather than justified with clinical or pharmacological reasoning[3,5,17]. The strongest case for a data- backed adherence threshold is found in HAART for HIV, with numerous studies supporting 95%
adherence as necessary for adequate virologic suppression[19]. However, that threshold may be contingent on treatment regimen prescribed[40] and adherence measure used[49].
Previous studies seeking to establish data-backed adherence thresholds, including those conducted among patients HIV, have typically not started by determining the underlying
relationship between continuous adherence and clinical/biological outcomes[17,50], nor whether it is one that can be adequately described by threshold values. Instead, most studies have attempted to fit a set of chosen cut points (or all possible cut points[51]) to the
data[39,50] and selected the one that achieved statistical significance in distinguishing adherent and nonadherent patients (in regression-based analyses)[40,52,53] or adequate sensitivity and specificity in detecting pre-specified “nonadherence” (in analyses comparing two or more methods of adherence evaluation)[54]. The cut-points recommended by these studies are usually highly heterogeneous and therefore difficult to implement in clinical care[47,50].
Even if all the difficulties in deriving and selecting appropriate cut points could be overcome, use of these “validated” cut points to dichotomize continuous variables still discards
information and biases subsequent statistical analyses[24,25,55].
We believe that indirect measures of adherence, calculated with appropriate granularity and compared to frequently-measured biomarker levels, could sufficiently determine the
existence of natural thresholds in the adherence-outcome relationship under certain
conditions. This is contrary to Burnier’s (2019) assertion that direct measures of adherence are necessary to derive appropriate data-based adherence thresholds by more strongly tying adherence to outcomes[17]. In order to investigate our hypothesis on the adequacy of indirect measures, we compared levothyroxine refill adherence to subsequent serum TSH levels. We further investigated whether such analysis—combined with patient data derived from linked electronic health records (EHR)—would offer insight into how refill-based methods over- and underestimate actual patient medication-taking.
Thyroid diseases as model conditions
Thyroid diseases are ideal model disorders for probing the relationship between refill adherence and biomarker outcomes. There are relatively few medications used to treat them, and most work by hormone replacement of triiodothyronine (T3), thyroxine (T4), or a
combination[56,57]. Thyroid diseases treated with hormone replacement include primary hypothyroidism, thyroid cancer, and disorders of TSH secretion such as hypopituitarism.
Levothyroxine (synthetic T4) is the most prescribed medication used to treat thyroid diseases. The generic formulation is inexpensive and widely available, reducing the role of cost in levothyroxine medication refill adherence[58,59]. Treatment effect of levothyroxine is determined by a laboratory response—serum TSH levels[56]—that is routinely evaluated in a primary care setting[56]. This treatment effect also occurs on the order of months[59], rather than hours or days, and requires sustained ingestion to achieve. Day-to-day variations in
trends. Additionally, there is less risk of so-called “white-coat adherence”—patients only taking their medications immediately prior to a clinic visit—affecting serum TSH levels.
The role medication (non)adherence plays in serum TSH response to
levothyroxine is also an attractive clinical target. Understanding this relationship in richer detail could enhance the quality of pharmacotherapy for thyroid diseases, potentially improving treatment for millions of patients.
Hypothyroidism, where the thyroid gland fails to produce adequate levels of T4, affects an estimated 20 million Americans.
For most of these individuals it is a lifelong disease that significantly reduces both quality and length of life if left
untreated[56]. Thyroid hormone
replacement with levothyroxine is key to managing both symptoms and poor outcomes in hypothyroidism, yet achieving adequate treatment is difficult[56,58,59]. More than 50% of patients who have been on levothyroxine for more than 12 months may be nonadherent; and even among adherent patients[60–63], both over- and undertreatment with thyroid hormones are prevalent in the population[62,64].
Figure 1: The pituitary-thyroid feedback loop balances blood levels of thyroxine (T4) and thyroid stimulating hormone (TSH). TSH levels stimulate the release of T4 from the thyroid, while T4 levels inhibit the release of TSH. In hypothyroidism, the thyroid produces insufficient T4 leading to high serum levels of TSH. In hypopituitarism, underproduction of TSH leads to low blood levels of T4. Both conditions are treated with levothyroxine.
Understanding the detailed relationship between serum TSH and levothyroxine adherence would give care providers another tool in assessing how well their patients are treated, and allow them to target interventions appropriately—whether toward encouraging patient
adherence, increasing levothyroxine doses, or discontinuing the medication in patients without clinical disease[56,59].
Levothyroxine is also used in long-term maintenance treatment of patients who have had thyroid cancer. An estimated 53,000 Americans are diagnosed with thyroid cancer each year[65]. Usual treatments for thyroid cancer include surgical resection of the thyroid and radioactive iodine ablation to destroy cancerous tissue. Because TSH drives thyroid cancer cell proliferation, adequate TSH suppression is essential in maintaining remission post-
treatment[57]. For thyroid cancer patients, proper adherence may be a matter of life or death.
But, the high doses of levothyroxine required to achieve TSH suppression can also lead to side effects and ensuing medication nonadherence[18,56,59]. Here also, detailed knowledge of the relationship between TSH levels and patient adherence would aid care providers in detecting and addressing nonadherence in their patients.
Hypopituitarism and other disorders of TSH secretion represent a special case for understanding the relationship between levothyroxine adherence and serum TSH levels.
Whether the disorder arises congenitally or due to later-life malignancy or injury,
hypopituitarism involves insufficient secretion of one or more pituitary hormones. When the pituitary produces inadequate amounts of TSH, the resultant disorder resembles
hypothyroidism and can be treated with supplementation of levothyroxine. But, because TSH
is no relationship between serum TSH levels and levothyroxine ingestion in these patients.
Therefore, studies linking levothyroxine adherence and serum TSH levels must carefully account for patients with hypopituitarism.
2. Assessing the relationship between levothyroxine refill adherence and serum TSH levels
Overview
In this study, we directly relate levothyroxine refill adherence, measured as PDC, to subsequent serum TSH levels using large-scale EHR data from the VHA. We seek to characterize the relationship between adherence and treatment success, defined as a serum TSH value below the reference high of the testing laboratory.
Materials
The VA CDW
We conducted a longitudinal, retrospective study of patients receiving care within the Veterans Health Administration (VHA) medical system. The VHA offers comprehensive medical care, including prescription coverage, for US Veterans. Data from the VHA EHR, including lab values and prescription refill records, enters the VA Corporate Data Warehouse after being collected from each VHA site into the Regional Data Warehouses. Care providers at each VHA site have to access data from other sites through a laborious and non-intuitive interface that stands separately from the primary EHR at the site of record. Providers therefore do not frequently use the system to access other sites’ data. In contrast, the Corporate Data Warehouse links patient records from all sites together under a single patient identification number, allowing a comprehensive view of patient data. Many records of patient medications prescribed from outside the VHA are also present in the Corporate Data Warehouse through manual provider entry into the record, which supports estimation of which patients may be
In addition to maintaining patient data in the established VHA format, the Corporate Data Warehouse also supports a version of the Observational Medical Outcomes Partnership (OMOP) Common Data Model[66]. The Common Data Model links patient data to standardized concepts to permit sharing of research workflows across sites within the Observational Health Data Sciences and Informatics (OHDSI) network[67]. Table-valued functions associated with the Common Data Model allow natural-language searches of OMOP concepts and their synonyms to develop code lists for patient diagnoses.
Refill and lab records in the CDW
Each row of prescription refill data in the CDW comprises a rich set of data. Refills are attached to their site of issuance by a site-specific identifier and linked to patients with a
patient identifier unique to both that patient and site. Medication-specific data in a refill record include the site-specific name, the generic name, dose, route, and form (tablet, liquid,
etcetera). Pharmacy data include fill, dispense, and release dates for the specific refill, as well as quantity numeric and days supply of medication issued, and frequency of use. An additional flag indicates whether the refill will be mailed to the patient (“mail”) or picked up in-person at a pharmacy (“window”). Pharmacist notes are included as free text and may contain information on the patient’s specific needs for refilling or picking up the medication.
Patient lab result data within the VHA contain numeric results for lab draws, an additional non-numeric result field that may contain notes about why a lab was not drawn or resulted, reference range low and high values, dates for when the specimen was drawn and resulted, units, and a flag for whether the specimen was abnormal (high or low). We used the date a TSH serum specimen was drawn as the lab date for our analyses. We made our own
determination of whether the specimen was abnormal by direct comparison to the noted lab reference highs, except in cases where specimens were undetectable and did not have a numeric TSH value available.
The VINCI workspace
All analysis was performed using R Studio v1.2.5019 on a virtual machine with a 16-core Intel Xeon processor running at 2.3 GHz using 93 GB of RAM, under Windows Server 2012 Standard. This system was furnished by the VHA Informatics and Computing Infrastructure (VINCI).
Methods
Preliminary feasibility study
More than 80% of pharmacy refills from the VHA are obtained through the Consolidated Mail Outpatient Pharmacy (CMOP)[68]. Refill prescriptions (not to be confused with renewal prescriptions, which require a new prescription) in the pharmacy may be mailed automatically to the patient at the time they would be available to refill; patients only need to interact with the VHA system after their refills have expired to obtain a prescription renewal. The duration of prescriptions is left to the discretion of the clinician; a common prescribing pattern for chronic medications with stable dosing is 90 days with three automatic refills. We were therefore concerned that most patients under study would appear to have perfect adherence, and that there would be too few low-adherence patients to establish a relationship across the whole range of continuous adherence.
We undertook a feasibility study to understand the spread of refill adherence values for patients on levothyroxine for at least two years. Patients within our initial study received over 90% of their refills from the CMOP and typically had high median adherence values. This comports with findings that patients utilizing mail-order pharmacies have higher adherence than patients refilling their medications in person[69]. However, at least 88% of patients demonstrated some level of nonadherence, making our study feasible. We also attempted to determine whether most refill nonadherence occurred around renewal periods by looking for regular patterns of lower adherence occurring within four refill periods of a patient’s index fill, but did not find any patterns suggesting a trend toward nonadherence on a given time frame.
Record selection
Using the VHA Corporate Data Warehouse, we identified records from 240,277 patients who ever refilled a medication containing levothyroxine at one of thirty pre-selected VHA sites.
Our site selection criteria were not wholly random; we initially selected a subset of five sites based on geographic location and site size in order to validate our methods, then selected an additional twenty-five sites at random to increase our sample size. While patient records were selected using refill events from the chosen thirty VHA sites, the identified records included data from most of the sites within the VHA system.
We excluded records with refills for non-tablet or non-caplet forms of levothyroxine or any medication containing liothyronine, to ensure all patients under study were using
medications with similar absorption profiles and pharmacological activity. We additionally excluded records from patients who did not have labs drawn during the time they were
receiving levothyroxine. Our inclusion criteria were deliberately broad to permit exploration of
the adherence-treatment success relationship regardless of indication for levothyroxine treatment.
For all identified records, we collected refill data for levothyroxine, usage intervals of thyroid medications obtained outside the VHA pharmacy as recorded in the outside
medications table in the CDW, and all serum TSH lab values. In the VHA pharmacy,
levothyroxine is prescribed as Synthroid[70] with very few exceptions; oral doses are available in the following increments: 25 mcg, 50 mcg, 75 mcg, 88 mcg, 100 mcg, 112 mcg, 137 mcg, 150 mcg, 175 mcg, 200 mcg, and 300 mcg. For treatment of hypothyroidism, initial prescribed dosing of levothyroxine is weight based and thereafter modified according to TSH response[71].
We additionally collected refill data on thyrotropin alfa (Thyrogen), as this is a synthetic version of TSH used in the diagnosis and treatment of thyroid cancer. Serum TSH values are expected to spike after thyrotropin alfa administration.
To identify and exclude patients with potential disorders of TSH secretion, we created a code list by searching the OMOP ICD9/ICD10/SNOMED concept crosswalk for the following terms: “hypopituitarism,” “panhypopituitarism,” “central hypothyroidism,” “secondary
hypothyroidism,” “tertiary hypothyroidism,” and “pituitary hypothyroidism”. Patients with two or more concept identifiers matching the code list were identified as having a disorder of TSH secretion, starting on the date the first concept identifier was recorded in the patient’s record;
patients with less than two identifiers were retained in the main analysis. We set aside records from the identified patients as a negative control (discussed in Chapter 3), as they would have low serum TSH values regardless of levothyroxine ingestion. Because the only codes we found
for patients within this group corresponded to hypopituitarism in some form, we hereafter refer to these patients as having hypopituitarism.
We additionally excluded patients receiving thyrotropin alfa (Thyrogen) from the main analysis, retaining their records for a later analysis of patients with thyroid cancer.
Patients remaining after the removal of these two patient groups were presumed to be receiving levothyroxine for suspected or confirmed hypothyroidism, and we refer to them as such hereafter.
Data cleaning
To unify thyroid medication refill data for all patients across all sites, we standardized medication names and doses in micrograms, and excluded duplicate refills, refills missing any date information, and refills dated before 10/1/1999, the date when the CDW came online. We considered any refill for more than 90 days supply as a data error, and excluded the
corresponding patient records; 1,832 patient records were removed for this reason. Some records with legitimate but unusual prescriptions (such as prescriptions for 91 or 95 days) may have been excluded with this method, but the majority of refills qualifying for this exclusion criterion had unusually large days supply, such as 150 or 600. We similarly removed duplicate lab draws and lab draws without any associated dates from the patient lab data.
Adherence calculation
We chose to model adherence as a trajectory of PDC values calculated between each pair of consecutive levothyroxine refills in a patient record. This allowed us to capture patient behavior with higher resolution and specificity than measures calculated over a patient-year.
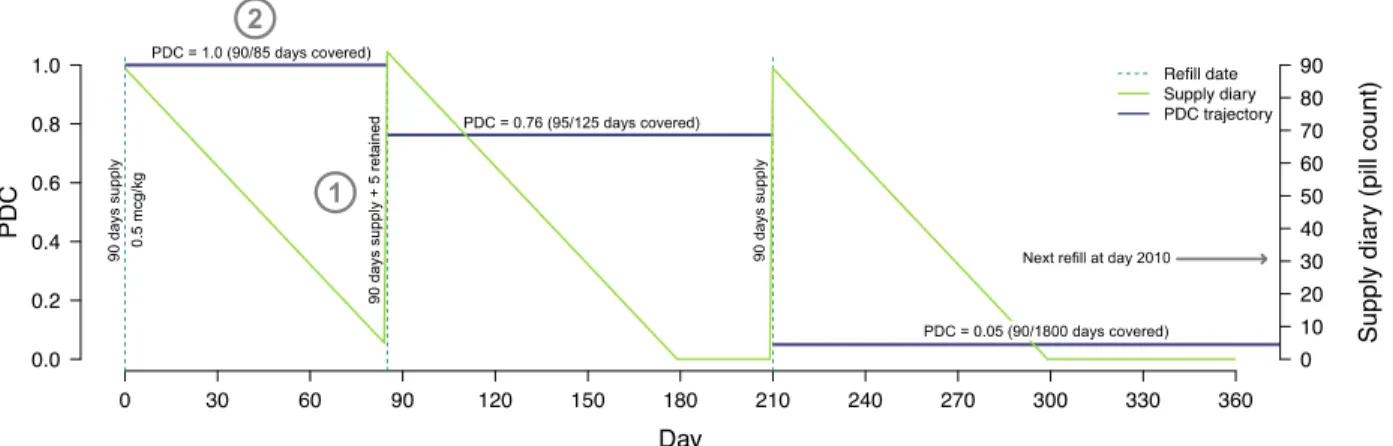
Figure 2 illustrates our method for deriving patient trajectories from patient refill data. We first constructed detailed supply diaries for each dose of medication each patient received.
Beginning with the days supply issued at the index fill, we subtracted one dose for every day a patient was under observation and added back the days supply received on refill dates
Figure 2: Calculating a PDC trajectory from a supply diary. The supply diary (green line) is calculated by subtracting one dose a day each day a patient is under observation, starting with the days supply issued on the index fill and adding medication received on each subsequent refill date. The PDC trajectory (purple line) is derived from the supply diary using Algorithm 1. At (1), supply remaining on a refill date is added to the supply of medication obtained in that refill. At (2), PDC is capped at 1 despite the patient having more supply of medication than days in the between-refill period.
(Algorithm 1, supply diary calculation). This could result in oversupply when patients refilled medications early, as seen at (1) in Figure 2.
Using the resulting supply diaries, we then calculated PDC trajectories for each
levothyroxine dose with Algorithm 1. We subsequently unified all trajectories for a patient into a single adherence history by selecting the maximum trajectory value and associated dose for each day covered by any of a patient’s trajectories. On days with ties for maximum PDC, we summed the doses for all tied trajectories. On dates where a patient’s listed dose of
levothyroxine differed from the previous day’s, we noted a dose change. We additionally noted dose changes on dates where a patient refilled a different dose of levothyroxine than the previous refill. Figure 3B shows the use of maximum PDC for a period with two overlapping trajectories (3) and notation of a dose change (4).
Trajectory algorithm:
Let T be the set of dispense dates for a given medication. Let t0 be the first (or index) dispense date and tn be the final dispense date. Let sj be the supply of medication available on date j and dj be the days supply dispensed on tj.For days where medication is not refilled, dj = 0.
Supply diary calculation
Step 1: Create an empty supply diary containing (tn-t0)+1 days.
Step 2: Set s0 = d0 – 1.
Step 3: For each day j in the supply diary, set sj = sj-1 + di – 1.
Trajectory calculation
Step 1: Create an empty trajectory containing (tn-t0)+1 days.
Step 2: For each ti∈ T, divide si by (ti+1 – ti) days. This is the medication possession ratio (MPR) for the interval between refills ti and ti+1.
Step 3: Assign min(calculated MPR, 1) to each day of the trajectory ∈ [ti, ti+1). This is the PDC for that interval.
Step 4: If ti = tn-1, assign calculated PDC to each day of the trajectory ∈ [tn-1,tn] to complete the trajectory.
Step 5: Return the trajectory.
Algorithm 1: Calculation of PDC trajectories based on refill record data. Note that no value is calculated for days after the last refill date (Trajectory calculation, Step 4), making no assumptions on patient behavior following the final refill seen.
Determination of medication adherence preceding TSH lab values
The unit of analysis for this study was individual serum TSH lab draws that occurred after the assessment of medication refill adherence. We classed a lab draw as a treatment success if it fell below the reference high of the analyzing laboratory, indicating biochemical Figure 3: Method of calculating levothyroxine refill adherence preceding lab draws. In this illustration for a single patient, each lab draw was associated with mean adherence to the dose of levothyroxine refilled in the period 90 days prior (1). Individual lab draws were classed as successes if TSH was below the reference high for the analyzing laboratory (1,2). When patients had multiple medication trajectories active, the PDC of the highest was used for calculating PDC preceding the lab draw (3). Dose changes were noted in the record when patients picked up new doses of levothyroxine (4). Draws without 90 days of history and draws occurring less than 90 days after a dose change were removed from the analysis (2,5).
success in treating hypothyroidism. Figure 3 illustrates our methods for calculating refill adherence preceding TSH serum lab draws and identifying treatment success.
TSH serum concentrations typically take several weeks to normalize after initiation of or change in levothyroxine therapy[56,72], so we selected a 90-day window preceding a serum TSH lab draw in which to measure adherence. To relate serum TSH levels to adherence, we calculated the mean PDC and associated dose(s) for each 90-day segment of a patient’s refill adherence trajectory preceding a lab draw, as seen in Figure 3A. We subsequently discarded lab draws with less than 90 days of preceding adherence information.
Because initial levothyroxine dose is typically prescribed based on body weight, we converted dose in micrograms to mcg/kg by dividing levothyroxine dose dispensed by a patient’s median weight over the entire period of observation. Using a single median weight was a choice of computational ease that also meant we did not make use of extreme (and possibly erroneous) weights for patients.
To avoid conflating changes in TSH levels that resulted from changes in levothyroxine dosing with those from changes in adherence, we removed lab draws occurring within 90 days of evidence of a dose change ((5) in Figure 3B). This decision was again based on the time required for patient TSH levels to stabilize after a change in levothyroxine therapy[56,72]. We plotted the distribution of times between all lab draws and the most recent prior refill to examine whether there was evidence of significant bias from analysis periods crossing refill boundaries (as shown in Figure 3A (1)).
To understand the potential influence of thyroid medications received from outside the VHA—for which we did not have detailed refill information and could not calculate PDCs—we
also examined patient records with reported outside thyroid medications and identified lab draws occurring during periods of outside medication use.
Analysis of the medication refill adherence-treatment success relationship
We grouped all serum TSH values with a full 90 days of preceding medication refill adherence data into bins by 0.05 intervals of PDC. We calculated the fraction of patients with successful treatment of their hypothyroidism (treatment success) in each bin as well as 95%
confidence intervals for three subsets of the data: 1) all TSH values, 2) TSH values not occurring during a period of non-VHA thyroid medication usage, and 3) TSH values only from patients who never reported non-VHA thyroid medications. We fit a linear regression to data in the third subset.
To understand how refill adherence influences continuous serum TSH responses, we derived empirical cumulative distribution functions (eCDFs) for each bin, with and without TSH values for patients reporting non-VHA thyroid medications. This allowed us to directly compare distributions within each adherence bin for changes in shape and location, rather than relying only on a binary representation of patient TSH responses.
Because patient use of non-VHA thyroid medication significantly influenced the shape of the relationship between medication refill adherence and successful treatment of
hypothyroidism, we conducted our final analysis of the data from patients for whom there was no report of receiving any non-VHA thyroid medication.
Results
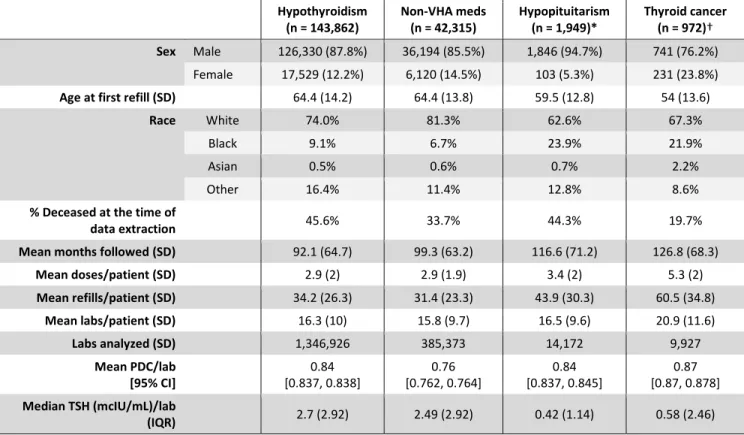
Table 1: Statistics for patient subgroups.
Patient cohort
Using the CDW, we identified 240,277 patients who had ever refilled levothyroxine from the selected 30 VHA sites. Of these, 3 took a medication containing liothyronine, 59 took a non- tablet or non-caplet form of levothyroxine, and 1,832 had a medication refill with an erroneous days supply (defined as days supply ≥90 days). We identified and set aside all 1,949 patients with hypopituitarism as a negative control. A further 978 patients received thyrogen alfa (Thyrogen) injections and were identified for a later sub-analysis of thyroid cancer patients; of these, six patients also met the criteria for hypopituitarism and were treated as negative controls.
Hypothyroidism
(n = 143,862) Non-VHA meds
(n = 42,315) Hypopituitarism
(n = 1,949)* Thyroid cancer (n = 972)†
Sex Male 126,330 (87.8%) 36,194 (85.5%) 1,846 (94.7%) 741 (76.2%)
Female 17,529 (12.2%) 6,120 (14.5%) 103 (5.3%) 231 (23.8%)
Age at first refill (SD) 64.4 (14.2) 64.4 (13.8) 59.5 (12.8) 54 (13.6)
Race White 74.0% 81.3% 62.6% 67.3%
Black 9.1% 6.7% 23.9% 21.9%
Asian 0.5% 0.6% 0.7% 2.2%
Other 16.4% 11.4% 12.8% 8.6%
% Deceased at the time of
data extraction 45.6% 33.7% 44.3% 19.7%
Mean months followed (SD) 92.1 (64.7) 99.3 (63.2) 116.6 (71.2) 126.8 (68.3)
Mean doses/patient (SD) 2.9 (2) 2.9 (1.9) 3.4 (2) 5.3 (2)
Mean refills/patient (SD) 34.2 (26.3) 31.4 (23.3) 43.9 (30.3) 60.5 (34.8)
Mean labs/patient (SD) 16.3 (10) 15.8 (9.7) 16.5 (9.6) 20.9 (11.6)
Labs analyzed (SD) 1,346,926 385,373 14,172 9,927
Mean PDC/lab
[95% CI] 0.84
[0.837, 0.838] 0.76
[0.762, 0.764] 0.84
[0.837, 0.845] 0.87 [0.87, 0.878]
Median TSH (mcIU/mL)/lab
(IQR) 2.7 (2.92) 2.49 (2.92) 0.42 (1.14) 0.58 (2.46)
* Labs from 1,210 records analyzed.
† Labs from 697 records analyzed.
A combined 20,293 patients did not have any serum TSH drawn during the interval they were receiving levothyroxine refills from the VHA; 5,479 of these had never had serum TSH labs drawn within the VA. An additional 29,814 patients did not have any lab draws with ≥90 days of medication history preceding them.
42,315 of the patients with analyzable data received thyroid medication from a pharmacy outside the VHA; 54,125 of the original 240,277 had reported an outside thyroid medication.
Figure 4 and Table 1 summarize demographic data on the patients remaining in the cohort, as well as those excluded for outside medications, hypopituitarism, and thyroid cancer.
Significant differences exist between all subgroups identified for the study. The highest Figure 4: Inclusion-exclusion flowchart for patient records entered in the study. LT4 = levothyroxine;
LT3 = liothyronine.
patients with hypopituitarism. A higher proportion of patients with hypothyroidism and thyroid cancer were female, corresponding to a higher prevalence of these diseases among women;
the percentage of female patients in these groups is higher than the overall percentage of female Veterans seen at the VHA[73]. In general, longer times for follow-up corresponded to greater number of lab draws and more refill events for a group, with thyroid cancer patients being the youngest and having the longest follow-up times.
Thyroid cancer patients received the highest number of different thyroid medication doses. TSH values from these patients had the highest mean PDC preceding the lab draws, as well. Patients with thyroid cancer and hypopituitarism had significantly lower median TSH values than patients with hypothyroidism. The lowest PDC preceding lab draws was seen among hypothyroidism patients with evidence of non-VHA thyroid medications. While patients with hypopituitarism differ demographically from patients with hypothyroidism, they had similar 90-day mean PDC values, justifying their use as a negative control.
Patient data were collected from October 1999 to December 31, 2019.
Determining the relationship between refill adherence and treatment success
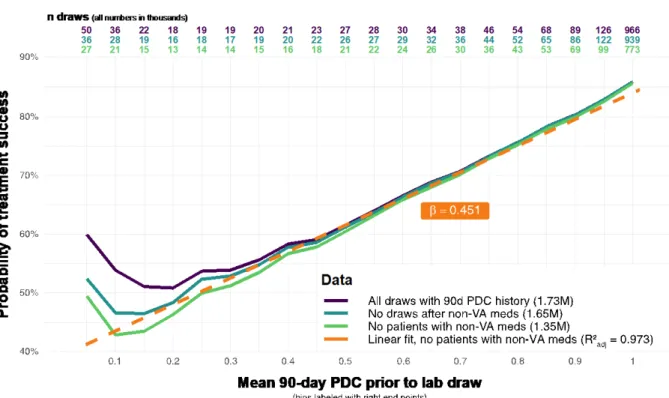
Among patients without evidence of non-VHA thyroid medication prescriptions, refill adherence and probability of treatment success had a largely linear relationship across the range of PDC (R2 = 0.97, β = 0.45, 95% CI: [0.41,0.49]; intercept: 0.4 [0.38,0.42], Figure 5) with the exception of the lowest PDC bin. Including patients with non-VHA thyroid medication prescriptions increased the deviation from linearity beginning at a PDC of [0.25,0.3), with more severe deviation when draws from periods of known non-VHA medication prescriptions were included. For draws from patients without non-VHA medication prescriptions, highest
Figure 5: The refill adherence-treatment success relationship is largely linear. A notable deviation in linearity at the lowest adherence levels is reduced by progressively removing lab draws from patients reporting non-VHA thyroid medications. Perfect adherence is not associated with perfect treatment success. The majority of lab draws fell in the two highest adherence bins.
treatment success achieved was 0.856 [0.855, 0.857] at nearly perfect adherence ((0.95,1]), while the lowest achieved is 0.427 [0.421, 0.434] for a PDC between 0.1 and 0.15.
Most TSH serum lab draws occurred within 120 days following a thyroid medication refill. The distribution of time between medication refill and lab draw for patients with TSH values above the high threshold (those whose hypothyroidism was not successfully treated) was flatter than that for their counterparts whose hypothyroidism was successfully treated, with more weight in the right tail of the distribution.
Figure 6: Most lab draws happen within 120 days of a medication refill. 90% of TSH values below the lab reference high (successes) were drawn within 105 days of a levothyroxine refill, while 90% of TSH values above the lab reference high (failures) were drawn within 175 days. A higher percentage of failures are drawn ≥90 days after the last levothyroxine refill, compared to the distribution of treatment successes. Patients who do not stockpile their levothyroxine would be out of medication—and therefore have a PDC less than 1—90 days after a refill.
Examining the continuous refill adherence-TSH relationship
The CDFs for serum TSH lab values largely follow a regular progression from lowest to highest PDC, with higher PDCs inducing a leftward shift in the distribution. An exception is seen for a PDC between 0 and 0.05, which is further to the left than several subsequent PDC bins.
This corresponds to low TSH values being more commonly drawn for patients with very low or no adherence compared to those with adherence levels in [0.05, 0.25]. This effect is more severe when all TSH lab results are included regardless of whether patients received non-VHA prescriptions for thyroid medication. Similarly, the distance between the distributions is reduced when TSH values from these same patients are included.
Figure 7: Distributions of serum TSH values differ at differing levels of refill adherence. Colored lines represent quintiles of adherence from [0,0.05] to (0.95,1]. TSH values from patients receiving
levothyroxine outside the VHA system push low-PDC distributions to the left, with little effect on high- PDC distributions, suggesting that low “adherence” in these patients is due to them receiving
levothyroxine from a non-VHA source. Spacing between distributions in B is largely regular.
At a PDC of (0.95,1], 78.5% of serum TSH values fall below 4.0 mcIU/mL (dotted line), the upper end of the range for normal thyroid function[56]. At a PDC of [0,0.05], 41.3% of serum TSH values fall below 4.0 mcUI/mL. The cross-section of the distributions taken at this TSH value is equivalent to repeating our analysis with a fixed success threshold of 4.0 mcUI/mL for all draws.
There is no obvious discontinuity or abrupt change in the shape of distribution at any level of PDC, though the distributions in low bins exhibit more irregularity due to data sparsity.
Discussion
We compared levothyroxine refill adherence with successful treatment of
hypothyroidism as measured by TSH values, and found a smooth linear relationship with no natural breakpoint or threshold. Any improvement in refill adherence appears to lead to incremental improvements in the probability of treatment success for hypothyroidism, with every 5% increase in adherence leading to a 2% increase in the probability of treatment
success. On this basis, we find little justification for treating a levothyroxine PDC of, e.g., 0.75 as nonadherent compared to a PDC of 0.8 when assessing the subsequent TSH value. This study directly supports using medication refill adherence as a continuous variable in outcomes-based medication adherence research to avoid bias and data loss arising from dichotomization. From a clinical perspective in the case of treating hypothyroidism, care providers can focus on increasing patient medication adherence without concern for arbitrary adherence thresholds, as any gain in adherence improves TSH levels. We caution, however, that this may not
correspond with an improvement in symptoms of hypothyroidism; more work remains to be done on the relationship between TSH levels and overt symptoms of hypothyroidism.
Our findings align with those of Egede et. al.[48], who in 2014 found a linear relationship between 90-day refill adherence (measured in MPR) to antidiabetic medications and
subsequent mean glycosylated hemoglobin A1C values, which reflect blood glucose levels over the prior three months. They additionally found that each 1% increase in MPR reduced the odds of poor glycemic control—defined as an A1C >8%–by 48% (OR: 0.52). Our findings show a much more modest effect size, with an OR of 1.02 for a 1% increase in PDC. This is not surprising, as we chose to examine the unadjusted relationship between refill adherence and treatment success at a population level. This puts our work more in line with how adherence cut offs are applied in the literature to entire cohorts of patients, without adjustment for patient-level factors such as race or sex.
We found further support for treating medication refill adherence as a continuous variable when we analyzed the relationship between refill adherence and the distribution of continuous serum TSH values. As patient refill adherence increases, the entire distribution of serum TSH values shifts to the left by a modest amount, though neighboring adherence bins (such as 0.75 and 0.8) still have similar distributions. Insofar as a patient’s serum TSH levels affect—or are a proxy for—the probability of long-term adverse outcomes, this suggests large changes in medication refill adherence are required to produce detectable changes in adverse outcomes for patients being treated for hypothyroidism.
Medication adherence intervention studies using dichotomous measures of adherence
required to alter outcomes. Patients who switch to “adherent” from “nonadherent” during the course of a study may have only increased their adherence by the small amount needed to cross a predesignated threshold without much change to their underlying biochemical
response. This may be an additional factor in the noted[17,34,46] phenomenon of medication adherence interventions successfully changing adherence patterns but not long-term clinical outcomes such as hospitalizations or mortality among treated patients. To avoid this problem, researchers might first determine the relationship between continuous adherence measures and the outcome of interest, then use the desired change in outcomes to pre-specify how much the intervention must change adherence to be “successful”.
Our analysis also provides insight into the well-known biases and oversights that occur when refill adherence is used as an overall adherence measure. Some of these biases result from a lack of information on patient medication-taking behavior after filling a prescription, while others are due to an incomplete picture of patient health circumstances that might affect medication efficacy after ingestion.
The effects of these knowledge gaps are best visualized on the left and right sides of Figure 5, though they can be presumed to affect the shape of the entire relationship. On the left side of the graph, the presence of patients with undisclosed medications, or who do not need levothyroxine, contribute to a residual 48% treatment success despite a total lack of adherence. On the right side of the graph, patients who do not take their medications as prescribed, or who are receiving an insufficient dose of levothyroxine, collectively have a treatment failure rate of about 14%. Patients suffering from levothyroxine malabsorption due, for example, to a history of gastric bypass surgery or taking their levothyroxine with interacting
medications reduce the apparent treatment success at all levels of PDC. Patients with disorders of TSH secretion raise the height of the overall curve (we discuss this in in chapter 3).
At low values of adherence—seen to the left side of the refill adherence-treatment success curve—the linear relationship between adherence and treatment success reaches a minimum probability of success that appears to hold regardless of adherence behavior. This
“treatment success” floor is reduced by removing patients with evidence of non-VHA prescriptions for thyroid medications. It is possible that some of the remaining nonlinearity (seen in for levels of adherence in [0,0.05]) is due to undisclosed medications that were not recorded in the VHA system. The significant difference in average 90-day PDC between patients with and without non-VHA medications suggests the considerable effect another source of medication can have on patients’ apparent adherence, and a consequent weakening of the relationship between apparent adherence and outcomes.
Researchers using pharmacy refill data should carefully consider how undisclosed sources of medication may affect their conclusions. Previous medication adherence studies using VHA data have generally assumed patients do not receive medications from outside the VHA[33,39,40,48]; while this assumption may be appropriate for expensive medications such as highly active antiretroviral therapy (HAART) regimens for HIV[40], more than a fifth of patients identified for this study had a non-VHA thyroid medication listed in their record. For medication adherence studies conducted with VHA data, we therefore suggest the exclusion—or at least very careful analysis—of patient records noting non-VHA medication prescriptions for the same indication as the medication under study.
Some “treatment success” at low levels of adherence may also be due to TSH values from patients who still had medication on-hand from a refill within the past 90 days. Figure 6 shows that most TSH values are obtained within 120 days of a thyroid medication refill, suggesting that even patients with low adherence are often tested during time periods when they should still have thyroid medication on-hand. Notably, however, a greater density of draws showing treatment failure happen after 90 days, compared to the density of treatment
successes. Further, the significant relationship between low adherence and low treatment success remains, and TSH values obtained during periods of low adherence have a higher median TSH value than draws during periods of high adherence (Figure 7). This suggests that patients may have already ceased taking medications before a gap in refill behavior becomes noticeable, and patients are more likely to have TSH values outside the reference high the longer they are from their last levothyroxine refill. Assumptions that patients finish all
medication received in a final refill, as is sometimes done in calculating MPR and PDC, may not be justified[8], possibly because patients with evidence of nonadherence to thyroid medication refills may also exhibit other components of medication nonadherence such as not ingesting medications at the prescribed dose and/or frequency.
An additional explanation for the unexpectedly low TSH values at low adherence is the possible inclusion of euthyroid patients in the data set. Jonklaas and DeSale found that many new levothyroxine prescriptions initiated in the MedStar medical system[74] were issued to patients who did not have a diagnosis of hypothyroidism, and, indeed, were also biochemically euthyroid, albeit with TSH values in the high-normal range. We have no reason to suppose that this trend toward overtreatment—noted by several other authors[75–77]—does not exist in
the VHA. Therefore, our cohort almost surely contains euthyroid patients. These patients would contribute to “treatment success” at all levels of adherence, regardless of medication-taking behavior, though it would be most obvious at low adherence.
Even when patients are perfectly adherent to their levothyroxine refills—and truly hypothyroid—we found a 14% chance of treatment failure. Some of this may be due to patients not taking their prescribed thyroid medication despite having it available. This may include a subset of patients who were erroneously calculated to have a higher-than-actual PDC, because our methods allowed stockpiling of medication (Algorithm 1, Figure 2) when patients refilled their medications early. However, our methods cannot account for patients refilling early because they have, for example, lost their entire supply of medication, leading to potentially inaccurate supply diaries and therefore PDC estimates.
These are well-known limitations in records-based adherence studies[17]. While their effects are difficult to quantify outside of studies that specifically compare refill adherence to gold-standard direct measurements of adherence[20], our findings provide a rough bound on how often patients are refill their medications but do not ingest them. Understanding how much of the 14% gap is due to levothyroxine malabsorption and under-treatment would further refine this estimate of patients who are not taking their medications while faithfully refilling them.
3. Clinical factors influencing the adherence effect on serum
Overview TSH
Having established the overall linear shape of the relationship between refill adherence and treatment success on levothyroxine, and discovered unexpected behavior at either end of that relationship, we turn to an investigation of the clinical factors influencing the shape of the relationship. We previously established that medications received from outside the VHA
substantially alter the shape of the relationship between (apparent) refill adherence and serum TSH levels. To understand how treatment indication and medication dose prescribed affect the refill adherence-treatment success relationship, we conducted further analyses on data
subdivided by patient indication and levothyroxine dose received.
Methods
We used the methods detailed in Chapter 2 to construct trajectories of medication refill adherence and calculate 90-day mean PDC and weight-based levothyroxine dose for lab draws from all patients under study, regardless of indication. We then set aside data for patients with hypopituitarism to compare as a negative control group. We additionally set aside patients with thyroid cancer to explore the effect of disease severity on adherence.
Subgroup definition
Patient records were defined as belonging to a patient with hypopituitarism based on the criteria outlined in chapter 2: Having at least two codes corresponding to a disorder of TSH secretion. Only TSH values after the date the disorder was first diagnosed were included for
analysis. Patients with <2 codes for hypopituitarism were retained in the main analysis because they were presumed to be an entry error (clinicians perform their own manual coding for clinical encounters in VHA).
Patient records were classed as belonging to a patient with thyroid cancer if the patient had received at least one thyrotropin alfa (Thyrogen) injection. Only TSH values post-dating the date of the patient’s first Thyrogen injection were included for analysis. Six records meeting the criteria for both thyroid cancer and hypopituitarism were analyzed as part of the
hypopituitarism subset.
Data cleaning
For thyroid cancer patients who received Thyrogen, we removed TSH values drawn within 14 days of a Thyrogen injection. Thyrogen is a recombinant form of TSH administered to raise TSH levels[78] for testing and treatment of thyroid cancer, so high serum TSH values are expected within two weeks after its administration.
Effect of indication for treatment on the refill adherence-treatment success relationship We repeated the binning analysis described in chapter 2 for the hypopituitarism and thyroid cancer groups. We then plotted them together on the same axes, omitting data from records with known non-VHA thyroid medication prescriptions. We additionally fit a simple linear model to both sets of data, and derived eCDFs for each indication.
Effect of dose on the refill adherence-treatment success relationship
Clinically, levothyroxine doses are generally calculated based on patient weight and titrated up or down based on serum TSH response[56]. For our purposes, we divided all doses of levothyroxine for a patient by that patient’s median weight in kilograms over the entire time of observation. We classed TSH values into one of five weight-based dose bins spanning the range from below usual therapeutic doses (<0.5 mcg/kg)[74] to very high (>1.7 mcg/kg) and plotted the resultant refill adherence-treatment success curves together.
We also grouped and analyzed the distribution of medication dose levels by each PDC bin for all three indications, to examine whether these differed by refill adherence or indication.
Results
Effect of indication on the refill adherence-treatment success relationship
Of the 1,949 patient records we classed as belonging to patients with hypopituitarism, we analyzed TSH values from 1,210. For these patients, 14,172 TSH lab draws occurred after diagnosis with a disorder of TSH secretion. These negative controls demonstrated low serum TSH values regardless of adherence, as expected (Figure 8).
We analyzed an additional 9,927 draws from 697 (of 972 identified) patients who had received treatment for thyroid cancer. While the small number of draws led to considerable uncertainty in lower PDC bins, the adherence-treatment success relationship for these labs Figure 8: Indication for levothyroxine treatment modifies the refill adherence-treatment success relationship. Draws from patients with hypopituitarism show very little relationship between adherence and treatment success. Draws from patients with thyroid cancer may typically have slightly higher treatment success at all adherence levels, but only the suggestion of such an effect occurs here. More draws from patients with thyroid cancer occur during periods of high adherence.
appears to be somewhat higher overall than that for patients with hypothyroidism. Treatment success is significantly higher for TSH values with 90-day PDCs in (0.95,1], with 87.4% [86.5%, 88.2%] of draws showing treatment success.
Table 2: Fit parameters for linear regression on the adherence-treatment success relationship, by indication for levothyroxine treatment.
Subset β (CI) Intercept (CI)
Hypothyroidism 0.45 [0.41, 0.49] 0.40 [0.38, 0.42]
Hypopituitarism 0.10 [0.05, 0.14] 0.90 [0.88, 0.92]
Thyroid cancer 0.34 [0.23, 0.45] 0.49 [0.43, 0.55]
Table 2 shows linear fit parameters for each of the indications. Not unexpectedly, the fit for TSH values from patients with hypopituitarism has the shallowest slope of all three groups.
All three intercepts (mean treatment success for patients who do not refill levothyroxine) differ significantly from each other, with hypothyroidism having the lowest and hypopituitarism the highest.
Figure 9 shows continuous TSH distributions for both patients with hypopituitarism and those with a history of thyroid cancer. Both of these show substantially heavier left tails at all levels of adherence when compared to patients with hypothyroidism. For thyroid cancer patients, between 22-51% of TSH values fall below 2.0 mcIU/mL, depending on 90-day PDC;
patients with hypopituitarism show roughly similar distributions. Further, between 38%-51% of TSH values from thyroid cancer patients fall below the TSH suppression target of 0.5