Coverage of sheet metal properties has been expanded to include new materials and more information on aluminum alloys. The section on sheet metal properties has been expanded to include newer materials and more depth on aluminum alloys.
STRESS
In engineering, however, stress is the intensity of force and strain is a measure of the amount of deformation. Except where tensor notation is required, it is easier to use a single subscript for a normal stress and specify a shear stress byτ.
STRESS TRANSFORMATION
The general equation for transforming stresses from one set of axes (eg, n, m, p) to another set of axes (eg, i, j, k) is.
PRINCIPAL STRESSES
MOHR’S CIRCLE EQUATIONS
Using the Pythagorean theorem on the triangle in Figure 1.6 (σ1−σ the three-dimensional stress state can be represented by three Mohr circles as shown in Figure 1.7. EXAMPLE 1.3: Construct a Mohr circle for the stress state in Example 1.2 and determine the maximum shear stress.
STRAIN
In true strains, the sum of the increments is equal to the total strain, but in engineering strains this is not the case. EXAMPLE 1.6: A block of initial dimensions 0,w0,t0 is deformed to dimensions ,w,t. a) Calculate the volume strain,εv =ln(v/v0) with respect to the three normal strains, ε, εwandεt.
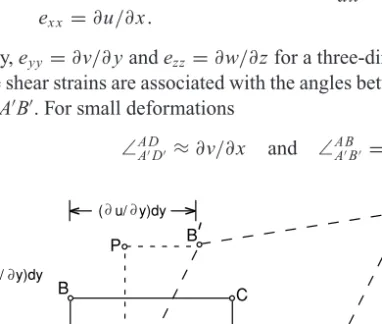
SMALL STRAINS
This definition of shear strain, γ, is equivalent to the simple shear measured in a shear torsion test.
THE STRAIN TENSOR
ISOTROPIC ELASTICITY
For an isotropic material, E, ν and Gar are related to each other by. a) First calculate εx, εy and γx using equations 1.33 and then transform these strains to 1, 2 axes using Mohr's circle equations.
FORCE AND MOMENT BALANCES
BOUNDARY CONDITIONS
Assume that E=205 GPa and ν=0.29 and that the neutral axis does not shift. a) Find the state of stress on most of the outer surface. Assume that the strain is elastic and that E = 205 GPa and ν = 0.29 (note the mixed units). a) Find the three normal strains.
YIELD CRITERIA
In elastic deformation, the body returns to its original shape when the stress is removed, and the stress and strain under elastic loading are related by Hooke's laws. This is equivalent to saying that the yield depends only on the size of the Mohr circles and not on their positions.
TRESCA CRITERION
Mohr's circles for two stress states that differ only by a hydrostatic stress, σm, and are therefore equivalent in terms of yield. If one stress state σ1, σ2, σ3 will cause yielding, another stress state, σ1 =σ1−σm, σ2 =σ2−σm, σ3 =σ3−σm that varies only between σm, will also cause yielding.
VON MISES CRITERION
PLASTIC WORK
In the most general case where there are three normal stresses and three shear stresses, the plastic work is per volume. dw=σxdεx+σydεy+σzdεz+τyzdγyz+τzxdγzx+τx ydγx y. 2.10).
EFFECTIVE STRESS
EFFECTIVE STRAIN
FLOW RULES
After the stamping, it was found that the circle had become an ellipse with larger and smaller diameters of 1,300 and 1,100 cm. If a state of plane stress (σ3 =0) existed during stamping and the ratio α=σ2/σ1 remained constant, what ratioσ1/σ¯ must have existed.
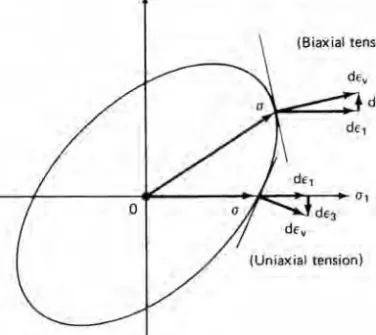
NORMALITY PRINCIPLE
Note that the ratio of dε3/dε1 is given by the normal to the yield surface at the point of yield. b) With the Tresca criterion, a series of stress states cause the same ratio of strains.
DERIVATION OF THE VON MISES EFFECTIVE STRAIN
What internal pressure is required to yield according to (a) the Tresca criterion and (B) the von Mises criterion. What is the maximum internal pressure it can withstand without yielding according to (a) the Tresca criterion and (b) the von Mises criterion.
THE TENSION TEST
This can be found as the intersection of the line parallel to the elastic part of the curve with the stress-strain curve. Since the upper yield strength is very sensitive to the alignment of the tensile specimen, the lower yield strength (YBin Figure 3.2) is defined as the yield strength.
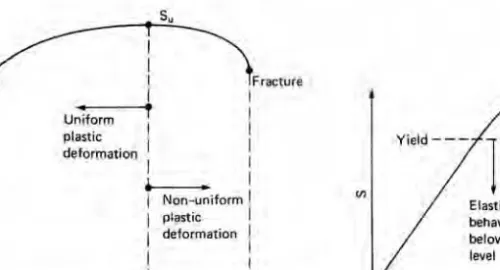
ELASTIC–PLASTIC TRANSITION
Therefore, the yield strength is usually defined as the stress at which the plastic strain is 0.002 or 0.2%.
ENGINEERING VS. TRUE STRESS AND STRAIN
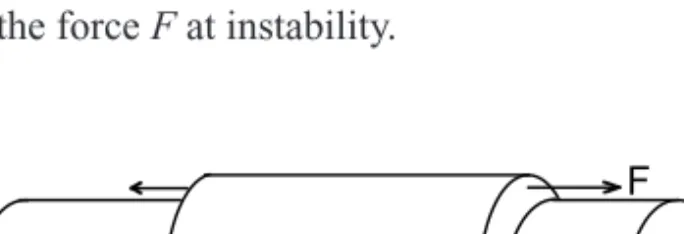
Figure 3.4 shows the technical stress-strain curve lower and the corresponding true stress-strain curve (upper). After constriction, the actual measured areas must be used to find the average stress in the necked area.
A POWER-LAW EXPRESSION
EXAMPLE 3.3: Show that the maximum load in a tension test begins when ε=n. Substituting dε= −dA/A, the maximum load corresponds to dσ/dε=σ. In the tension test for Figure 3.5, the tensile strength was experimentally measured as 28,000 psi.
OTHER STRAIN HARDENING APPROXIMATIONS
BEHAVIOR DURING NECKING
Using the Bridgman correction allows effective stress-effective strain data to be collected at large strains. However, if a neck becomes too sharp, voids can form in the center of the neck region where the hydrostatic stress is greatest and the voids reduce the load-bearing cross-section.
COMPRESSION TESTING
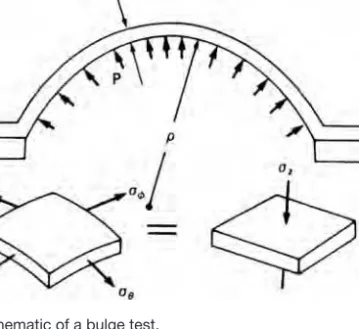
BULGE TESTING
PLANE-STRAIN COMPRESSION
TORSION TESTING
For plane-strain compression (Figure 3.11), .. a) Express the incremental work per volume, dw, in terms of ¯σand dε¯ and compare it with dw=σ1dε1+σ2dε2+σ3dε3. Buckling can occur under compressive load if the ratio of height to diameter is too large.
UNIAXIAL TENSION
Thus, the maximum load, tensile strength, and onset of necking occur at a strain equal to the strain hardening exponent.
EFFECT OF INHOMOGENEITIES
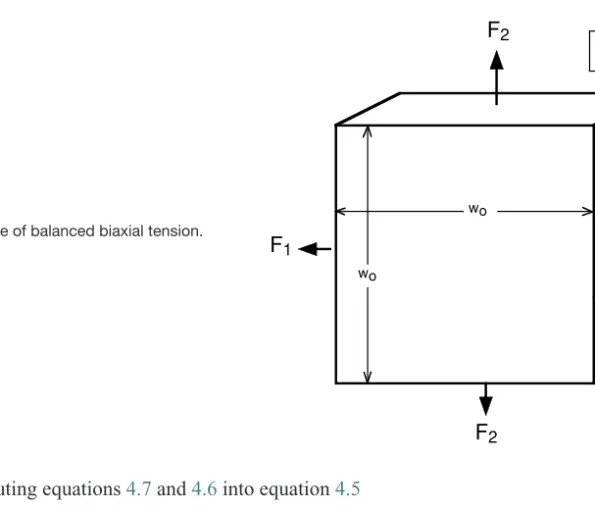
BALANCED BIAXIAL TENSION
PRESSURIZED THIN-WALL SPHERE
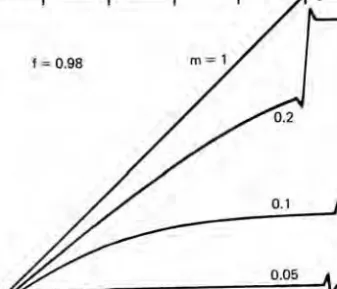
SIGNIFICANCE OF INSTABILITY
Professor Zdzislaw Marciniak is a member of the Polish Academy of Sciences and was the head of the Faculty of Production Engineering at the Warsaw University of Technology. For a material that has a stress-strain relationship of the form ¯σ = A− Bexp(−Cε) where A, B, and Care are constants, find the true stress at the onset of necking and express the tensile strength, Suin expression for the constants .
STRAIN RATE
The influence of the strain rate on the flow stress for different levels of strain rate sensitivity, m, indicated on the curves. The second method has the advantage that multiple strain rate changes can be made on a single sample, while continuous stress-strain curves require a sample for each strain rate.
SUPERPLASTICITY
If the cross-sectional area at the neck isAnd outside the neck isAu,F=σuAu=σnAnorσu/σn=An/Au. Since An < Au, if m is low, the strain rate outside the neck will become extremely low.
EFFECT OF INHOMOGENEITIES
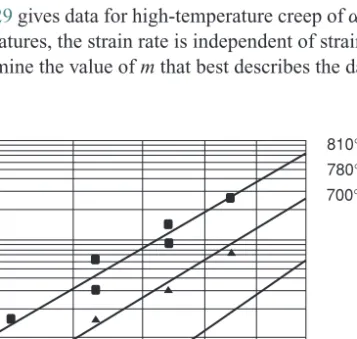
Figure 5.11 shows the dependence of yield stress of the Al-Cu eutectic alloy at 520◦C on strain rate. Whether diffusion is through the lattice or along grain boundary paths, the strain rate must be proportional to the applied stress and inversely related to the grain size.
COMBINED STRAIN AND STRAIN-RATE EFFECTS
ALTERNATIVE DESCRIPTION OF STRAIN-RATE DEPENDENCE For steel and other bcc metals, strain rate sensitivity is better described by
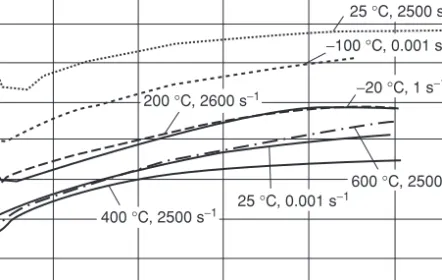
TEMPERATURE DEPENDENCE OF FLOW STRESS
In the temperature range where the flow stress increases with temperature, the stress rate sensitivity is negative. Decreasing the strain rate has the same effect on the flow stress as raising the temperature, as shown schematically in Figure 5.22.
DEFORMATION MECHANISM MAPS
HOT WORKING
However, high temperature lowers the flow stress, regardless of whether recrystallization occurs during deformation or not. In addition to reducing flow stress, the elevated temperature during hot work has several undesirable effects.
TEMPERATURE RISE DURING DEFORMATION
Similarly, localized heating reported for punching holes in armor plate can cause sudden drops in punching force. For a material with n=0.15 and m=0, what will be the strain in the thicker region when the thinner region is twisted?.
IDEAL WORK
This chapter introduces the work or energy balance, which is a very simple method of estimating the forces and energy involved in some metal forming operations. The energy to complete an operation can be divided into the ideal work, wi, which would be required for the change of shape in the absence of friction and inhomogeneous flow, the work against friction, wf, and the excess work, wr.
EXTRUSION AND DRAWING
The actual work, Wa, in drawing a length isWa= Fd, so the work per volume is. EXAMPLE 6.2: Find the tensile stress required to reduce the strip in Example 6.1 from 12.7 to 11.5 mm in diameter by drawing it through a pass assuming an ideal process.
DEFORMATION EFFICIENCY
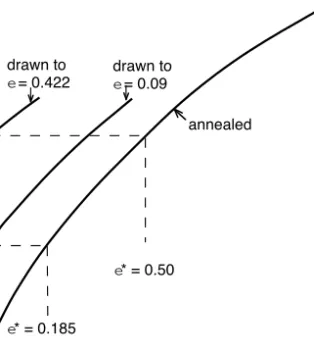
The tensile limit ε∗ corresponds to the intersection of the tensile stress graphs with the stress-strain curve. If it is annealed, the maximum tensile force will correspond to the tensile strength, or
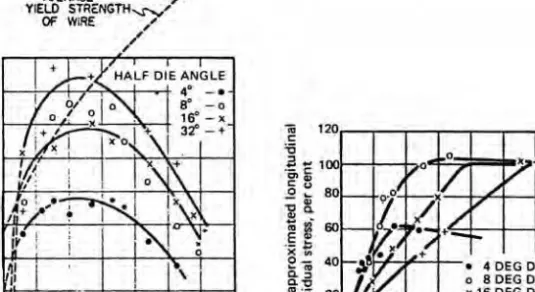
EFFECTS OF DIE ANGLE AND REDUCTION
For all conditions (strain hardening rules and efficiency), the maximum tensile strain corresponds toσd=σ /η¯ as illustrated by Figure6.4. More likely, however, the end of the wire fed through the die will be reduced by swinging (see Section 6.6).
SWAGING
Calculate the maximum possible reduction, r, in the wire drawing for a material whose stress-strain curve is approximated by ¯σ =200¯ε0.18 MPa. For a material with a stress-strain relationship σ = A+Bε, find the maximum stress to pass wire pull, if µ=0.75.
SHEET DRAWING
It is useful to estimate the role of friction on forces required in drawing, extrusion and rolling. The effect of friction does not change the directions of the principal axes or cause internal deformation.
WIRE AND ROD DRAWING
FRICTION IN PLANE-STRAIN COMPRESSION
EXAMPLE 7.2: Plane strain compression is performed on a metal plate 20 cm wide and 2.5 cm high, with a shear yield strength ofk=100 MPa. Assuming a friction coefficient of µ=0.10,. a) Estimate the maximum pressure at the beginning of plastic flow;
STICKING FRICTION
MIXED STICKING–SLIDING CONDITIONS
CONSTANT SHEAR STRESS INTERFACE
AXIALLY SYMMETRIC COMPRESSION
To keep friction across the entire interface, the shear term in Equation 7.25 is 2krdrin instead of 2µPrdr, so 2kdr=–hdPand.
SAND-PILE ANALOGY
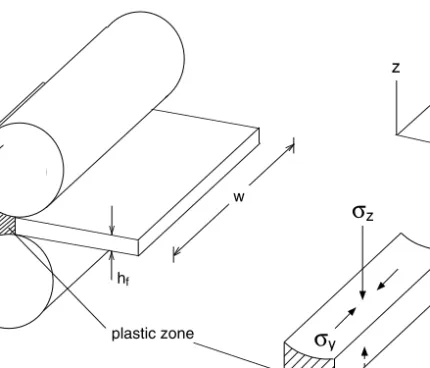
FLAT ROLLING
On the inlet side, the roller surface moves faster than the workpiece, and on the outlet side, the workpiece moves faster. If the curvature of the roll contact area is neglected, one can use equation 7.16 with the front band replaced (h0+hf)/2 replaced to find the mean pressure, thus.
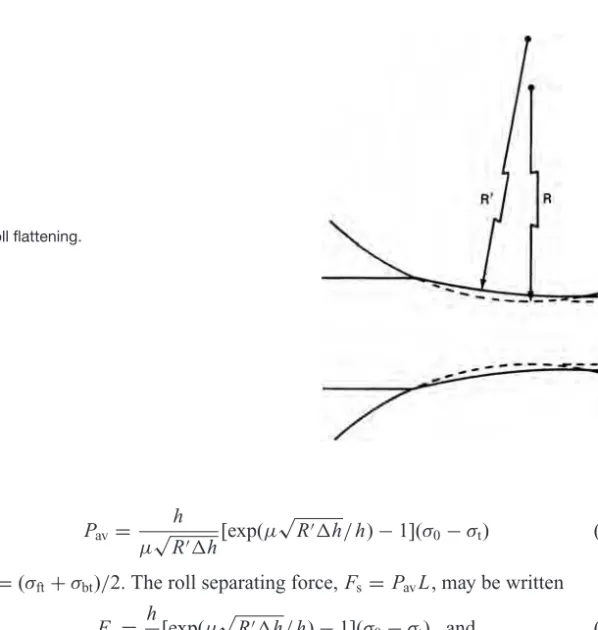
ROLL FLATTENING
The effect of flattening the roll is to increase the separation force of the roll because both PavandLin increase. Methods to achieve thinner sheets and foils include better lubrication (lowerµ), use of back and front tension (σbtandσft), lower σ0 (achieved by annealing) and use of smaller diameter rolls.
ROLL BENDING
COINING
DRY FRICTION
EXPERIMENTAL FINDINGS
The explanation for this is that at the beginning of compression, the lubricant at the edges runs out and the edge of the workpiece comes into contact with the plate and sticks to it. The lubricant is trapped in the central region so that frictional shear forces are lower in the center than at the edge.
RING FRICTION TEST
Assume a coefficient of friction of 0.10 and a yield stress of 125 MPa. a) Calculate the roll pressure if roll flatness is neglected. b) Calculate the roll pressure considering the flatness of the roll. Upper bound analyses, on the other hand, predict stress or forces that are known to be too large.
UPPER BOUNDS
Calculation of accurate forces to cause plastic deformation in metal forming processes is often difficult. Often it is easier to use limit theorems that allow analyzes to be made that result in calculated forces that are known to be either correct or higher or lower than the exact solution.
ENERGY DISSIPATION ON PLANE OF SHEAR
The rate of energy dissipation along the discontinuity is equal to the volume of material crossing the discontinuity per time, SVx times the work per volume. The work per volume is w=kdy/dx=kV12∗/Vx, so the rate of energy dissipation along the discontinuity is.
PLANE-STRAIN FRICTIONLESS EXTRUSION
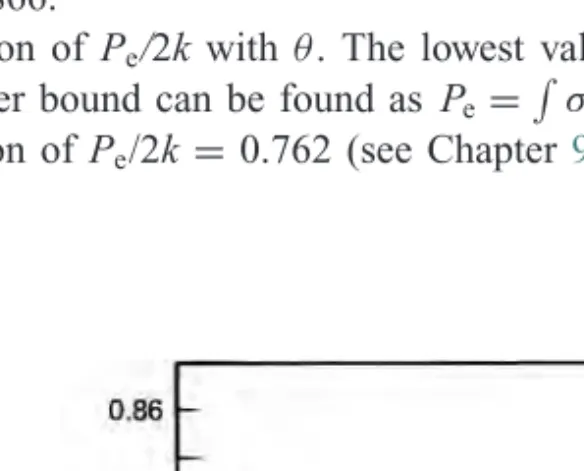
Variation of the calculated extrusion pressure with the angle θ in the upper bounding field of Figure 8.2. If friction along AC is assumed, an additional term, k(V1/V0)(AC/h0), must be added to the upper bound.
PLANE-STRAIN FRICTIONLESS INDENTATION
PLANE-STRAIN COMPRESSION
An upper boundary field for plane deformation, frictionless indentation (a) and the hodograph for the right side of the field (b). Another upper boundary field for plane-strain compression (a) and the corresponding hodograph for the upper right-hand quarter (b).
ANOTHER APPROACH TO UPPER BOUNDS
COMBINED UPPER-BOUND ANALYSIS
AXISYMMETRIC DRAWING
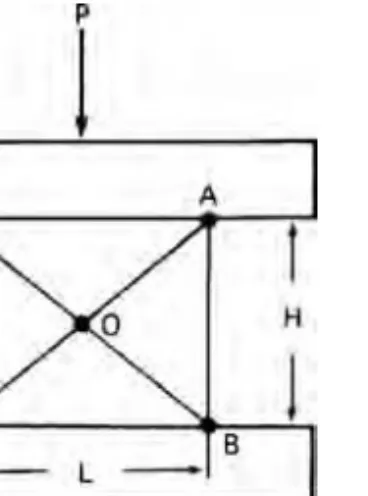
For the plane strain compression shown in Figure 8.16, calculate Pe/2k for L/H values of 1, 2, 3, and 4. Assume sticking friction. 8.16. Upper bound field for plane strain compression for Problem 8.5. For the plane strain compression shown in Figure 8.20, calculate Pe/2k for values of L/h 1, 2, 3, and 4. Assume adhesion friction.
INTRODUCTION
GOVERNING STRESS EQUATIONS
Thus, plane strain deformation can be considered pure shear with a superimposed hydrostatic stress, σ2. The convention is that the largest principal stress (most tensile) lies in the first quadrant formed by lines α and β, as illustrated in Figure 9.4.
BOUNDARY CONDITIONS
Physically this means that movement along the anα line or β-line causes σ2 to change by σ2 =2kφ along the anα line.
PLANE-STRAIN INDENTATION
A detailed view of Figure 9.8 showing the changing state of stress (a) and Mohr's stress circles for triangles OBC (b) and OOA (c). It is a frequently used rule of thumb that with uniform units the hardness is 3 times the yield strength.
HODOGRAPHS FOR SLIP-LINE FIELDS
PLANE-STRAIN EXTRUSION
If the reductions in this section had been done by drawing instead of drawing, the results would have been the same.
ENERGY DISSIPATION IN A SLIP-LINE FIELD
METAL DISTORTION
Its velocity is equal to VDa when it crosses OD, is equal to VE when it crosses OE, and is equal to VFa when it crosses OR. The deformation of the metal is found by considering the velocity quantities at any point along the path.
INDENTATION OF THICK SLABS
- stress depression of a thick plate through two opposite notches. where the plate thicknessH is equal to the indenter widthL. As a result, for valid hardness tests, the thickness of the material must be 4 to 5 times as thick as the diameter of the inden body.
PLANE-STRAIN DRAWING
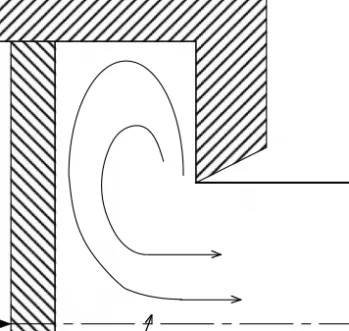
9.22.(a) Sliding line field for the initiation of hump at the entrance with largeα and smaller. b) Slip line field for continued hump. Material accumulates at the die inlet causing the contact length between die and workpiece to be large enough to make the penetration field appropriate.
CONSTANT SHEAR-STRESS INTERFACES
PIPE FORMATION
Figure 9-39 shows the slipline field for a 2:1 reduction by indirect or backward frictionless extrusion. a) Determine P⊥/2k. Consider the slipline field for a constant shear extrusion along the die wall, as shown in Figure 9-50. A).
THE PARAMETER
FRICTION
REDUNDANT DEFORMATION
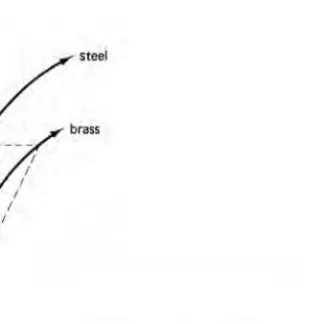
The slip-line solutions for plane-strain indentation (Figure 9.19) can be approximated by. 10.15) There is no corresponding solution for axisymmetric flow. Figure 10.1 from Caddell and Atkins∗ shows the true tensile stress-strain curves for a 303 stainless steel in the annealed condition and after two wire draw reductions.
INHOMOGENEITY
Hardness variations after much larger reductions were studied in hydrostatic extrusion experiments by Muira et al.∗Figure 10.8 shows that the difference between surface and centerline hardness increases both with increasing cutting angle and decreasing reduction. Moreover, if the deformation is fast enough to be adiabatic, the heating will depend on the amount of deformation.
INTERNAL DAMAGE
Figure 10.13 compares the density loss in tough pitch copper with a high content of Cu2O particles with that in oxygen free high conductivity (OFHC) copper. Figure 10.14 shows an early stage of such a coupling and Figure 10.15 shows chevron cracks formed.
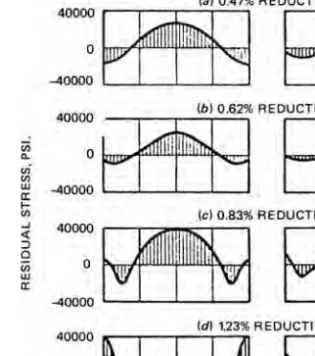
RESIDUAL STRESSES
Residual stresses on the surface of cold-drawn brass wire (left) and the same data replotted as the relationship between residual stress and yield strength versus (right). However, note that as soon as the reduction reaches 0.8%, the normal pattern of residual stress is observed on the surface.
COMPARISON OF PLANE-STRAIN AND AXISYMMETRIC DEFORMATION
Residual surface tension is particularly undesirable because it leads to increased susceptibility to fatigue and stress corrosion cracking. If the deformation is fast enough to be nearly adiabatic, the surface will be hotter than the interior.
DUCTILITY
METALLURGY
An important concern in forming is whether a desired process can be accomplished without failure of the work material.