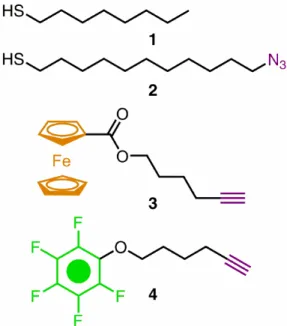
The use of the Langmuir-Blodgett technique also places design constraints on the molecule and substrate, and the molecules are not covalently attached to the electrodes. The reaction was protected from light to prevent photooxidation of the thiols.21 The Au substrates were then removed from the thiol solution, rinsed with EtOH, and dried with N2. 124 The stamping ink consisted of three solutions mixed immediately before stamping: a 5 mM solution of the alkyne molecule in acetonitrile (ACN) and 1 mM solutions of CuSO4·5H2O and ascorbic acid in ethanol (EtOH).
Several drops of the alkyne solution were added to the stamp until the surface was covered. Several drops of the 5 mM solution of the alkyne molecule were added to the Cu-coated surface and allowed to evaporate.
![Figure 5.2. Molecular structure of a amphiphilic, bistable [2]rotaxane](https://thumb-ap.123doks.com/thumbv2/123dok/10402369.0/3.918.604.751.499.1000/figure-5-molecular-structure-of-amphiphilic-bistable-rotaxane.webp)
Infrared spectroscopy measurements
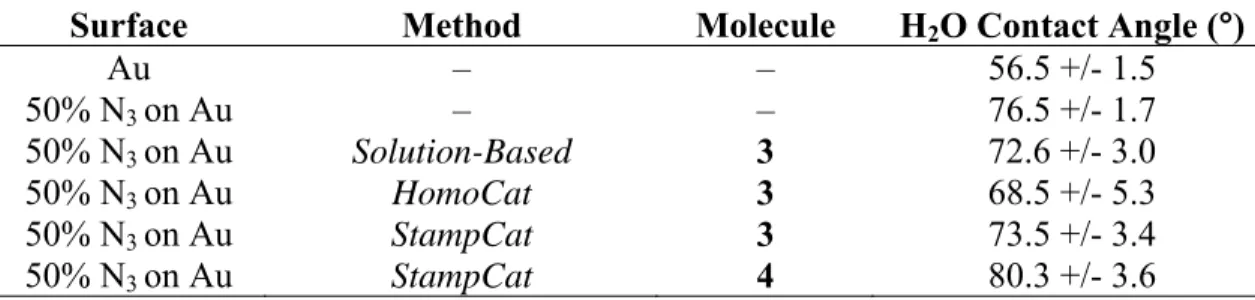
Typically, three drops per sample were measured and both the left and right contact angles were recorded and averaged.
Frictional force microscopy measurements
Electrochemical measurements
Contact angles
Grazing angle infrared spectroscopy
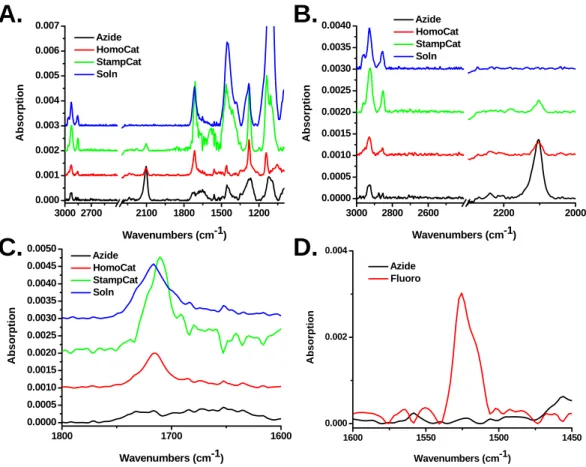
130 StampCat reaction with 4, suggesting that this peak may be due to the carbonyl stretch attached to the ester in 3. Finally, Figure 5.5D shows the spectra of the StampCat reaction with 4 and the azide-terminated surface. The spectrum of 4 has a large peak at 1625 cm-1 that was not present on surfaces containing 3.
Stacked absorption spectra of azide-terminated surface (black) and HomoCat (red), StampCat (green), and solution-based (blue) reaction with 3.
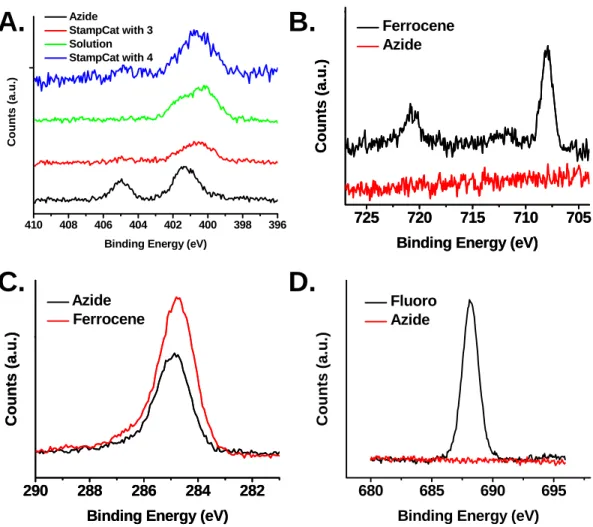
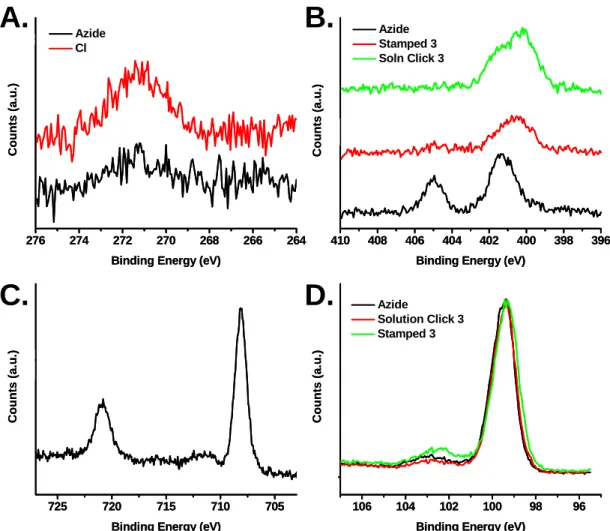
X-ray photoelectron spectroscopy
After the solution-based (green curve) and StampCat reactions with 3 (red curve) and the StampCat reaction with 4 (blue curve), the higher energy peak disappears and the peak at 400 eV broadens. Correlated with the disappearance of the azide group, an iron signal appears in the Fe 2p region (Figure 5.6B). In addition, the carbon 1s peak shows an increase in peak area after the attachment of 3 to the surface (Figure 5.6C).
Finally, docking 4 corresponded to the appearance of a large peak in the fluorine 1s region (Figure 5.6D).
Frictional force microscopy
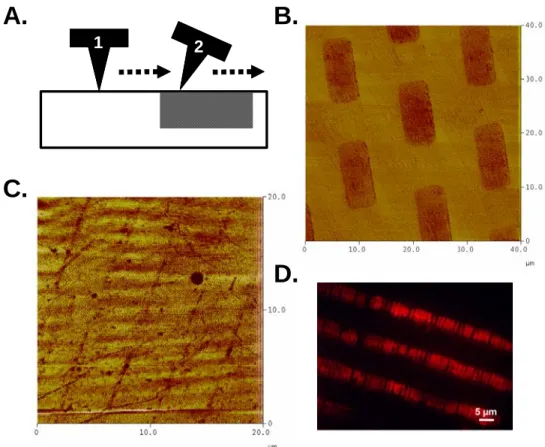
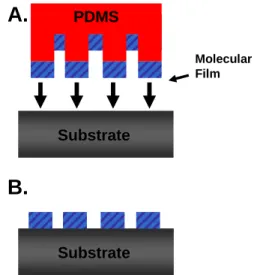
133 silicon wafers patterned with 12 x 9 μm dots or 4.25 μm stripes using EBL were used to form PDMS stamps to study pattern transfer using StampCat. Cu was deposited on the pattern dies and stamping was performed in the same way as for the flat PDMS dies. This suggests that the nature of the catalyst is truly heterogeneous and that the reaction only takes place where the stamp is in close contact with the surface.
A rhodamine fluorescence image of the pattern on the glass showing that small defects have been transferred from the stamp. The friction image recorded a series of thin lines for the sample containing the large rods. However, the stamp itself was photographed and the crossbars were shown to be distorted so that the edges were curled up.
The transfer of the pattern in Figure 5.7C was the result of only the edges of the stamp contacting the surface. This was also observed during the patterning of rhodamine on glass substrates (the experiment was performed by Dorota Rozkiewicz). Small fractures in the patterned bars (Figure 5.7D) were observed both by fluorescence imaging of the surface and in the stamp itself.
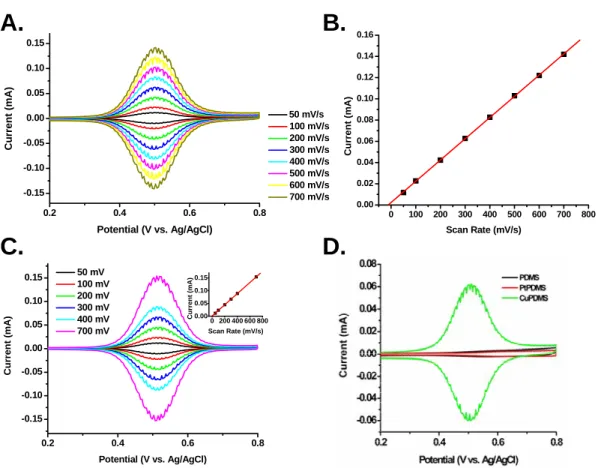
Electrochemistry
Electrochemistry showed that no reaction occurred (Figure 5.8D) for either control stamp, providing evidence that Cu metal is indeed catalyzing the CuAAC reaction. Evidence of the azide–alkyne cycloaddition occurring without a catalyst using μCP has been published.5, 6 It is difficult to explain the cause of this discrepancy. It may be that these characterization tools, none of which are able to quantify surface coverage, are much more sensitive to very low surface coverage of molecules.
The resolution of fluorescence microscopy is several hundreds of nanometers29, so a strong fluorescence image can be present even for a few molecules. Similarly to AFM, the height difference can be noticeable even at a sparse packing density of molecules. Another explanation is that the azide-alkyne cycloaddition can proceed without a Cu catalyst at elevated temperatures.30 Although not explicitly mentioned in published reports, heating of the substrates during the stamping process was performed intermittently.31 For this study, it was not necessary to remove the catalyst and there was no further attempt to investigate these various observations.
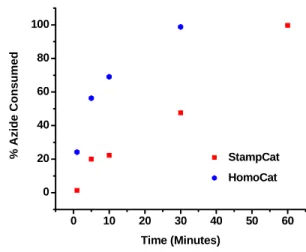
Stamp kinetics comparison
Generation of azide-terminated alkane monolayers on Si(111)
An attractive chemistry for producing azide-terminated Si(111) surfaces is the hydrosilylation reaction using a diacyl peroxide as a radical initiator.42, 43 In this reaction, a linear alkane molecule with an alkene or alkyne termination is inserted into the silicon hydride. group of a hydrogen-terminated Si surface.44 This reaction proceeds via a radical mechanism in which the diacyl peroxide undergoes homolytic cleavage and subsequent decomposition to form an alkyl radical. This radical is transferred to the Si surface where it can react with the unsaturated group in the alkane molecule. 143 electrochemical anodization or the Lewis acid-mediated reduction of a terminal alkene form oxide within minutes of exposure to air.23 The high stability of the monolayers formed via hydrosilylation is useful for applications where the Si surface must be exposed to air or aqueous environments, such as electronics and biological sensing.
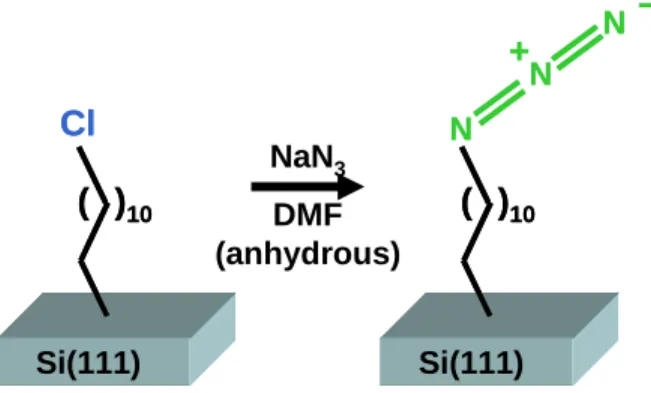
Azide-terminated monolayers were generated by first forming chlorine-terminated alkyl monolayers on the surface, followed by SN2 substitution of the chlorine in the azide. The Si pieces were then immersed in 40% NH4F until the surfaces were covered with small bubbles (indicative of hydrophobicity), ~5 min. The hydrosilylation reaction was successfully performed using a 1:1 wt:wt ratio of 1-chloro-11-undecene (Aldrich, 97%) and lauroyl peroxide (Luperox LP, Aldrich, 97%), as well as a 9: 1.
Scheme of monolayer on Si by hydrosilylation of 1-chloro-11-undecene and subsequent azide substitution. 144 containing at least two necks connected to a Shlenk line and heated to 70 °C under vacuum until the peroxide dissolves. After stopping the reaction, the samples were washed with EtOH and hexanes, sonicated twice for 5 min each in CHCl3, washed with EtOH and dried with N2.
The chlorine-terminated samples were placed in vials containing a saturated solution of NaN3 in anhydrous DMF.
Generation of direct azide-terminated silicon surfaces
Caution: The reaction vessel must be vented through a mineral oil bubbler to reduce the risk of explosion. The vials were sealed with aluminum foil and placed on a hotplate set at 100°C for at least 16 hours. After rinsing the beakers with DI H2O, they were filled with a new solution of basic piranha.
The samples were rinsed with water and placed in the basic piranha solution for 10 minutes at 80oC. The samples were then rinsed with DI H2O (the samples should be very hydrophobic at this stage) and dried with N2. The samples were loaded into a glovebox containing an inert atmosphere for the chlorination reaction.
A small amount (~1 mg) of benzoyl peroxide, the reaction initiator, was added to large glass tubes. The reaction can also be done at RT for ~5 h to create a smooth surface for STM measurements. After the reaction is complete, the samples were rinsed with THF, followed by methanol (MeOH) and immediately used for the azide substitution reaction.
Several substitution reaction conditions were tried to generate acid surfaces from the chlorine-terminated surfaces with the highest surface coverage (Figure 5.12).
HMPA or
Stamping results on azide monolayers formed via hydrosilylation
XPS analysis confirmed that the SN2 reaction to form the azide-terminated monolayers was successful. The spectra for both surfaces in Cl 2s region (Figure 5.13A) show the disappearance of the chlorine peak after the azide reaction. At the same time, nitrogen peaks appear at 401 and 405 eV, characteristic of the azide group.
The ferrocenealkyne, 3, was attached to the azide-terminated monolayers by StampCat and by the solution-based reaction, as described in Section 5.3. The XPS data in the nitrogen region show the disappearance of the peak at 405 eV and the broadening of the 401 eV, as expected. Because the monolayer on the surface contains 11 carbons, it was difficult to quantify monolayer surface coverage using the carbon 1s region.
Stacked spectra of the azide-terminated surface (black) and the 3-patterned surface via StampCat (red) and by solution-based CuAAC. Spectra of the azide-finished surface (black) and the 3-patterned surfaces via solution (red) and StampCat (green). For the azide-terminated surfaces, the amount of oxidized surface Si atoms was ~0.3, corresponding to ~70% monolayer surface coverage (Figure 5.13D).
Stamping was done outside the glove box, so the sample was exposed to the outside air for several hours.
Stamping results on direct azide-terminated silicon
Cu-coated stamps were stamped on freshly prepared, azide-terminated Si(100) and Si(111) substrates for 1 h using 3 as ink. Azide-terminated surfaces with both 30% and 70% coverage were used as substrates to see the effect of coverage and reaction efficiency. Again, no evidence was observed using XPS or contact angle measurements that the reaction occurred beyond a few percent conversion.
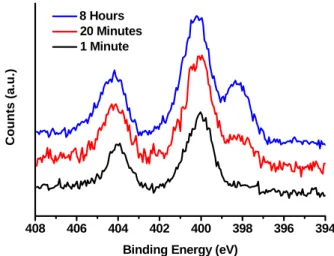
Since the azide-terminated surface is so fascinating, it is important to understand why the CuAAC reaction does not proceed readily and whether conditions exist that would be favorable. This suggests that the Si surface itself may sterically or electronically inhibit the reaction. The XP spectrum of the azide region of the azide-terminated surfaces itself has some interesting features.
Further exploration of the mechanism behind the reaction and how it is affected by the choice of solvent, and why the CuAAC reaction does not proceed readily on these surfaces, is necessary and will most likely reveal very interesting insights. XP spectra of azide-terminated Si(111) surfaces after 1 minute (black), 20 minutes (red) and 8 hours (blue) reaction time with HMPA as the solvent. Infrared and X-ray photoelectron spectroscopic studies of the reactions of hydrogen-terminated crystalline Si(111) and Si(100) surfaces with Br2, I2 and Ferrocenium in alcohol solvents.
Comparison of the electrical properties and chemical stability of crystalline silicon(111) surfaces alkylated using Grignard reagents or olefins with Lewis acid catalysts.
![Figure 5.3. Schematic of proposed [2]rotaxane synthesis. The rotaxane backbone would first be covalently attached by μCP](https://thumb-ap.123doks.com/thumbv2/123dok/10402369.0/5.918.252.730.218.686/schematic-proposed-rotaxane-synthesis-rotaxane-backbone-covalently-attached.webp)