Introduction, Background and Motivation
Introductory Remarks
Their non-centrosymmetric crystal structure also causes nonlinear optical effects and enables coupling between fields such as spiezoelectricity (mechanical and electrical) and pyroelectricity (thermal and electrical) [Dorfmann and Ogden, 2005, Goulbourne et al., 2005]. The most widely used ferroelectric in modern society is polycrystalline lead zirconate titanate (PZT), a perovskite ceramic with an extremely high piezoelectric coupling coefficient, first patented in 1954 [Rosen et al., 1954].
Ferroelectrics Fundamentals
The compositional phase diagram in Figure 1.5 shows that depending on the relative percentage of Zr and Ti, the symmetry of the crystal structure changes. In addition to patterning static domains, the issue of the kinetics of domain wall movement is also important.

Characterization of Ferroelectrics
A schematic (top right) of the stress state of the beam sample under bending shows the associated mechanically induced domain switching processes when the sample is under electrical load close to the coercive field. The characteristics of the relative compliance and damping hysteresis curves are the result of domain switching induced by mechanical strain (distinguishable from domain switching induced by the application of an e-field, although both stimuli act together).

Outline
The stored energy density of the crystal (usually referred to as the electrical enthalpy) is assumed to decompose additively into mechanical and electrical energy density [Zhang and Bhattacharya, 2005a, Su and Landis, 2007], i.e. The basic dynamic compliance taken at E = 0 kV/mm is indicative of changes in the sample's mechanical properties independent of domain switching phenomena.
Constitutive Model for Polycrystalline Ferroelectrics
Introduction
We have seen from Chapter 1 that the origins of ferroelectric domain switching have been thoroughly investigated at various scales ranging from atomic to domain level to thin films (2D) and most recently in bulk polycrystals (3D). Conversely, macroscale phenomenological models do not capture all aspects of the origins of domain switching at the microscale.
Constitutive model
Note that here and in the following we drop the dependence of the elastic moduli and the remanent stresses on polarization and electric field (unless when emphasizing this dependence), as these are obvious from the above definitions. We note that, as in the previous case, a stress-free configuration results in a vanishing effect of the elastic energy. All the above formulations of the effective enthalpy densities of poly-domain single crystals included mechanical and electrical energy.
Material-specific model parameters and relations
Here, the evolution equations for the domain volume fractions are applied within each grain individually, and the effective response is obtained by averaging over all grains. This allows us to solve the problem of variation within each grain independently and thus more efficiently. A list of all material parameters used in subsequent simulations is summarized in Table 2.1 along with relevant references.
Representative results and comparison to experiments
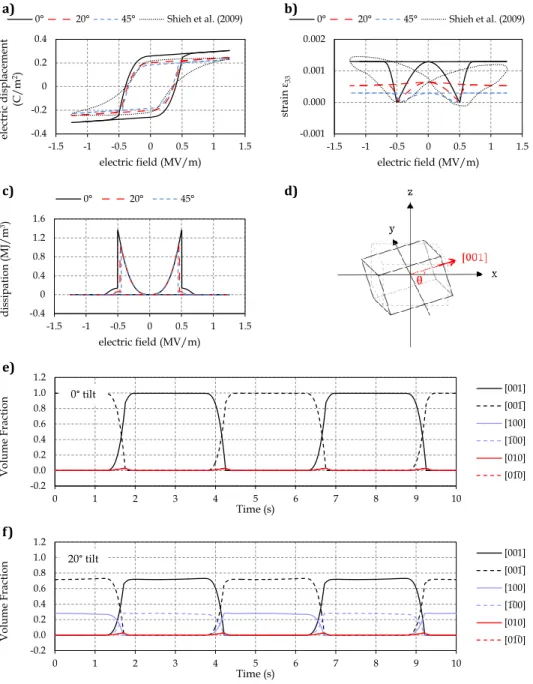
This is visualized by the plot of domain volume fractions vs. time in figure 2.2e) and f), where a 20◦ slope results in approx. 30-70%. 2015] as shown in Figure 2.3d; Unfortunately, no such experimental measurements have yet been performed for BaTiO3, but the qualitative behavior is expected to be the same. We choose the example of a cantilever beam (dimensions 1×3×15 mm) clamped at the bottom up to 20% of its length, which reproduces the configuration of the co- .. Figure 2.7: a) Electrical hysteresis, b) load hysteresis and c) dissipation of polycrystalline BaTiO3 during precompression, simulated with 100 grains of random orientations within a 20◦ misorientation cone.
Conclusions
The relative compliance peak height decreases with cycling at all frequencies. iii). This mechanically induced domain switching increases the magnitude of specimen bending, manifesting as a marked increase in dynamic compliance. In particular, the position of the highest central peak as well as the crossover point are reflected in the relative compliance and loss tangent of the 0.1 Hz electronic field curves.

Mechanical Damage during Bipolar Electrical Fatigue of PZT
Introduction
Observable effects of bipolar electrical fatigue include (i) a decrease in amplitude of the polarization hysteresis loop, indicating a loss of polarizability, (ii) a decrease in amplitude of the butterfly voltage hysteresis, implying a loss in ferroelectric activation voltage, ( iii) macroscopic cracking of samples, especially near electrodes and interfaces, and (iv) microcracking in the bulk of the polycrystal, preferably in an intragranular manner [Nuffer et al., 2000, Lupascu, 2004, Balke et al., 2007, Zhukov et al. , 2016]. The origin of the effects of ferroelectric fatigue is collectively attributed to a decrease in domain switching ability with increasing number of cycles, as well as macro and micro cracks in the body [Shang and Tan, 2001, Zhenhua et al. , 2011, Hinterstein et al., 2014, Genenko et al., 2015]. We use a combination of broadband electromechanical spectroscopy (BES) [Le Graverend et al., 2015], 3D Digital Image Correlation (3D-DIC) and statistical analysis of microcracks using scanning electron microscopy (SEM) to isolate and quantify the occurrence of microcracks and the deterioration of mechanical properties of PZT-5A during bipolar electrical fatigue at different cycle frequencies.
Materials and Methods
We measure the electrical and viscoelastic properties of the PZT-5A samples using a Broadband Electromechanical Spectroscopy (BES) setup [Le Graverend et al., 2015, Wojnar et al., 2014], schematically shown in Figure 3.1. Knowledge of the thus obtained average electric displacement and the applied bias electric field yields the electric hysteresis, which is characterized at electric-field cycle frequencies of 0.2 Hz to 10 Hz. Three-dimensional digital image correlation is used to obtain full-field, non-contact strain measurements of the sample during electric cycling.

Results
Note that this decrease in relative peak compliance is approximately half that of the decrease in polarization magnitude. Degradation trends for peak attenuation again reflect those of polarization size and relative compliance, with higher frequencies showing less degradation. As with the hysteresis curves of the other electromechanical properties shown in Figure 3.3, the magnitude of the strain hysteresis decreases with cycling.

Discussion
In the following sections, we first establish a correlation between the measured mechanical compliance data and microcrack formation, followed by a discussion of the evolution of the elec.vs. In order to quantify the effect of mechanical degradation on the overall decrease in ferroelectric performance of the sample, we examine the change in the viscoelastic properties of the baseline (ie, E =0 kV/mm) of the sample, as described in section 3.3. 2 We note that, as previously discussed, the results at the 0.2 Hz electrical cycle frequency deviate from some of the trends discussed here for viscoelastic properties.

Conclusions
As with the positions of the peaks, the positions of these dips appear to be invariant to mechanical probe frequency. Careful design of sample dimensions and in-situ setup may be necessary to maintain the same domain switching environment as a bulk polycrystal. Contribution of the irreversible displacement of domain walls to the piezoelectric effect in barium titanate and lead zirconate titanate ceramics.
Viscoelastic Measurements of Polycrystalline Barium Titanate
Introduction
Barium titanate (BT) was the first ferroelectric oxide discovered in 1945, more than twenty years after the discovery of the phenomenon of ferroelectricity in Rochelle salts and ten years after the discovery of ferroelectricity in the potassium dihydrogen phosphate (KDP) family of crystals. [Rosen et al., 1954]. 2005] demonstrated voltage limits in ferroelectric polycrystals of a single crystallographic phase via neutron diffraction experiments, and in early experiments on poling of polycrystalline BT, Subbarao et al. Most in-situ experimental observations of microscale domain switching processes in BT have been up to so far performed on thin films and nanocrystals [Gao et al., 2013; Polking et al., 2012], because these sample dimensions are necessary for the characterization methods used such as transmission electron microscopy (TEM), polarized light microscopy (PLM) and X-ray diffraction (XRD).
Materials and Methods
Results
As with the 0.1 Hz e-field, the positions of the peaks and dips appear to be relatively insensitive to mechanical probe frequency, while the crossover point shifts negatively to lower mechanical probe frequencies. Nevertheless, at 150 Hz mechanical probe frequency, there is a hint of the same central peak as well as a slight dip where the e-field ramp direction changes. In both series, the position of the crossover point shifts to more negative e-fields for lower e-field frequencies.

Discussion
This is consistent with the observed overall low relative compliance and attenuation during low-frequency e-field cycling. This is consistent with the observed overall higher relative compliance and damping with high-frequency e-field cycling. Instead, increases in relative compliance and damping are postulated to arise from an increase in domain wall surface area.

Conclusions
Since these forces are balanced, the applied mechanical oscillation can perturb the domain wall in either direction, leading to mechanically induced domain switching. Testing how grain size affects measured BES properties may provide further insight into the domain switching process in barium titanate polycrystals. The effect of domain patterns on 180° domain switching in batio3 crystals during antiparallel electric field charging.
Conclusions and Outlook
Summary
The aim of this thesis was to develop a better understanding of domain switching processes in bulk perovskite ferroelectric ceramics using BT and PZT as representative materials. Meanwhile, a constitutive material model incorporating microscale domain switching physics was formulated as a step toward predicting macroscale electromechanical properties from microscale processes and vice versa. In conclusion, the experimental methods presented in this thesis contribute to the understanding of ferroelectric domain switching processes in bulk polycrystals, especially when judiciously paired with microscale observations.
Outlook & Future Work
Thus, a study of its electromechanical response at these frequencies would provide valuable information about domain switching processes under normal operating conditions. Investigation of frequency effect on electrical fatigue and crack tip domain switching behavior in Pb(Mg1/3Nb2/3)0.65Ti0.35O3 ceramics via synchrotron X-ray diffraction. Continuum thermodynamics of ferroelectric domain evolution: theory, finite element implementation and application to domain wall pinning.
![Figure 1.1: Classification of dielectrics based on crystal symmetry. [Haertling, 1999, Helman, 2016]](https://thumb-ap.123doks.com/thumbv2/123dok/10405753.0/19.918.204.724.392.716/figure-classification-dielectrics-based-crystal-symmetry-haertling-helman.webp)


![Figure 1.12: Examples of experimental BT polarization curves to demonstrate the variety of hystersis behavior within the same material: a) and b) are single crystals of BT switching under applied pressure [Shieh et al., 2009, Burcsu et al., 2004], c) are p](https://thumb-ap.123doks.com/thumbv2/123dok/10405753.0/32.918.177.730.121.600/examples-experimental-polarization-demonstrate-hystersis-behavior-material-switching.webp)


