MODELING OF CUSTOMER SATISFACTION AND CUSTOMER LOYALTY IN FAST FOOD INDUSTRY
Sum Sochenda
National University of Management, Kingdom of Cambodia Email: [email protected]
Abstract: The main objectives of this paper were to examine the antecedent factors (i.e., quality of service, quality of food, quality of physical environment, fairness of price and brand image) that influenced customer satisfaction, and then assess the causal relationships between customer satisfaction and customer loyalty in the fast-food restaurant segment. By a convenience sampling approach and self-administered questionnaire method, the questionnaires of 480 were distributed to customers of 6 brand fast-food restaurants in Phnom Penh, Cambodia, and then having only 403 (=83.95%) of the total sample size usable for this study. In compliance with the structural equation modeling (SEM) techniques, the collected data were analysed with the statistical software SPSS 22.0 and AMOS 26 Graphics.
Confirmatory factor analysis (CFA), moreover, was employed to verify the goodness-of-fit of data towards the model, indicator and composite reliability, and convergent and discriminant validity before running SEM.
This study found that brand image was the most significant positive predictor to stimulate customer satisfaction, followed by quality of food and fairness of price, except the quality of service and quality of physical environment. The level of customer loyalty, in turn, was influenced by customer satisfaction. The findings truly provided the requisite contributions to the existing theories and managerial implications particularly relevant to determining the success factors within the fast-food restaurant context.
Keywords: Quality of service, quality of food, quality of physical environment, fairness of price, brand image, customer satisfaction, customer loyalty, SEM, fast- food restaurant.
Introduction
In general, the business organizations find out and try to setup the strategies to meet the customers’ needs and wants, and then customers will feel satisfied. However, it is difficult to determine what the factors have the actual effects on the customer satisfaction. As stated by Sabir, Ghafoor, Hafeez, Akhtar, & Rehman (2014), guest satisfaction plays a pivotal role in success of every business organization whether it is meant for a product or a service.
Why this consideration regarding customer satisfaction? Some policymakers accepted that consumer satisfaction is an imperative pointer of national financial wellbeing. They recognized that it is insufficient to track financial proficiency and valuing insights.
Satisfaction, they realize, is additionally an essential measurement tool of life quality. Many scholars believed that customer satisfaction was connected with different measures of
monetary wellbeing, for instance, stock value and corporate income (Zeithaml, Bitner, &
Gremler, 2009). The fast-food industry in Asia is on an upward trend. The demand for a fast food product is now growing as it is convenient which suits the lifestyle of customers.
Therefore, local fast foods restaurants have to be sensitive to these changing trends and to be innovative and get prepare to change accordingly to avoid from losing their existing and future potential customers (Rabbi, Ahmed, Saha, & Sutradhar, 2013).
Nevertheless, restaurants and cafés are opening up frequently in Phnom Penh, and with many venues for food connoisseurs to choose from, the food and beverage (F&B) industry still need improvements in “HQSCV”.
Problem Statement
The eatery segment is currently considered as a standout amongst the most conspicuous and far-reaching parts of every one of them. It has now turned into a worldwide sensation with overall marketers and consumers (Bhattacharya, Sengupta, & Mishra, 2011). By a macro- economic perspective, the increase of disposable income and the decrease in population growth resulted in the deceleration of food demand. The technological and scientific developments of the last half-century, however, provided a rise to worldwide scale distribution and production of food, making an and ever-increasing and ever-diverse food supply almost for all time available everywhere (Costa, 2003).
People are eating out more often (Fanning, Marsh, & Stiegert, 2005 and Jekanowski, Binkley, & Eales, 2001), but they increasingly put a premium on saving time (Wales, 2009) and eating healthy (Untaru & Ispas, 2013) in better eating environments (Tan, Oriade, &
Fallon, 2014; Marković, Raspor, & Šegarić, 2010; Yoo, 2012). Consequently, the quick- casual context has emerged as a broadening type in the foodservice segment. This classification carries out a niche between full-service and fast-food restaurants. Although service is minimal, quick-casual restaurants offer menus and décor more reflective of casual dining restaurants (Ryu & Han, 2010). Young people generally were not troubled with food preparation and that was the reason that they would prefer to get out for their meals. They regularly visited fast-food restaurants, especially when there was nobody to cook for them (while they study away from home) and when they wanted to socialize (Untaru & Ispas, 2013). The demand for fast food supply has been on an increasing trend (Srinivasan &
Shende, 2015), especially in a society where consumers are busy working. Previous studies had shown that most working people hadn’t much time at home. Hence, they have been needing an appropriate product, for instant fast food which was convenient for them and suited their lifestyle (Shaharudin, Mansor, & Elias, 2011). The guest delight process was a sophisticated phenomenon. The purchase of goods or services includes some factors that could affect each decision (Ubeja, 2014).
Literature Review Quality of Service
Quality is usually a conditional, perceptual, and somewhat subjective characteristic, and may be seen diversely by distinctive individuals. Buyers may concentrate on the required quality of a product and service, or how it may compare to rivals in the market. Makers might gauge the quality of conformance or the degree to which the product and service were produced effectively (Bhakar, et al., 2013). According to Parasuraman, et al. (1985), they gave the big revolution in marketing research related to the quality attainment in service, which became a pivotal concern during the 1980s. They rectified this concern by explaining
and describing clearly the dissimilarities between the perceived service and the expected service, and then these instruments, known as SERVQUAL, were utilized mostly to measure the service quality and some major components influencing the expected service. The first formation of SERVQUAL incorporates ten components such as (1) access, (2) communication, and so on. However, with their work in 1988, these components, as noticed by Buttle (1996), were distorted into five dimensions, including reliability, responsiveness, assurance, empathy, and tangibles which we will discuss in more detail about these criteria in the below part of the service quality.
With the modified scale of DINESERV and three developed sources (literature, restaurant’s survey, and interview responses of customers), an investigation of the relationship between the service quality and client satisfaction in the Chinese fast food sector, conducted by Tan, et al. (2014). Their study found that the variables of service quality had a positive influence on customer satisfaction, except the 'reliability' dimension. The new measurement approach for Chinese Fast Food Restaurants Service Quality was considered as CFFRSERV employed to enhance the quality of service in Chinese fast-food outlets.
Based on the above examination and discussion, this research followed the conjoined concepts/models resulting from the modification of both SERVEQUAL and DINESERV.
Consequently and reasonably, we will apply the four major scales in terms of accurately measuring the quality of service in the fast-food context here: (1) reliability, (2) responsiveness, (3) assurance, and finally (4) empathy.
Therefore, it is reasonable for setting the hypothesis involved in the relationship quality of service and customer satisfaction as following:
Ha(1): Quality of service has a positive influence on customer satisfaction
Quality of Food
The definition of food quality may be different due to the food type and the food preference of an individual. The key features of food quality may include freshness, wholesomeness, texture, colour, nutritional value, flavour, and fragrance (Huda, Muzaffar, &
Ahmed, 2008). Based on the study of factors influencing client satisfaction and behavioural intention towards quick-casual restaurants, Ryu & Han (2010) had utilized three criteria for their evaluation including quality of food, service, and physical environment. They found that the quality of food is the most significant component among these variables, followed by the quality of physical environment and the quality of service. Namkung & Jang (2007), who investigated the matter of food quality and its effect on guest fulfilment and behavioural intentions in restaurants, had employed six food quality attributes including presentation, variety, healthy options, taste, freshness, and temperature. Their study found that taste and presentation were the two most significant contributors to guest fulfilment and behavioural intentions. They also suggested that restaurant managers have to focus on these major food quality attributes that create guest delights and improve repeated visits to the restaurant.
Kivela et al. (1999) also appreciated food presentation as a fundamental food attribute towards modeling dining satisfaction.
Therefore, it was reasonable to set the hypothesis as following:
H a(2): Quality of food has a positive influence on customer satisfaction
Quality of Physical Environment
Through Yarimoglu’s (2014) review on dimensions involved in service quality models, there are only three vital components of the service marketing mix used to create the relationship within the dimensions of service quality including physical environment, people, and process. Physical environment denoted the designation of service surroundings and the provision of such tangible cues of service performances as interior design, vehicles/equipment, furnishings, and staff clothing. In Ryu & Jang’s (2008) investigation on the guests’ perception of dining environment by using DINESCAPE model, the authors chose five main scales to measure the quality of restaurant surroundings such as (1) facility aesthetics, (2) ambiance, (3) lighting, (4) table settings, (5) layout, and finally (6) service staff. Meanwhile, Andaleeb & Conway (2006) employed only four following attributes: (1) lighting, (2) parking, (3) restaurant cleanliness, and (4) décor in the dimensions of physical design and appearance.
Even though the exploration studied by Untaru & Ispas (2013) for the cause of the young people’s preferring the fast-food restaurants didn’t focus on public guests, their examination gave us the more specific scales which should be used in the accurate assessment of physical evidence quality. Four major determinants of restaurant atmospherics included (1) hygiene/cleanliness, (2) spatial layout and functionality, (3) atmosphere, and (4) ambient conditions.
Therefore, it was reasonable to set the hypothesis as following:
Ha(3): Quality of physical environment has a positive influence on customer satisfaction
Fairness of Price
Price fairness refers to an overall judgment of price created by the customer and relied mainly on the comparison of the actual price to satisfactory price assigned by both self- interest (level of adaptation) and social standards (reference price). Price fairness was hypothesized as one key element of customer giving-up and price perception of a customer was stared as a variable in addition to other service fairness forms (Namkung & Jang, 2010).
The fairness of perceived price is a highly involved marketing concern for corporates. Some researchers found it had an impact on willingness to purchase, customer satisfaction, loyalty, and long-term profitability (Bieger, et al., 2010). In general, willingness to pay differs from reference price_what consumers expect to pay_ but it has habitually been employed to indicate the highest amount that customer plans to pay (Chung, Kyle, Petrick, & Absher, 2011). As mentioned by Dai (2009), a firm can charge for service, however, the firm has to design a good experience that its consumers can judge to be a good value for the price.
Therefore, it was realistic to set the hypothesis as following:
Ha(4): The fairness of price has a positive influence on customer satisfaction
Brand Image
For Wijaya (2013), the brand image can be expected as a bunch of brand affiliations that are gathered in the personalities of purchasers. For the dimension of brand image, Andreani, Taniaji, & Puspitasari (2012) utilized three factors generating the image of brand connected to the association of brand including the uniqueness, strength, and favourability of brand association. Nevertheless, Keller (1993) defined the brand image as a set of sensitivities that customers form as mirrored by brand associations and since the brand image for a catering
business is frequently beyond tangible and visible features, vital to the success of catering business is a powerful image of a brand, which support consumers’ envisioning and hence building optimistic attitudes towards services before buying (as cited in Jin, Lee, & Huffman, 2012, p. 534).
Therefore, it was realistic to set the hypothesis as following:
Ha(5): The brand image has a positive influence on customer satisfaction
Customer Satisfaction
Customer satisfaction was the psychological state to evaluate the rationality between what a consumer, in fact, acquires and provides (Howard & Sheth, 1969). Customer loyalty was a strong and deep commitment to repurchase or continuous purchase of a preferred product or service in the future (Haghighi, et al., 2012). In the research of Lahap, Ramli, Said, Radzi, & Zain (2016) testing the positive relationship between the image of brand and client fulfillment, it stated that brand image was really a main factor in predicting significantly the satisfaction of consumers. This result was also similar to other scholars’
studies, namely Chien-Hsiung (2011) who studied the relations of brand image to consumer delightment in catering areas; stating that in the catering industry, the most significant aspect of brand image was the consumer benefit provided by the brand, which was the delivery of the brand essence to the customers. Studies on customer satisfaction and brand image incorporation might be extended to the creation of a brand image that completely met customer satisfaction based on the process of progressively creating a brand image in the catering industry.
Therefore, it was accurate to set the hypothesis as following:
Ha(6): Customer satisfaction has a requisite influence on customer loyalty
Research Methodology Data Collection:
This study utilized self-administered questionnaires, in which the respondents or participants had to complete the questionnaires on their own. Before a prevalent survey, conducting the pilot test of 40 was to evaluate scale reliability to attain the appropriate questionnaire design. In compliance with the sampling convenience method and a Likert scale from 1 to 7 (1=Definitely Disagree; 2=Generally Disagree; 3=Slight Disagree; 4=Not Sure; 5=Agree; 6=Generally Agree; and 7=Definitely Agree), the google-form questionnaires of 480 were distributed to Cambodian customers of 6 brand fast-food restaurants in Phnom Penh. As a result, only 403 of the total sample size was valid for this study, yet satisfied the rule of thumb for the minimum required size of 200 recommended by Hair, Risher, Sarstedt,
& Ringle (2019) in terms of structural equation modeling (SEM) method.
Ha(1)
Ha(2)
Ha(3) Ha(6)
Ha(4)
Ha(5)
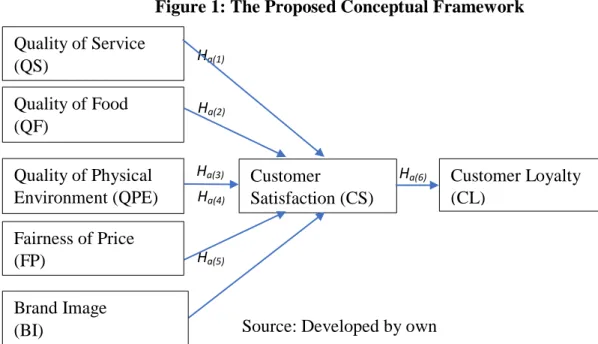
Figure 1: The Proposed Conceptual Framework
Source: Developed by own
In addition, this study used the quantitative methodology with the experimental research design to measure specifically the causal relationships among the constructs (exogenous latent variables and endogenous latent variables). Consequently, covariance-based structural equation modelling (SEM) was the effective tool and prominent approach to derive reliable and accurate outcomes from analysis in such a social and psychological context. This study also employed confirmatory factor analysis (CFA) to check goodness-of-fit indices (absolute and incremental fit indices including ⁄ <3.00, RMSEA<0.08, GFI>0.80, NFI>0.90, IFI>0.90, TLI>0.90 and CFI>0.90) to assure that the collected data fitted the hypothesized models. Besides, this study verified the strength of the inter-construct correlation for the whole model with a generally significant level of 0.10. To avoid useless and misleading results, the assessment of indicator reliability (indicator loading>0.50), composite reliability (CR>0.70), convergent validity (average variance extracted>0.50), and discriminant validity (heterotrait-monotrait matrix<0.90), suggested by Hair, et al. (2019), required by this method with the significant level of 0.10. Finally, this study might address the research questions and particularly was able to derive the utmost conclusion towards findings relative to the existing literature and previous research outputs.
Data Analysis and Findings Demographic Profile
The profiles of demographic include the information of respondents’ profiles among the valid percentage of 403. Usually, 189 (=46.9%) of total number got outside “occassionally”
during a month, followed by 2-time monthly with the amount of 72 (=17.9%), to have a meal at fast-food restaurants. Moreover, their main reasons to dine out were “quick meal and convenience” with a higher value of 195 (=48.4%). Frequently, the fast-food restaurants’
guests of 228 (=56.6%) tended to dine out at the meal time of “dinner” with 194 (=48.1%) regularly spending “$6-$15” for a meal. For the “gender” variable, the proportion of males represents 229 (=56.8%). Meanwhile, the respondent's age was in the range of “24-35” years old taking 179 (=44.4%), similarly to the respondents’ characteristics in the empirical study of Sahagun & Vasquez-Parraga (2014), in which 62.4% of the respondents’ age were in the
Quality of Service (QS)
Quality of Food (QF)
Quality of Physical Environment (QPE)
Customer
Satisfaction (CS)
Customer Loyalty (CL)
Fairness of Price (FP)
Brand Image (BI)
range of 21 and 40 years. Then, the majority of respondents’ occupations were students consisting of 148 (=36.7%), followed by “company officer” of 135 (=33.5%). Their average income per month was less than or equal to $250 in which represented 160 (39.7%), however, followed by 146 (=44.2%) that had earned around “$250-$750” per month.
CFA Analysis
According to Dragan & Topolšek (2014), the primary objective of CFA is to examine whether the data is fitting the hypothesized measurement model in which is grounded on a specific theory. This approach will enable the researchers to test how well the manifest variables (also called observed variables) exemplify a reduced number of constructs.
CFA Performance of Initial Manifest Variables
Before performing the analysis of covariance-based SEM, as explained by Hair, Risher, Sarstedt, & Ringle (2019), the assessment of the reflective measurement model is required.
The first step is the involvement of scrutinizing the indicator loadings. Moreover, loadings should be above 0.708. Then, providing acceptable item reliability if the construct clarifies more than 0.50 of variance of the indicator.
Figure 2. Measurement of Initial Items
Source: Developed by own
Therefore, the collected data here were screened with the CFA by using AMOS 26 Graphics to verify the essential manifest variables or indicators to accomplish the model-fit assumptions (Hanaysha & Pech, 2018). Due to Figure 2, all the values of indicator loading (also so-called regression weights and referring to the standardized loadings) were over 0.50 at 0.001 level of significance. In another word, those loadings had achieved the acceptable indicator reliability, which was significantly different from 0 at the 0.001 level.
However, Table 4.1 revealed the some of necessity model-fit indices that were not acceptable or satisfactory because these indices below or above the cut-off values or the level of acceptable threshold ( ⁄ = 3.235, RMSEA = 0.075, GFI = 0.715, IFI = 0.844, NFI =
0.788, TLI = 0.833, and CFI = 0.843). In this case and as specified by Schumacker & Lomax (2010), if the model fit of the implied theories is not as robust as one would be identical, at that point the subsequent step is to adjust the model and consequently assess the new revised model. On the other hand, to determine how to modify the model, there are some attractive procedures available for the detection of specification errors so that more properly specified alternative models would be assessed in the duration of the re-specification process.
CFA Performance of Final Manifest Variables
Due to this result, the current model was lacking the model fit. Therefore, the model with all of the initial indicators would be re-examined to look for the problematic indicators and afterward removed from the constructs to improve the model fit. However, with the purpose of determining how to revise the initial model, there are several techniques such as specification search procedure or misspecification of correlated measurement residual (also known as disturbance, remainder, or error term) obtainable for the concealment of specification errors so that more appropriately indicated alternative models could be evaluated during the re-specification process (Schumacker & Lomax, 2010). Now, this study chose both procedures of checking correlated measurement disturbance and specification search with carefully the evaluation of tier alternative model from the initial model to the second model,… till the acceptable fit was accomplished. Noticeably, Kenney (2012) pointed out that the number of items (or manifest indicators) for each factor in the structural model must be at least two (as cited in Hanaysha & Pech, 2018).
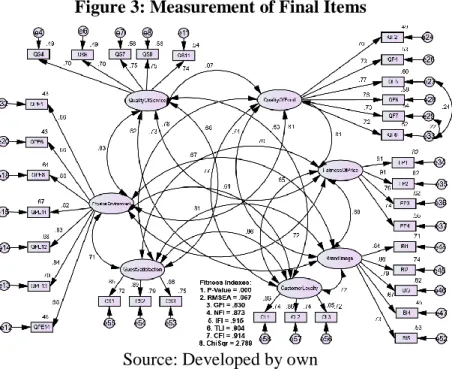
Figure 3: Measurement of Final Items
Source: Developed by own
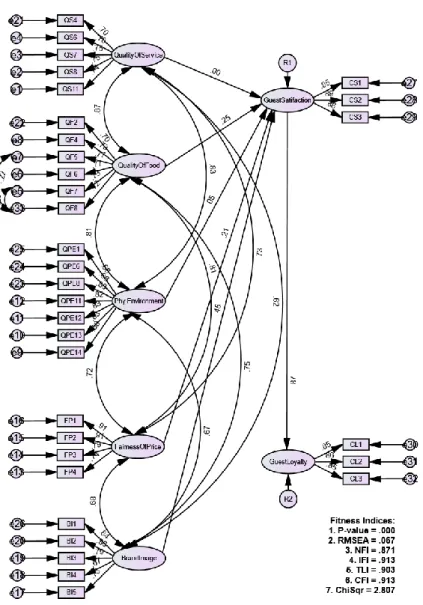
As exposed in Figure 3. The models with final manifest variables were built throughout CFA with the data that fits the models ( ⁄ = 2.789, RMSEA = 0.067, GFI = 0.830, NFI = 0.873, IFI = 0.915, TLI = 0.904, and CFI = 0.914).
Idicator Reliability
These results showed that all values of loadings on each latent factor were between 0.70 and 0.90, exept that loadings of QPE1, QPE6, QPE14 and BI4 were close to 0.70, signicantly different from zero at 0.001 level (two-tailed). For the squared multiple correlation (also known as coefficient of determination) that represents the percentage of the variance in the outcome variable of a regression model which can be explained by the explanatory variables (Bowerman, et al., 2009), these values are between 0.40 and 0.90. As explained by Hair, et al. (2019), R2 values of 0.25, 0.50 and 0.75 are reflected weak, moderate and substantial. In summary, the total amount of initial indicators in the measurement models was 48, and then there were remaining only 33 in the final measurement models since exogenous manifest indicators of 15 were eliminated from the initial model so that the primary aim to have to reach the satisfactory model fit was achieved.
Construct Correlation
Recall that the Coefficient of Correlation (r), as explained by Lind, Marchal, & Wathen (2008), is a degree of the strength of the link between two variables. Additionally, it needs ratio-scaled or interval data, and it is between -1.00 and 1.00. Values nearby 0.00 are defined
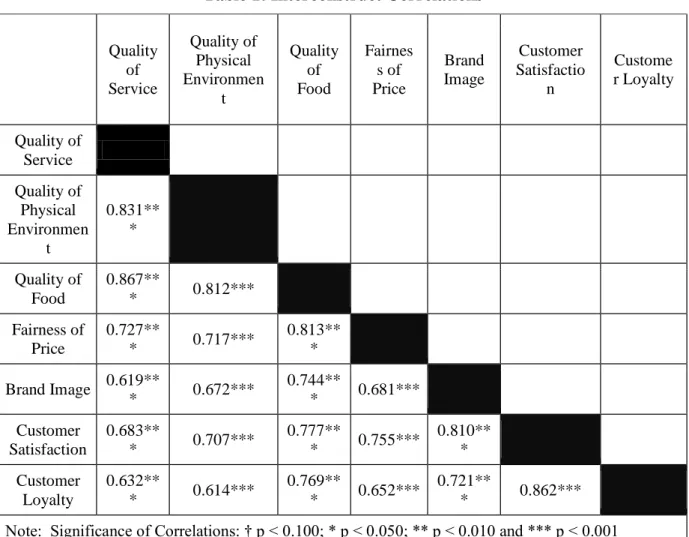
Table 1: Interconstruct Correlations
Quality of Service
Quality of Physical Environmen
t
Quality of Food
Fairnes s of Price
Brand Image
Customer Satisfactio
n
Custome r Loyalty
Quality of Service Quality of
Physical Environmen
t
0.831**
*
Quality of Food
0.867**
* 0.812***
Fairness of Price
0.727**
* 0.717*** 0.813**
* Brand Image 0.619**
* 0.672*** 0.744**
* 0.681***
Customer Satisfaction
0.683**
* 0.707*** 0.777**
* 0.755*** 0.810**
* Customer
Loyalty
0.632**
* 0.614*** 0.769**
* 0.652*** 0.721**
* 0.862***
Note: Significance of Correlations: † p < 0.100; * p < 0.050; ** p < 0.010 and *** p < 0.001 Source: Developed by own
as weak correlation, and equal or close to -1.00 or 1.00 represents the perfect and strong correlation. Positive values confirm a direct relationship and negative values show an inverse relationship. According to Hair, et al. (2009), concerning the Pearson correlation, the null hypothesis states that there is no link between 2 variables and the coefficient of correlation is 0.00.
Using the software of AMOS 26 Graphics, Table 1 showed the inter-construct correlation measuring the degree of strength in relationships between the exogenous latent variable (i.e., quality of service, quality of food, quality of physical environment, fairness of price, and brand image) and other endogenous latent variables (i.e., customer satisfaction and loyalty). Outcomes demonstrated that the correlation coefficient for service quality and customer satisfaction was 0.683 (p-value<0.001), indicating the strong association between both constructs. In short, all values of inter-construct correlations were bigger than 0.61, indicating the strong relationship between all constructs in the model. Nevertheless, the correlation coefficients of customer satisfaction and brand image were high (r=0.810; p- value<0.001), demonstrating that there was a very strong association between both constructs, followed by food quality (r=0.777, p-value<0.001) and price fairness (r=0.755, p- value<0.001). Additionally, the correlation between customer satisfaction and loyalty was also high (r=0.862, p-value<0.001) and confirming the very strong link for both variables.
Composite Reliability
After the fit of the hypothesized measurement model was attained, the second step was that the composite reliability (also known as construct reliability) must be examined to evaluate and assure the internal consistency reliability. As specified by Glen (2019), composite reliability refers to the measure of “internal consistency in scale items”. In general, the higher values point out the higher levels of reliability. For Glen (2019), despite that threshold for composite or construct reliability are available for debate, a rational threshold maybe somewhere from 0.60 and above, by the way of different authors proposing various threshold recommendations. In the exploratory research, construct reliability is acceptable if the computed values are in the range of 0.60 and 0.70, and then it is considered as
“satisfactory” to “good” in the case that values are in the range of 0.70 and 0.90.
Nevertheless, values of 0.95, as explained by Diamantopoulos, et al. (2012) and Drolet and Morrison (2001) and higher are troublesome (as cited in Hair, et al., 2019), it means that the manifest variables are redundant, and as a result of that the construct validity will decrease.
For this reason, the values of 0.95 and more than likewise advocate the likelihood of undesirable response forms.
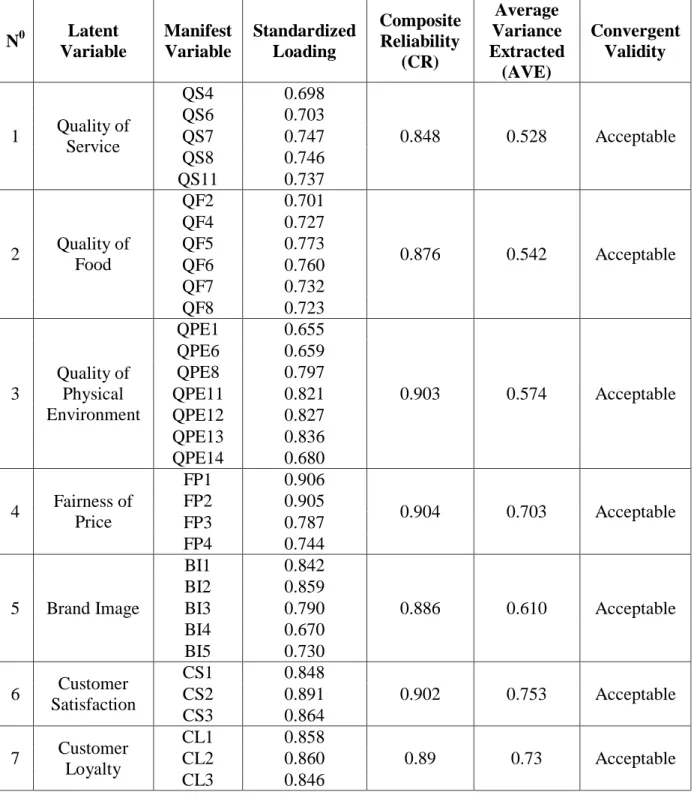
Table 2: Composite Reliability and Convergent Validity
N0 Latent Variable
Manifest Variable
Standardized Loading
Composite Reliability
(CR)
Average Variance Extracted (AVE)
Convergent Validity
1 Quality of Service
QS4 0.698
0.848 0.528 Acceptable
QS6 0.703
QS7 0.747
QS8 0.746
QS11 0.737
2 Quality of Food
QF2 0.701
0.876 0.542 Acceptable
QF4 0.727
QF5 0.773
QF6 0.760
QF7 0.732
QF8 0.723
3
Quality of Physical Environment
QPE1 0.655
0.903 0.574 Acceptable
QPE6 0.659
QPE8 0.797
QPE11 0.821
QPE12 0.827
QPE13 0.836
QPE14 0.680
4 Fairness of Price
FP1 0.906
0.904 0.703 Acceptable
FP2 0.905
FP3 0.787
FP4 0.744
5 Brand Image
BI1 0.842
0.886 0.610 Acceptable
BI2 0.859
BI3 0.790
BI4 0.670
BI5 0.730
6 Customer Satisfaction
CS1 0.848
0.902 0.753 Acceptable
CS2 0.891
CS3 0.864
7 Customer Loyalty
CL1 0.858
0.89 0.73 Acceptable
CL2 0.860
CL3 0.846
Source: Developed by own
Convergent Validity
The third phase of the measurement model evaluation reports the convergent validity related to the measurement of each construct or latent factor. Convergent validity is involved in the extent to which the factor converges to explain the variance of its indicators (or items) (Hair, et al., 2009). They added that the metric applied for assessing a convergent validity related to a construct is the “average variance extracted” (AVE) for all of the indicators on each factor. In computing the AVE, it has to square the standardized loading of each item on a factor and calculate the mean value. Then, the computed value of AVE will be compared to the cut-off value. In general, an acceptable AVE must be 0.50 or above, demonstrating that the construct can explain no less than 50 percent of the variance of its items.
As shown in Table 2, the AVE value of the first latent factor related to QS equaled 0.528 more than 0.50 so that QS was having convergent validity. Likewise, the AVE value of a latent variable QF was equal to 0.542 above the cut-off value of 0.50 so that it was having convergent validity. For the latent variable QPE, its AVE value of 0.574 was above the threshold value of 0.50, making this construct also have convergent validity. Similarly, the latent variable of FP was having convergent validity since its AVE value of 0.703 was more than the cut-off value of 0.50. Moreover, the three last latent variables of BI, CS, and CL had AVE values of 0.610, 0.753, and 0.730, which were all more than the threshold value of 0.50 so that these variables were also having convergent validity. In short, the overall measurement model’s convergent validity was validated since all AVE values were above the cut-off value of 0.50.
Discriminant Validity
Fornell and Larcker (1981) suggested the classic metric in which AVE of each construct should be compared to the square of inter-construct correlation (also known as a measure of shared variance) estimate of that same factor and all of other reflectively measured factors within the structural model (as cited in Hair, et al., 2019). According to Dragan & Topolšek (2014), when all AVE values are more than the corresponding square of inter-construct correlation values, it is indicating a decent confirmation of discriminant validity. Nonetheless, the maximum shared variance (MSV) and average shared variance (ASA) for all model constructs that should be less than their AVEs are becoming problematic in judging the evidence of discriminant validity. According to Hair, et al. (2019), the indication from recent research declared that this traditional metric proposed by Fornell and Larcker (1981) is not appropriate for the assessment of discriminant validity.
Additionally, another approach for measuring discriminant validity refers to the heterotrait-monotrait ratio of correlation in which this tactic was developed by Campbell &
Fiske (1959) and so-called the multitrait-multimethod matrix (also known as HTMT analysis). Depending on the findings of Henseler, Ringle, & Sarstedt (2015), the higher performance of this approach through simulation study was proposed by Monte Carlo and explored that HTMT has the competence to accomplish greater specificity and sensitivity rates between 97% to 99% percent compared to Fornell-Lacker criterion having only 20.82%
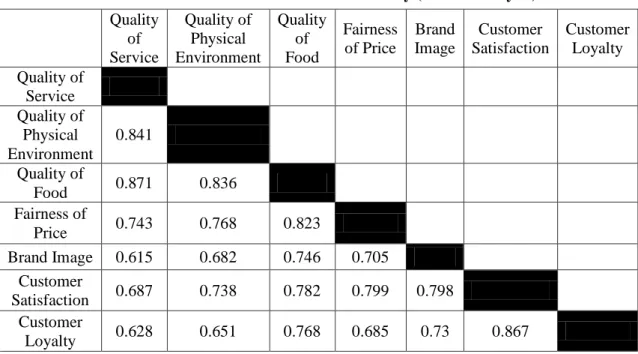
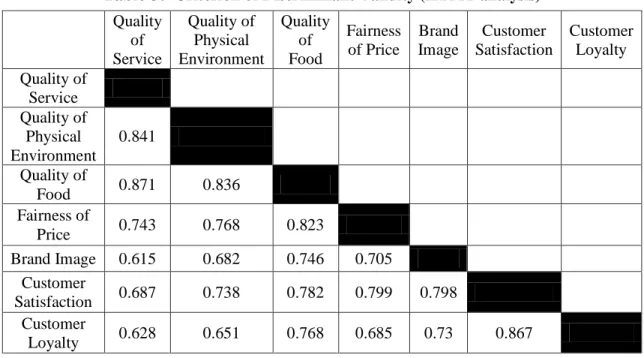
and the cross-loadings criterion with 0.00%. In general, the HTMT values close to 1 confirm a lack of discriminant validity. Through HTMT analysis, its computed values could be compared to a specifically predefined cut-off value. The construct was concluded that it had violated discriminant validity when the HTMT values were bigger than a threshold of 0.90 recommended by Hair, et al. (2019).
By using the software of AMOS 26 Graphics, Table 3 showed the results of discriminant validity throughout an HMTM approach in CFA. For a construct of QS, the HTMT values of 0.841, 0.871, 0.743, 0.615, 0.687, and 0.628 were all smaller than a threshold value of 0.90, proofing that QS was statistically distinguishable. Then, the HTMT values of 0.836, 0.768, 0.682, 0.738, and 0.651 for a factor of QPE were also less than the cut-off value of 0.90, demonstrating that QPE was statistically different as well. Additionally, the HTMT values for QF were 0.823, 0.746, 0.782, and 0.768, which were no bigger than a threshold value of 0.90, indicating that QF was statistically divergent. Concerning a factor of FP, the HTMT values of 0.705, 0.799, and 0.685 were not larger than 0.90, stating that FP was likewise statistically discriminant. Involved with a latent variable of BI, the HTMT values of 0.798 and 0.730
were less than 0.90 for cut-off, confirming that BI was statistically distinct. For the last factor of CL, the HTMT value of 0.867 was also smaller than 0.90, specifying that CL was statistically distinct. In short, the overall measurement model validated the discriminant validity.
Results of SEM Performance
Table 4: Output of SEM Performance
Table 3: Criterion of Discriminant Validity (HTMT analysis)
Quality of Service
Quality of Physical Environment
Quality of Food
Fairness of Price
Brand Image
Customer Satisfaction
Customer Loyalty Quality of
Service
Quality of Physical Environment
0.841
Quality of
Food 0.871 0.836
Fairness of
Price 0.743 0.768 0.823
Brand Image 0.615 0.682 0.746 0.705
Customer
Satisfaction 0.687 0.738 0.782 0.799 0.798
Customer
Loyalty 0.628 0.651 0.768 0.685 0.73 0.867
Source: Developed by own
N0 Regression Paths Estimate S.E. C.R. P
Ha(1) Quality of
Service --> Customer
Satisfaction 0.001 0.095 0.006 0.995 Ha(2)
Quality of
Food --> Customer
Satisfaction 0.277 0.130 2.127 0.033*
Ha(3) Quality of --> Customer 0.064 0.088 0.724 0.469
After running SEM, the Amos-26-Graphics output was shown in Table 4 and Figure D.
The R-square for the first model associated with the causal relationship between the sets of exogenous latent variables, including quality of service (QS), quality of food (QF), quality of physical environment (QPE), fairness of price (FP), and brand image (BI), and the endogenous variable of customer satisfaction (CS) is 0.763. This means that 76.3 percent of the variation in CS (explained variable) can be explained from the five explanatory variables.
Additionally, the R-square for the second model related to the causal relationship between the endogenous latent variable of CS with the other endogenous latent variable of customer loyalty (CL) is 0.762. This pointed out that 76.2 percent of the variation in CL (response variable) can be explained from a predictor variable of CS. Like the output from the CFA and just reminding, the goodness-of-fit criterion of SEM was still satisfactory, which specified that the data fitted the models ( ⁄ = 2.807, RMSEA = 0.067, NFI = 0.871, IFI = 0.913, TLI = 0.903, and CFI = 0.913).
The outputs from SEM performance exhibited that the guest perceptions related to the quality of food, the fairness of price, and the brand image in the selected fast-food restaurants became the predictors of the level of delight with the overall fast-food restaurants.
Furthermore, the insignificant structural coefficients, namely the quality of service and physical environment (QS and QPE), would not be interpreted. Finally, the endogenous latent variable of guest fulfillment showed the positive relationship likewise.
Physical Environment
Satisfaction Ha(4) Fairness of
Price --> Customer
Satisfaction 0.226 0.07 3.209 0.001**
Ha(5) Brand Image --> Customer
Satisfaction 0.523 0.072 7.229 ***
Ha(6)
Customer
Satisfaction --> Customer
Loyalty 0.959 0.054 17.904 ***
(Note: Significance of unstandardized coefficients: * p < 0.050; ** p < 0.010 and *** p <
0.001)
Source: Developed by own
Figure 4: Outputs of SEM Performance
Source: Developed by own Discussion
Due to the above output, the quality of food (QF) was the main factor having a positive influence on the guest's pleasure in contrast to the quality of service. Likewise, this result was supported by the findings of Nguyen, Nguyen, & Do (2019), Hanaysha & Pech (2018) and Rana, et al. (2017), who stated that food quality had a significant positive relationship with not only the positive words of mouth but also guest delights. Moreover, Chun & Nyam-Ochir (2020), who had investigated the effects of fast-food restaurant attributes on guest pleasure, revisit intention, and recommendation, found that quality of food became the main factor and had a positive link with the consumer delights. In their research paper, the food quality construct included important indicators of tasty, fresh, variety of menu, and good portions.
Consistency with the findings of Hanaysha J. (2016), the author found that the quality of food was a key attribute that can stimulate guest pleasure in the restaurant business context.
Especially, the guests are likely to evaluate the quality of food based on necessity dimensions, namely reasonable temperature, proper freshness, variety, attractive presentation,
and taste quality. Similarly, this study combined the measurement items such as food freshness, food taste, and food presentation into food quality. Therefore, the fast-food restaurant owners or managers may take these main elements to make a betterment into a food improvement strategy to drive the consumer fulfillment. The quality of food could become one of the vital factors utilized by the guests for evaluating the value in which the restaurants had provided it to them.
Similar to the service quality, the outcomes of this study revealed that the quality of physical environment (QPE) did not have a positive influence on customer satisfaction. It could be the result of good atmospheres, which were not the necessary dimensions or needs for them to visit a restaurant. It was not supported by the literature. However, these outcomes also had the same findings of Shin & Yu (2020) who investigated factors influencing guest satisfaction in the restaurant business. They found that the physical environment quality had no significant effect on the guest’s pleasure.
According to Shamsudin, et al. (2020), they noticed that most of the restaurants had engaged an appropriate quality expert to monitor and design for business the best preparations and standard operating processes. Nowadays, almost all fast-food bussiness has their strategy and procedures although guests may see not much distinct from each other. Due to this concept, it is reasonable that the customers in Cambodia decided to choose the restaurants for dining-out based on other factors such as food quality, price fairness, and brand image rather than the quality of service and physical environment.
For the fairness of price and due to the result of statistical test, the findings of this research showed that the fairness of price was truly considered as the key predictors to stimulate the customer satisfaction. This means that price fairness had the positive influence on the guest pleasure. The outcomes were confirmed by the past literature which stated that
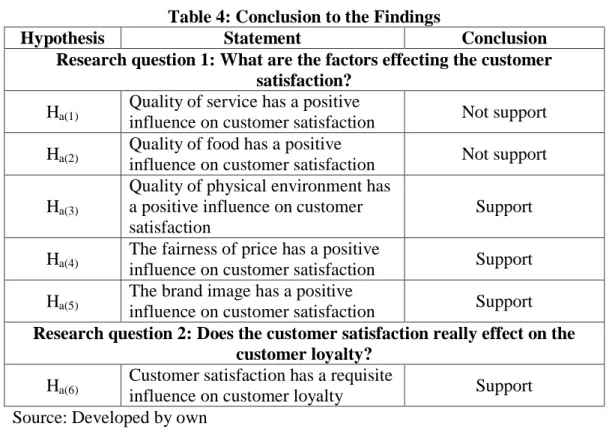
Table 4: Conclusion to the Findings
Hypothesis Statement Conclusion
Research question 1: What are the factors effecting the customer satisfaction?
Ha(1) Quality of service has a positive
influence on customer satisfaction Not support Ha(2) Quality of food has a positive
influence on customer satisfaction Not support Ha(3)
Quality of physical environment has a positive influence on customer satisfaction
Support Ha(4) The fairness of price has a positive
influence on customer satisfaction Support Ha(5) The brand image has a positive
influence on customer satisfaction Support Research question 2: Does the customer satisfaction really effect on the
customer loyalty?
Ha(6)
Customer satisfaction has a requisite
influence on customer loyalty Support Source: Developed by own
there is a positive relationship between the price fairness and guest fulfilment. This results were confirmed by many previous studies conducted by such as Hanaysha J. (2016) and Majid, Rojiei, Shafii, Ghoni, & Hassan (2021). As stated by Gajić, et al. (2013) in their research associated with the critical determinants of restaurant's quality affecting guest pleasure, price fairness was a critical component influencing visitor satisfaction. It is more important to be under the quality to escape guest's complaining, dissatisfaction, and negative word-of-mouth (WOM). They confirmed that price fairness refered to reasonable price items, good value for money and total value of experience in dining. According to Hanaysha J.
(2016), consumers were likely to make some comparisons between various brands either re- or post-purchasing in order to create well judgments about the perceived price and determine their satisfaction level. Therefore, the significance of price fairness for guests is logcal.
Additionally, The World Bank showed that GDP per capita for Cambodia equaled $1512.73 in 2020, declined from $1643.12 in 2019 (as cited in Data Commons Place Explorer, 2021).
Precisely, due to the characteristics of consumer as discussed in above part, it revealed that most of them are youths with the age of “18-35” year old representing 86.8% with average income of not bigger than $750 per month. Therefore, their dining-out at the fast-food restaurants that offered them a good food in accordance with reasonable price is critical.
Relevant to brand image (BI), the findings of this study indicated that it had a significantly positive influence on customer satisfaction. It means that brand image became one of the other vital predictors to stimulate higher pleasure for consumers in the fast-food business sector. This result also was supported in the literature reviewed by Upamannyu &
Sankpal (2014) and previous research conducted by Absah, Rini, Azmi, & Arif (2020) and Malik, Ghafoor, & Iqbal (2012). According to Tjahyadi (2006), consumers have confidence in a brand, and as a result, they will express more optimistic attitudes and behaviors to this brand. Moreover, consumers fulfilled with the brand performance will remain to buy this brand, using it and even spreading the positive word-of-mouth to others about the advantages of the brand based on their certain familiarity in the usage of the brand (as cited in Absah, et al., 2020). In addition, the brand image in this study was the most important factor, followed by the quality of food and fairness of price respectively, in predicting and causing the higher pleasure for the consumers. Hence, the fast-food business owners and managers should pay more attention and build a strong restaurant image and then include it into the priority strategies to gain more competitive advantages in the fast-food markets.
Finally, according to the outcome of statistical test, there was the significantly positive influence between the customer satisfaction (CS) and customer loyalty (CL). This result, moreover, was supported by literature suggested by Parasuraman, et al. (1988) and confirmed by many previous studies such as Abdelhamied (2013); Hair, Jr., et al. (2009); Liu & Jang (2009); Haghighi, et al. (2012); Rana, et al. (2017); Sabir, et al. (2014); Khan, et al. (2013);
Gajić, et al. (2013), Fen & Lian (2007); and Canny (2013).
Conclusion
Remind that the main purpose of this study was to investigate and examine the key determinants affecting customer satisfaction. These factors included the quality of service, quality of food, quality of the physical environment, fairness of price, and brand image. After that, the study was to assess the causal relationships between customer satisfaction and customer loyalty in the fast-food restaurant segment. Due to the covariance-based structural equation modeling (CB-SEM) methodology and outcomes from the statistical test, this study found that brand image was the most significant positive predictor to stimulate customer
satisfaction, followed by quality of food and fairness of price. Surprisingly, the quality of service and quality of physical environment were not confirmed or there were insignificant positive relationships between both the factors and customer satisfaction. In addition, the outcomes here indicated that the guest's pleasure really caused the guest's loyalty. It means that customer satisfaction had a significant positive influence on customer loyalty. Higher the fulfillment the consumers received from the restaurant, the higher loyalty the consumers would offer back to the restaurant.
It made sense for the consumers in selecting the brand image prior to dining out at any fast-food restaurant. Normally, brand image referred to the inclusive impression in clients’
minds that made from all sources. Clients develop innumerable associations with the brand.
Due to this meaning, consumers in the fast-food restaurant context really searched and then made the comprehension for any brand that could meet their needs and wants. When they received enough information about a brand, and clearly understand a brand's culture, especially reasonable quality in which a brand restaurant would embrace, they did not hesitate to choose this brand for their dining-out. Based on the profile and social habits of respondents, this study may conclude that the consumers nowadays who visited the fast-food restaurant did not tend to waste their valuable time in searching for a qualified restaurant that they never knew before or trying it by chance. In such a high-tech era, consumers may utilize peer group recommendations or online information relevant to the brand restaurant prior to visiting and testing any restaurant's products. According to the brand association and awareness, it would be easier for consumers to make a decision in purchasing a product from a restaurant that had a strong brand image. Therefore, fast-food restaurateurs should pay more attention to building a good brand image as luxurious, trendy, and well known in quality to keep the existing clients and attract new customers.
Concerning the quality of food, it was the second statistically significant attribute to measure and cause the level of satisfaction for consumers. According to its definition, the quality of food related to the food with appropriate taste, freshness, temperature, and presentation. However, in this study, the variable of food quality emphasized the food taste, food freshness, and food presentation as the indicators representing the food quality in predicting the level of customer pleasure. Consequently, consumers considered the food quality as the main reason to visit any fast-food restaurant. It was especially logical because in general people tended to need the good taste of food and other factors involved with food quality rather than service reliability, responsiveness, sympathy, good ambiance conditions, spatial layout, and so on, because these factors were set up already with a norm standard of every brand restaurant. Therefore, the reasons why the consumers would decide to visit or return a restaurant was to rely on the quality of food and restaurateurs should take more notice of this issue and then, monitor, reinforce and innovate regularly its food quality. In brief, the fast-food restaurant should serve food to its guests in a fresh and timely manner, food should have good taste, fresh ingredients should be used in preparing foods, and food should be served at the appropriate temperature. Especially, the restaurant should provide its guest with a good size of food portion that was also a part of food quality. Restauranteurs, moreover, should make sure that the characteristics of their food specifically became a core competence and had differentiation from other brands. As long as food quality was achieved, it would become one of the significant and effective strategies to stimulate more fulfillment for customers.
However, there were only the desirable features of brand image and quality of food in order to encourage the level of delights for guests. It was still not enough. Based on the study
findings, it revealed that fairness of price was the third strongest antecedence of guest fulfillment. Price fairness referred to reasonable price items, good value for money, and the total value of experience in dining. According to this concept, restaurateurs should continuously assess their pricing relative to the reputed brand image, food quality, and particularly compared to competitor's pricing. Actually, restaurateurs could not extremely ignore the reasonable-price strategy even though they had been running the business with the existing reliable or famous brand image and extractive or delicious food. As demonstrated in the last section, the average annual income of Cambodian people was in the range of lower- middle class that would affect their spending. From the economic point of view, the consumption spending of people usually based on their income. If they earned not much income, they would also pay less on a product. Hence, consumers would be sensitive to the price of a product. In this case, the price elasticity of demand would be more than one because of the effect directly by their income that made them very distressed by slight price changes. Briefly, the success factors of fast-food chains consisted of the brand image with the combination of food quality and reasonable price, and then, they would be the antecedents of guest delights.
Theoretical Contributions
Taking note that the model in this study was developed based on the literature review and mainly relied on the integration of past empirical and theoretical models, especially the modification of SERQUAL proposed by Parasuraman, et al. (1985), the model of Haghighi, et al. (2012), the conceptual framework of Canny (2013), and the model conducted by Ryu &
Han (2010), Jin, et al. (2012) as well as Malik, et al. (2012). Consequently, this study could build a suitable model in compliance with the fast-food chain context in a developing country like Cambodia, which has a different climate, demographic profile, culture, socio-economic, and purchase behavior from the regions or countries in which the previous studies were performed. Due to this reason, the model here consisted of (1) quality of service, (2) quality of food, (3) quality of physical environment, (4) fairness of price, and (5) brand image. All these dimensions were the antecedent variables of customer satisfaction in which the level of customer loyalty was influenced by the pleasure of consumer. Based on the statistical test in structural equation modeling methodology, the study found that there were three factors considered as the determinants of guest delights, including the brand image, quality of food, and fairness of price, except for the quality of service and physical environment. Then, guest fulfillment extremely had a positively significant relationship with the behavioral intention or re-patronage behavior also known as consumer loyalty. According to the outcomes, this study enormously contributed to the theoretical implications.
The findings revealed that the customer service and good physical atmosphere were not the predictors towards the guest pleasure, conversely to literature and the results from many previous studies, indicating that both factors were the key success determinants for the catering business. As demonstrated in the last parts, the insignificance of both variables would perhaps be caused by the fierce competition between brand restaurants that each brand set up already the best standards of intangibility and tangibility. Nevertheless, those still were not features that consumers most desired. Consumers here assumed the brand image, food quality, and price fairness as the most important criterias for their decision to dine out at any fast-food outlets. Then, if the outcomes of their post-purchasing in any brand met their expectations, they would revisit or spread the positive word of mouth to others.
Managerial Implication
Observation and determining of necessity factor effecting on the guest fulfillment were the main objectives of this research, besides examing the direct relationship between the delights towards loyalty. This study was a rare investigation for the fast-food restaurant segment in Cambodia. Therefore, restaurateurs, owners, or marketers can apply these main dimensions (brand image, quality of food, and fairness of price) for the priority strategies and then set them as the core success factors for business. Based on this result, restaurant managers or policy developers should monitor the existing strategies and their current performance. Based on the findings, it indicated that: though the fast-food chains were assumed to be luxurious, trendy, and well-known, the owners and managers have to regularly reinforce the brand image in compliance with the accurate food quality and reasonable price.
As discussed in the above section, food quality combined several scales of the items, namely food taste, freshness, and presentation. In short, managers should make certain that their foods have good taste and smell, foods are served in a timely and fresh manner and at an appropriate temperature, and a portion of foods has a good size. Additionally, restaurateurs should update the existing food standard particularly based on food presentation since it is involved in how the food will be prepared and presented to the guests. The presentation is viewed as a part of tangible cues. Because having good-looking and well-decorated food can stimulate the guest's perception of quality, the restaurants could also consider setting a reasonable and competitive price for their guests. It means that the price of ordered foods and overall menu must be acceptable, which guests feel their money get worth and symmetry to their planned expenditure. These strategies can also be utilized and practiced by the entrepreneurs tending towards business start-ups in the fast-food sectors.
Limitation and Further Research
Although this study has contributed noticeably towards the more in-depth comprehension of major determinants and antecedents of customer satisfaction and loyalty that the model derived substantial ideas from necessity literature review and past sturdy conceptual frameworks, there are still some limitations required to conduct further research. First, the empirical data utilized for statistical analysis in this study was gathered only in Phnom Penh and fundamentally based on the convenience sampling approach in response to the conditions of time and budget constraints. The study outcomes will reflect the reliable conclusion on the identical demographic characteristics and similar regions. Hence, since the generalization of results here is limited, collecting data from various demographic provinces (i.e., Siem Reap, Preah Sihanouk, Kampot, Kompong Cham, Poi Pet) across the country should be conducted in order to obtain the generalized findings. Second, due to the existing conceptual framework, customer satisfaction played a role as the mediator variable that should explain the relationship between all combined explanatory variables (i.e. quality of service, quality of food, quality of physical environment, fairness of price, and brand image) and explained variable (i.e., customer loyalty). This research performed only covariance-based structural equation modeling running and did not employ the method for a mediator to assess the customer satisfaction variable as complete mediation (also known as full mediator variable) or partial mediation. The findings of this study revealed that there were only three exogenous latent variables, namely brand image, food quality, and price fairness, that significantly influence endogenous latent variable of customer satisfaction construct, and customer satisfaction, in turn, influence another endogenous latent variable of customer loyalty. It was a simple hypothesized model exercised to confirm antecedent variables of guest pleasure just
in the fast-food restaurant segment. Therefore, this matter should be solved and illustrated in the future study in compliance with the mediation method to evaluate the role of guest delights as a partial or full mediation in such a model. These methods are available and popularized in mediation analysis as follows: Baron & Kenny (1986); Sobel (1982); and percentile bootstrapping. Third, further investigation should also include other variables (i.g.
gender or income) moderating the effect that the above exogenous latent variables such as brand image, quality of service, and atmosphere had on the guest delights.
Reference
Abdelhamied, H. H. (2013). The Effects of Sales Promotion on Post Promotion Behaviors and Brand Preferences in Fast Food Restaurants. Tourismos: An International Multidisciplinary Journal Of Tourism, 8(1), 93-113.
Absah, Y., Rini, E. S., Azmi, A., & Arif, C. (2020). The influence of servicescape, brand image and customer relationship management on customer satisfaction and customer loyalty at fast food in Medan City. International Journal of Advanced Science and Technology, 29(8s).
Andaleeb, S. S., & Conway, C. (2006). Customer Satisfaction in the Restaurant Industry: An Examinaiton of the Transaction-Specific Model. Journal of Service Marketing, 20(1), 3-11. doi:10.1108/08876040610646536
Andreani, F., Taniaji, T. L., & Puspitasari, N. R. (2012). The Impact of Brand Image Towards Loyalty with Satisifaction as a Mediator in McDonald's . Journal Manajemen Dan Kewirausahaan, 14(1), 64-71.
Bhakar, S., Agrawal, A. K., Sutha, B. K., Verma, S., Verma, A., Singhal, K., & Signh, P.
(2013). Impact of Service Quality, Physical Environment, Empoloyee Behavior on Consumer Perception. Prestige International Journal of Management & IT- Sanchayan, 2(2), 117-133.
Bhattacharya, S., Sengupta, P. P., & Mishra, R. (2011, August). Exploring Customer Loyalty:
A Study on Fast Food Outlets in the City of Chennai. International Journal of Multidisciplinary Research, 1(4).
Bieger, T., Engeler, I., & Laesser, C. (2010). In What Condition Is a Price Increase Perceived as Fair? An Empirical Investigation in the Cable Car industry. 20th Annual CAUTHE 2010 Conference (pp. 1-12). Hobart, Tasmania: School of Management, University of Tasmania.
Bowerman, B. L., O'Connell, R. T., & Murphree, E. S. (2009). Business Statistics in Practice (5th ed.). New York, United States of America: McGraw-Hill/Irwin.
Buttle, F. (1996). SERVQUAL: review, critique, research agenda. European Journal of Marketing, 30(1), 8-32.
Cambodia. (2021). Retrieved November 10, 2021, from Data Commons Place Explorer:
https://datacommons.org/place/country/KHM
Campbell, D. T., & Fiske, D. W. (1959, March). Covergent and Discriminant Validation by the Multitrait-Multimethod Matrix. Psychological Bulletin, 56(2).
Canny, I. U. (2013, November 27). The Role of Food Quality, Service Quality, and Physical Enviroment on Customer Satisfaction and Future Behavioral Intentions in Casual Dining Restaurant. Konferensi Nasional Riset Managemen, 7.
Chien-Hsiung, L. (2011, September 6). A Study on the relations between the brand image and customer satisfaction in catering businesses. African Journal of Business Management, 5(18), 7732-7739.
Chun, S.-H., & Nyam-Ochir, A. (2020, September 10). The effects of fast-food restaurant attributes on customer satisfaction, revisit intention, and recommendation using DINESERV Scale. Sustainability.
Chung, J. Y., Kyle, G. T., Petrick, J. F., & Absher, J. D. (2011). Fairness of prices, user fee policy and willingness to pay among visitors to a national forest. Tourism Management, 32, 1038-1046.
Costa, A. d. (2003). New Insights into Consumer-Oriented Food Product Design. Retrieved
July 15, 2015, from Ph.D. Thesis Wageningen:
http://icm.clsbe.lisboa.ucp.pt/docentes/url/anacosta/livro/Costa2003.pdf
Dai, H. (2009). Service Convenience, Service Consumption Experience, and Relational Exchange In Electronic Mediated Environment (EME). The Doctoral Dissertation, 1-204.
Dragan, D., & Topolšek, D. (2014). Introduction to Structural Equation Modeling: Review, Methodology and Practical Applications. The International Conference on Logistics & Sustainable Transport 2014. Celje.
Erdawati, Darwis, D., Rachmat, I. F., & Karim, A. (2021). The effectiveness of green chemistry practicum training based on experimental inquiry to improve teachers’
science process skills. Elementary Education Online, 20(4), 540–549.
https://doi.org/10.17051/ilkonline.2021.04.58
Fanning, J., Marsh, T., & Stiegert, K. (2005, January). Determinants of Fast Food Consumption. Working Paper Series: FSWP2005-02.
Fen, Y. S., & Lian, K. M. (2007). Service Quality and Customer Satisfaction: Antecedents of Customer's Re-Patronage Intentions. Sunway Academic Journal, 4.
Gajić, S., Tešanović, D., & Jovičić, A. (2013). The Vital Components of Restaurant Quality that Affect Guest Satisfaction. TURIZAM, 17(4), 166-176.
Glen, S. (2019, May 16). Composite Reliability: Definition. doi:
https://www.statisticshowto.com/composite-reliability-definition/
Haghighi, M., Dorosti, A., Rahnama, A., & Hoseinpour, A. (2012, April 11). Evalustion of factors affecting customer loyalty in the restaurant industry. African Journal of Business Management, 6(14), 5039-5046.
Hair, J. F., Risher, J. J., Sarstedt, M., & Ringle, C. M. (2019, Janaury 14). When to use and how to report the results of PLS-SEM. European Business Review, 31(1).
Hair, Jr., J. F., Bush, R. P., & Ortinau, D. J. (2009). Marketing Research (In a Digital Information Environment) (4th ed.). New York, United States of America:
McGraw-Hill/Irwin.
Hanaysha, J. (2016). Testing the effects of food quality, price fairness, and physical environment on customer satisfaction in fast food restaurant industry. Journal of Asian Business Strategy, VI(2).
Hanaysha, R. J., & Pech, J. R. (2018). Brand Prestige and the Mediating Role of Word of Mouth in Fast Food Industry. Global Business Review, 19(6), 1494-1514.
Henseler, J., Ringle, C. M., & Sarstedt, M. (2015). A new criterion for assessing discriminant validity. J. of the Acad. Mark. Sci., 43.
Howard, J. A., & Sheth, J. N. (1969). A Theory of Buyer Behavior. Journal of the American Statistical Association, 467-487.