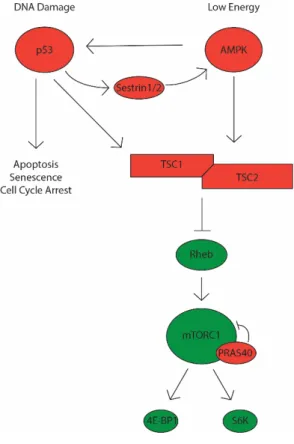
Nodules can be found in any lobe of the cortex, subcortical white matter, or cerebellum. There is also evidence of neuropathological abnormalities outside of the hamartomatous growths in the brain. Although TBC1D7 binds to the tuberin/hamartin complex and loss of function results in increased mTORC1 signaling, mutations in the TBC1D7 gene do not cause tuberous sclerosis complex (Dibble et al 2012).
Not surprisingly, many missense mutations occurred in the GAP domain (exon 34-38), likely impairing Rheb regulation (Jones et al 1999, Niida et al 2001, Sancak et al 2005). Homozygous loss of tuberin or hamartin disrupts this important regulatory hub, resulting in constitutively active mTORC1 signaling regardless of inhibitory or stimulatory signals. Many ribosomal proteins, including S6, are imported from the cytoplasm to associate with nascent ribosomal RNAs in the nucleolus (Reviewed in (Meyuhas 2015)).
This phenotype is consistent with findings from TSC2 or TSC1 knock-out Drosophila, where loss of the negative regulators hamartin or tuberin results in enlarged cells (Tapon et al 2001). Despite the fact that S6 is a critical component of the 40S ribosomal subunit, loss of S6 phosphorylation does not alter global protein synthesis (Chauvin et al 2014, Garelick et al 2013, Mieulet et al 2007, Ruvinsky et al 2005). Comparison of Tsc2-null renal cell carcinoma tissue in the Eker mouse with TSC2-null renal angiomyolipoma tissue in TSC patients reveals divergent signaling pathways.
Although the current model in the field focuses on excessive mTORC1 activity as the critical mediator of neurological symptoms, it is not known how.
HETEROZYGOUS LOSS OF TSC2 ALTERS P53 SIGNALING AND HUMAN STEM CELL REPROGRAMMING
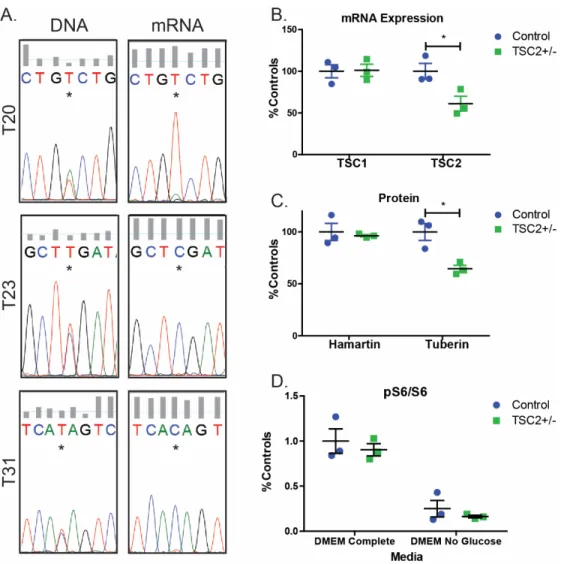
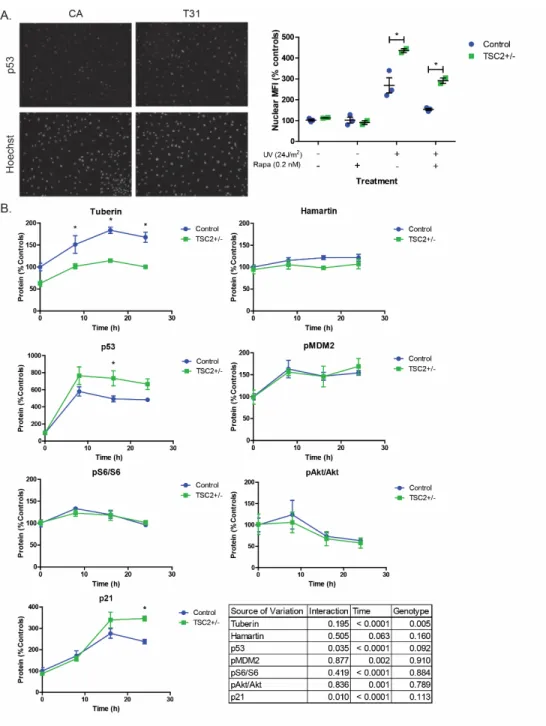
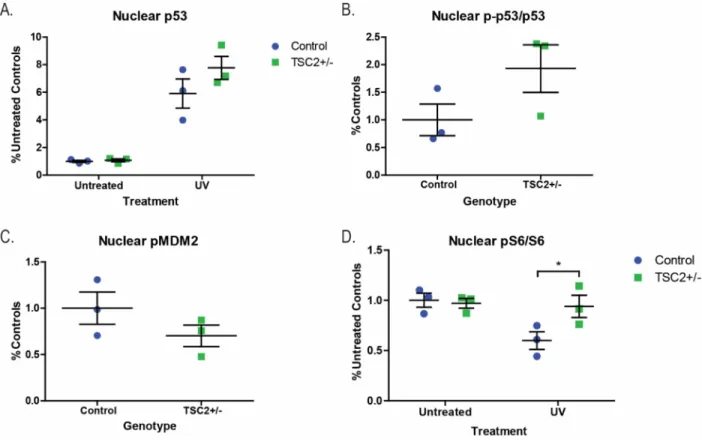
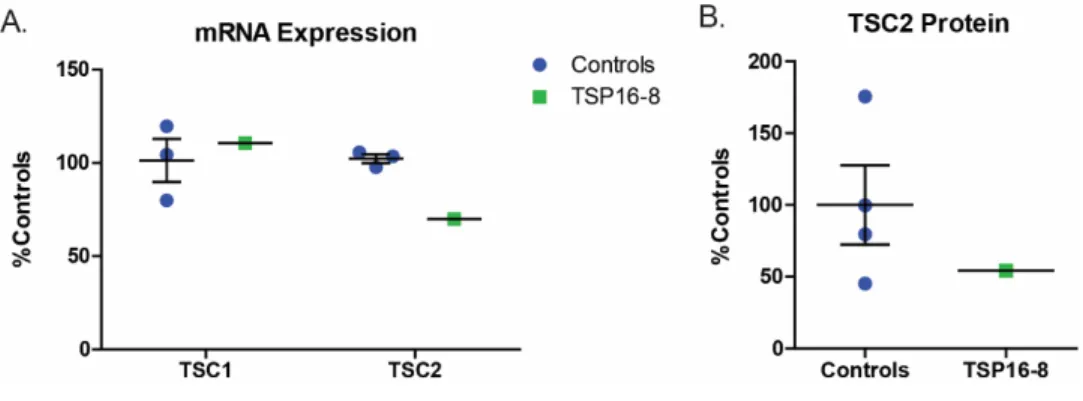
Consistent with these sequencing results, TSC2 mRNA levels and tuberin protein expression in TSC2 heterozygous mutant fibroblast lines were both reduced by approximately half compared to control fibroblasts (Figure 2.1B-C, p=0.039 and p=0.016). We did not observe increased mTORC1 activity in fibroblasts with or without nutrient starvation (Figure 2.1D). Treatment with rapamycin at concentrations close to the IC50 (0.2 nM) reduced nuclear p53 levels in both control and TSP cells (Figure 2.4A, p=0.008).
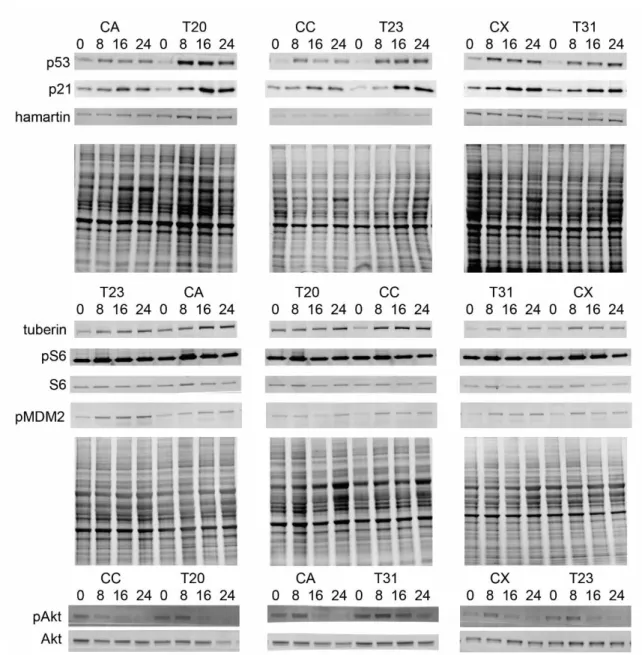
Tuberin protein levels were also significantly increased in response to UV, consistent with previous studies (Figure 2.4B, p<0.0001, time) (Feng et al 2005, Feng et al 2007). p21 levels increased post-UV challenge and TSP lines showed increased p21 relative to controls (Figure 2.4B, p=0.01). No differences were observed in the levels of pMDM2Ser166 and it was appropriately up-regulated in response to increased p53 levels in both controls and TSP lines (Figure 2.4B).
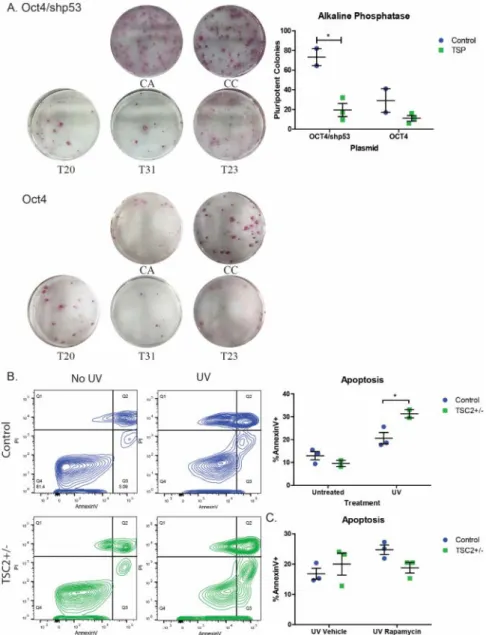
Reprogramming efficiency was significantly reduced in TSC2 heterozygous mutant fibroblasts compared to controls reprogrammed with shTP53 (Figure 2.6A, p=0.015). However, there was no significant difference between reprogramming efficiency of TSC2+/- fibroblasts with or without the shTP53 cassette (Figure 2.6A). We found a significant increase in the percentage of Annexin V positive apoptotic cells in TSP fibroblast lines (Figure 2.6B, p<0.05).
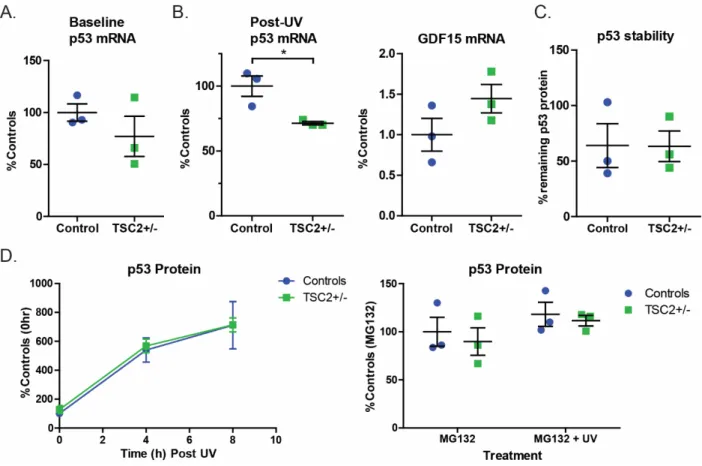
We first measured TP53 mRNA levels and found no increase in TP53 mRNA at baseline (Figure 2.7A). There was no difference in the relative protein remaining after treatment, supporting a similar degradation rate of p53 protein in control and TSP fibroblasts (Figure 2.7C). To test whether p53 transcription/translation was increased at baseline in TSC2+/- cells, we treated patient and control fibroblasts with MG132 for 6 hours without UV challenge and found no difference (Figure 2.7D).
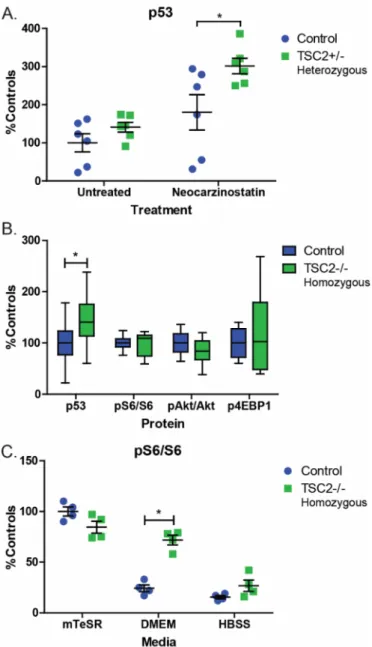
There was a significant increase in p53 protein levels in cells challenged with UV light and MG132 compared to MG132 alone, suggesting that MG132 treatment alone does not result in a ceiling effect (Figure 2.7D p= 0.02). However, by 8 hours after UV challenge, the difference between controls and TSC2+/- cells was not significant (Figure 2.4B). At baseline, p53 was significantly increased in TSC2 homozygous mutant iPSCs compared to isogenic control lines (Figure 2.8B, p=0.03).
We again measured p53 stability upon cycloheximide treatment, but found no difference between isogenic controls and TSC2 homozygous iPSC lines (Figure 2.9A). Treatment with the protease inhibitor MG132 to isolate the contribution of transcription and translation to the p53 phenotype also did not reveal a difference between isogenic controls and TSC2 homozygous iPSC lines (Figure 2.9B).
STEM CELL DYNAMICS AND SIGNALING IN PLASMID-INTEGRATED TSC2+/- IPSCS
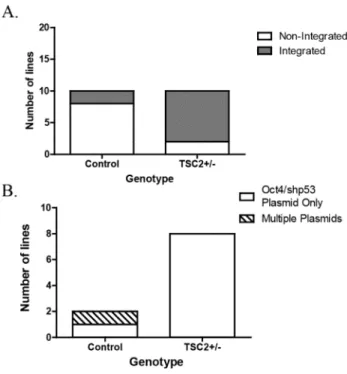
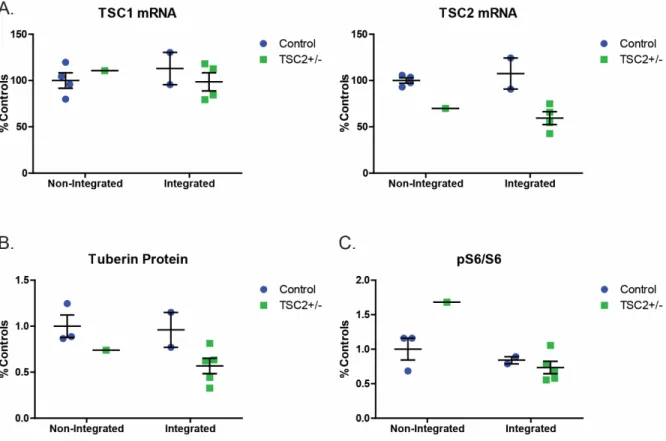
We observed a significant decrease in TSC2 mRNA, however, the reduction in tuberin protein in integrated TSC2+/- iPSCs did not reach significance (Figure 3.1A p=0.004, 3.1B, p=0.06). All but one (T8-22) of the integrated iPSC lines had decreased p53 protein levels compared to non-integrated controls, suggesting that the shRNA is still expressed in the integrated iPSC lines. Unlike integrated plasmid-reprogrammed TSP iPSCs, baseline p53 protein levels were unchanged in Sendai-reprogrammed TSP iPSCs (Figure 3.2B and Chapter II Figure 2.8A).
-reprogrammed iPSCs also had reduced tuberin protein but no change in mTORC1 activity (Figure 3.3A-B). This supports the hypothesis that it is integration of the OCT4/shp53 plasmid that causes reduced p53 protein in iPSCs. In contrast, the integrated heterozygous TSP iPSCs had significantly lower percentages of pluripotent stem cells compared to non-integrated controls (Figure 3.4 p=0.02).
This suggests that the increase in spontaneous differentiation seen in integrated TSP iPSCs is a consequence of the combination of decreased p53 and decreased tuberin. Integrated TSC patient lines survived single-cell passage on average 379% more cells compared to controls (Figure 3.6A, p=0.035). Integrated TSC2+/- iPSCs increased cell numbers over four days and decreased cell doubling time compared to controls (Figure 3.6B, p=0.008).
The next day, cells were stained with Annexin V and Propidium Iodide to detect apoptotic and dead cells, respectively (Figure 3.6C). Although not significant, integrated heterozygous TSC2+/- cells had a small increase in Propidium Iodide negative (viable and early apoptotic) cells compared to controls (Figure 3.6C p=0.318), so we cannot exclude the possibility that increased cell survival in single-cell suspension contributes to the phenotype. An increase in the mean fluorescent signal of phospho-ERK1/2 was confirmed in two of the three TSP lines (Figure 3.7B).
We wondered whether continued expression of the shRNA for p53 would alter TSC2 mRNA or tuberin protein levels. However, we showed that integration of the OCT4/shp53 plasmid does not alter tuberin protein or mRNA expression; heterozygous TSC2+/- stem cells have similarly reduced TSC2 protein in both the integrated plasmid-reprogrammed lines and the Sendai-reprogrammed lines. During routine maintenance of the integrated TSP stem cells, we observed increased spontaneous differentiation and increased cell number after single cell passage.
HOMOZYGOUS LOSS OF TSC2 CAUSES IMPAIRED MTOR REGULATION DURING NEURODEVELOPMENT
To determine how heterozygous loss of TSC2 alters early neural differentiation, we differentiated the nonintegrated control and the integrated TSC line TSP16-11 to neural progenitors. Stem cells were differentiated into neural progenitors using the SMAD double inhibition protocol in fixed cultures (neural differentiation protocol. #1) for 7 days. Cells isolated from day 0, day 3, day 5 and day 7 of neuronal differentiation were analyzed by flow cytometry.
The abrupt transition from pluripotency to neural differentiation involves a switch in transcriptional programs that likely leads to increased cellular proteins. Defective formation of neural progenitors in the integrated TSC iPSC line TSP16-11, the CA6 control line, and the TSC line TSP16-11 were differentiated into neural progenitors using dual SMAD inhibition in adherent cultures. In contrast, homozygous TSC2-/- cells have lower levels of Pax6 protein, peaking at approximately 60% of controls (Figure 4.5A, Figure 4.6).
Although p53 levels were initially increased in homozygous TSC2 cells, consistent with what was previously observed, both wild-type and TSC2 mutant cells increased p53 to similar levels during neural differentiation. Rapamycin corrected abnormalities in mTORC1 and mTORC2 signaling in homozygous TSC2-/- cells at day 7 of differentiation (Figure 4.9A-B). Alternatively, based on the results in Chapter II, spontaneous differentiation of T16-11, before neuronal induction even began, impaired the efficiency of neuronal differentiation.
However, the formation of neural progenitors was also inhibited in TSC2 isogenic homozygous lines supporting altered neural. Surprisingly, inhibition of mTORC1 activity with rapamycin failed to rescue neural progenitor formation at day 7 in either heterozygous or homozygous TSC lines. However, in both experiments, rapamycin appeared to slightly inhibit the formation of neural progenitors even in controls.
Given these results, the dominant effect of rapamycin during neural differentiation is likely a delayed proliferation, pointing to the need for different or more precisely timed treatments. Although different neural differentiation methods and different TSC stem cell lines were used, the results between both experiments were consistent. Furthermore, using heterozygous and homozygous TSC2 iPSCs, we can begin to model loss of heterozygosity and non-cell autonomous mechanisms of neural dysfunction.
PATHOGENESIS AND TREATMENT OF TSC
Mammalian target of rapamycin inhibitors for intractable epilepsy and subependymal giant cell astrocytomas in tuberous sclerosis complex. Expression profiling in tuberous sclerosis complex (TSC) knockout mouse astrocytes to characterize human TSC brain pathology. Cardiovascular manifestations of tuberous sclerosis complex and summary of the revised diagnostic criteria and surveillance and.
Identification of the tuberous sclerosis complex-2 tumor suppressor gene product tuberin as a target of the phosphoinositide 3-kinase/akt pathway. Loss of white matter microstructural integrity is associated with adverse neurologic outcome in tuberous sclerosis complex. TSC1 and TSC2 gene mutations and their implications for the treatment of tuberous sclerosis complex: a review.
Loss of Tsc2 in radial glia models the brain pathology of tuberous sclerosis complex in the mouse.