Salzberg's group followed a very similar strategy using dye uptake on microcultures of Aplysia neurons (Parsons et al., 1989). This thesis work represents an exploration of the capabilities of the voltage-sensitive dye recording technique.
SUMMARY OF RESULTS
In summary, the technical goals for dye recording from microcultures are firstly to detect action potentials, and secondly to detect subthreshold synaptic potentials. However, SCG microcultures have very complex anatomy, with axons running throughout, and dye signals from the axons make it impossible to reliably detect synaptic potentials.
THESIS OUTLINE
Acute dye uptake experiments were performed with 24 microcultures; this chapter presents examples of surveys made from two of these, and summarizes the results of the others. It then discusses the utility of dye recording for synaptic mapping in light of these results.
CHAPTER 1 REFERENCES
INTRODUCTION
Dyes have been used in many different ways and there is much about them that is not understood. As there have been many recent reviews on color recording, I have only tried to cover the more basic aspects in this chapter.
A DYE-RECORDING PRIMER
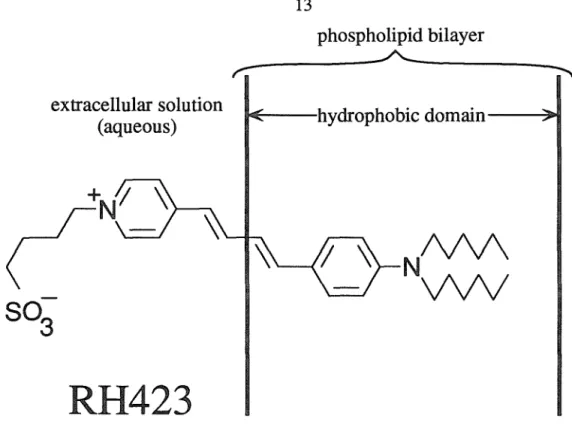
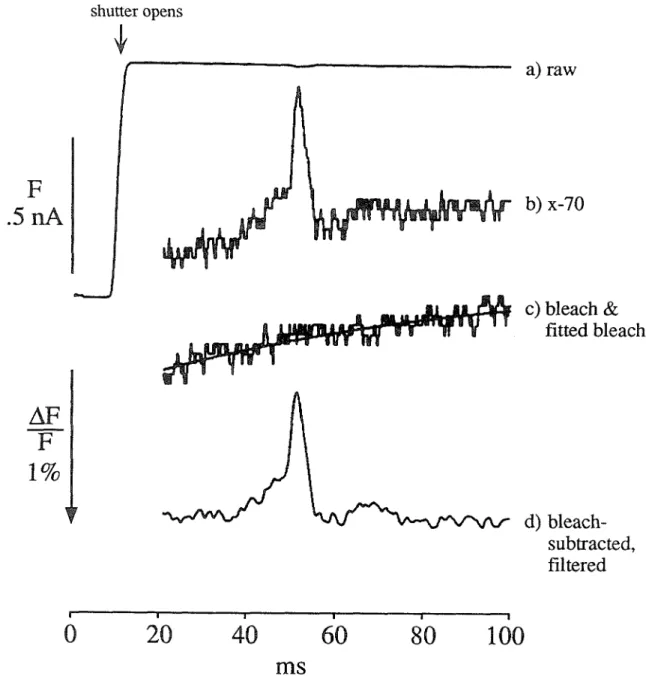
The position of the dye within the membrane is not intended to be exact, only suggestive. Trace b shows an overall upward trend, due to photobleaching of the dye (remember that this trace is inverted, so an upward deflection is a decrease in fluorescence).

HISTORY
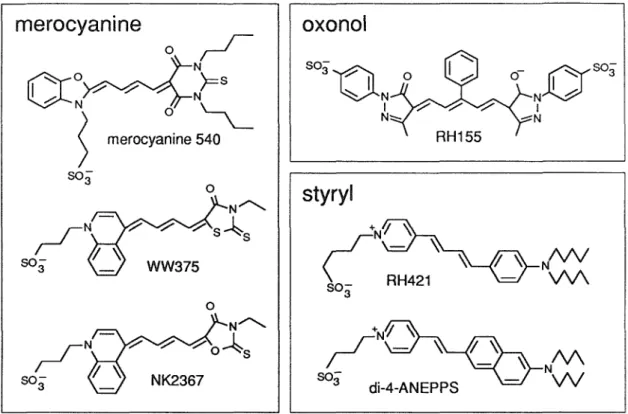
It was soon discovered (Cohen et al., 1974) that dye responses fell into two classes: fast (response time of microseconds) and slow (response time of seconds or slower). Merocyanine 540, the best dye found in Cohen et al. 1974) review, is described above.
CHAPTER 2 REFERENCES
INTRODUCTION
This expression can be divided into a biophysical factor, the dye sensitivity zero, and an instrumental factor, /firms. The first is described in Chapter 4; the last, in this chapter. Strictly speaking, filters are part of the microscope, but these experiments fit more naturally with the dye biophysics of Chapter 6.).
NOISE THEORY
Since the quantum efficiency of the photodetector (the fraction of photons that are successfully transduced) is always less than unity, the limiting shot noise is actually not in the light signal, but in the photocurrent: there are fewer electrons than photons1. Shot noise is caused by the inherent statistical fluctuations in the photocurrent, and is therefore independent of details in the electronics.

HISTORY
Salzberg and colleagues (Salzberg et al., 1977), who recorded from many cells at once in a ganglion, introduced the use of multiple detectors. Early amplifiers removed the resting level upon AC coupling with time constants of 100 ms or more (e.g., Cohen et al., 1974).
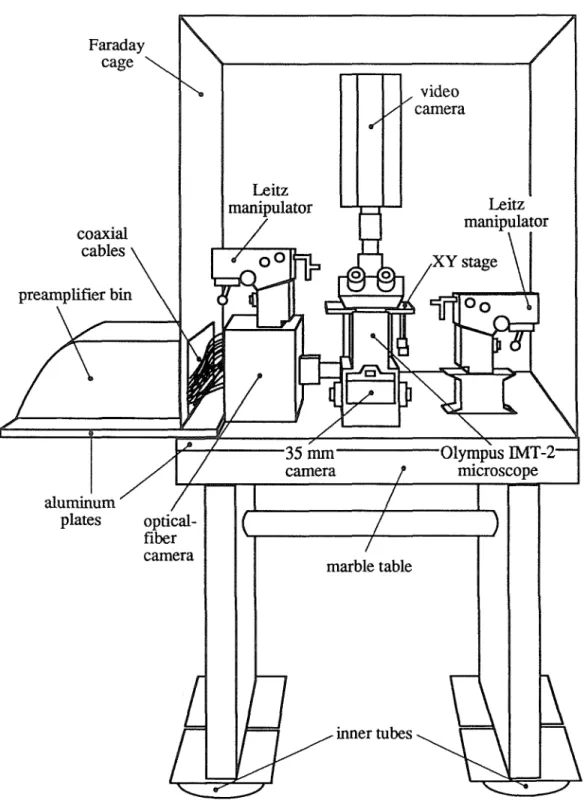
SUMMARY OF APPARATUS
The quietest of the amplifiers discussed here are at the Johnson noise limit for 6 in the feedback resistors, a limit that is equivalent to shot noise at a photo current of about 10 pA (very faint indeed). Luminance noise is slightly below shot noise at high frequencies, although occasional slow fluctuations should be eliminated by rejecting spoiled samples.
CHAPTER 3 REFERENCES
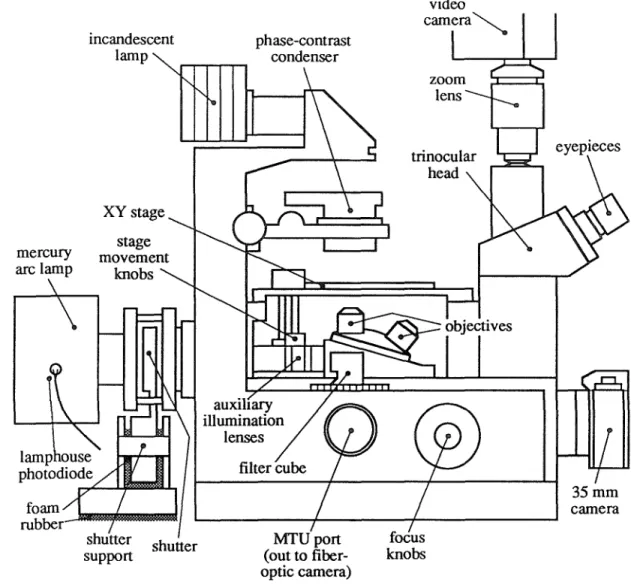
MICROSCOPE
The lighting intensity depends on the brightness of the light source, the lighting optics and the condenser lens. The microscope is focused on a mirror and the optical fiber bundle is illuminated from behind to produce a reflected image of the fibers. Such light pulses can be used to measure the temporal responses of the optical detector preamplifiers (the responses of which are on the order of milliseconds).
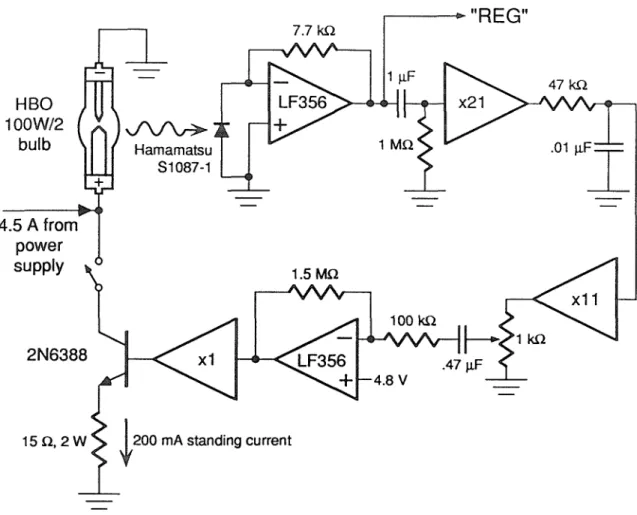
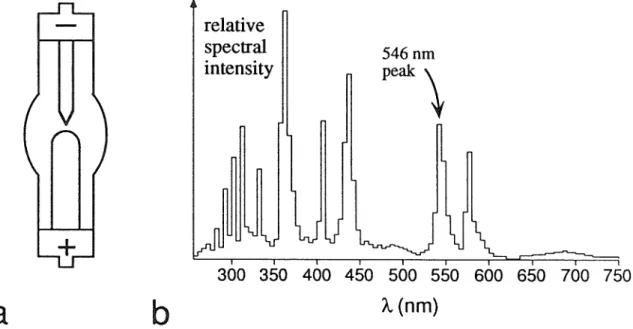
LIGHT SOURCE
The following subsections describe the characteristics of the mercury arc lamp used here (subsection 4.2.2), the optical feedback circuit used to reduce its fluctuations. subsection 4.2.3), software methods that compensate for fluctuations (subsection 4.2.4),. If the intensity fluctuations can be measured independently of the fluorescence signals, they can be corrected in software. REG is not a good measure of the illumination intensity at the sample, since the lamp housing photodiode does not directly sample the light going to the sample (that is.
CHAPTER 4 REFERENCES
OPTICAL DETECTOR
The next three subsections are devoted to the design and performance of the detector electronics. Optical fibers fill the role of the lens (imaging element) in a conventional camera, while photodiodes replace the grains in a photographic emulsion (photodetectors). A better arrangement would be to have the -18 and +18V shelf supply and use a pair of voltage regulators on each card to generate -15 and +15V. The +5 and +12V analog supplies are already individually adjusted for each care!.).

DATA ACQUISITION AND ANALYSIS
The image capture table further reduces this field of view: OPTIK can only display a portion of the video image at any time, and this window is 530 µm wide and 450 µm high. These SCOPE files are used by all the display and analysis programs described in the next subsection. The programs listed as "written in QuickBASIC" in the table are all written in Microsoft QuickBASIC v4.0 and constitute Revision 2.60 of SCOPE UTILITIES.
INTRODUCTION
The experiments described in section 6.4 tested how staining is affected by serum contained in the bath medium. The experiments in Section 6.6 checked the linearity of the response of RH423 with respect to membrane voltage using isolated neurons without processes. These experiments with isolated neurons also served to test the idea that variations in M/F may be due to varying background staining.
MATERIALS AND METHODS
Cultures were maintained at 37°C in a 5% C(h) atmosphere, and fed every two or three days by replacing 1 ml of the volume with fresh medium. Most of the experiments described in this chapter and other vessels used coated with poly lysine and laminin The central wells of the dishes were then coated with laminin by filling them with 10–20 μg/ml laminin (Sigma) in DPBS and allowing this solution to stand for at least 45 min.
EARLY DYE SCREENING
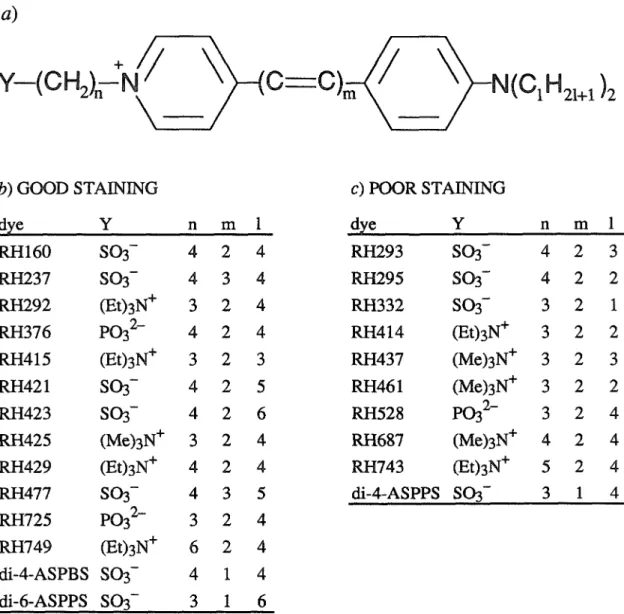
The dyes in the table are roughly grouped into dyes that stained well and dyes that stained poorly, based on staining criteria 1 through 4. Dyes whose tails had 3 or fewer carbon atoms almost always stained poorly, while dyes whose tails had 4 or more carbon atoms, carbons usually colored well. The next round of screening tested the voltage sensitivity of all dyes that stained well (except di-4-ASPBS and di-6-ASPPS), and of some dyes that stained poorly.
STAINING EXPERIMENTS
This decline is not due to bleaching, as the dish was carefully kept in the dark; apparently, the serum took dye from the cells, reducing their fluorescence. This measurement indicates that the serum-containing medium removes the dye bound to the cells; what happens if no serum is added. Intracellular staining is quite undesirable for dye recording, and so for long-term experiments requiring repeated dye recording on consecutive days, the best policy is to use serum-containing medium to decolorize each culture after each recording session, and then keep it with fresh paint. for the next session.
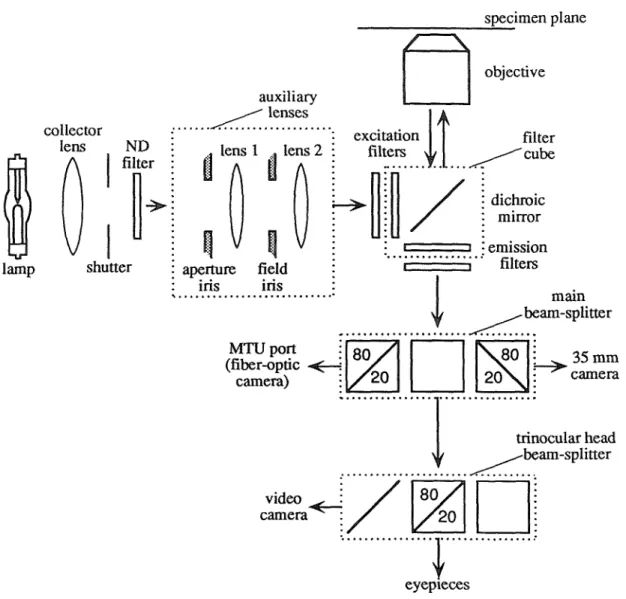
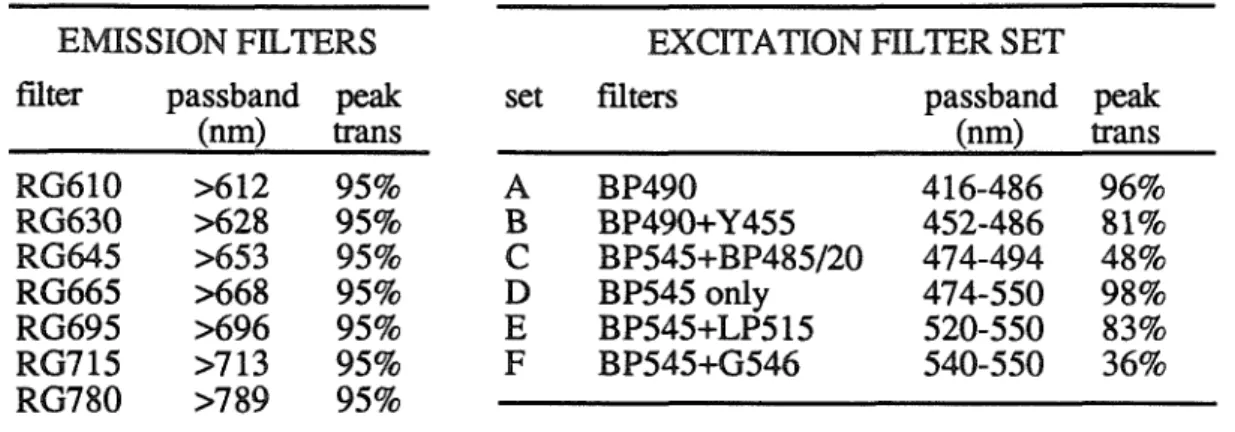
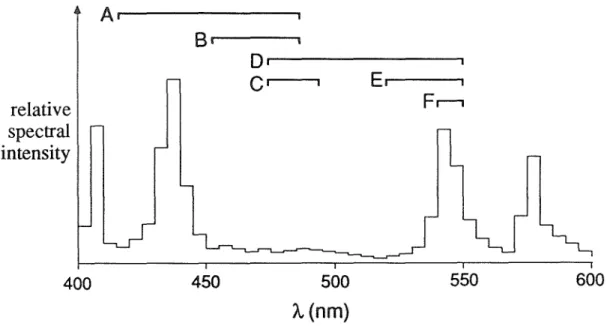
FILTERS
The figure also shows the passbands of the six sets of excitation filters (see Table 6.1). The dichroic mirror and the emission filter of the cube form a long-pass filter of 610 nm, the additional emission filters were simple long-pass filters whose cut-off wavelengths (see Table A.1) varied from 610 nm (RG610) to 780 nm (RG780). The results from another cell stained with RH237 and several other cells stained with RH423 and di-4-ANEPPS were more variable, but essentially similar: M'IF was independent of the emission filter used.
LINEARITY
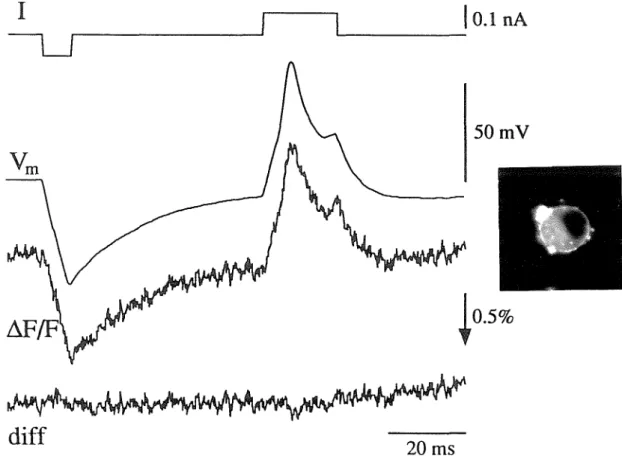
These two signals can differ, since the cell's dendrites and axons are often at different potentials from the cell body and can be included in the pixel. After making a gigohm seal on a cell with a patch pipette, the patch was broken with pressure, and the cell was stimulated in whole-cell current clamp. A least-squares fit of these two curves gives a voltage sensitivity of 1.89%/100 mV, and the bottom trace in Fig 6.4 shows a difference plot calculated by multiplying the voltage trace by 1. subtracting it from the fluorescence trace pull.
BLEACHING AND PHOTOTOXICITY
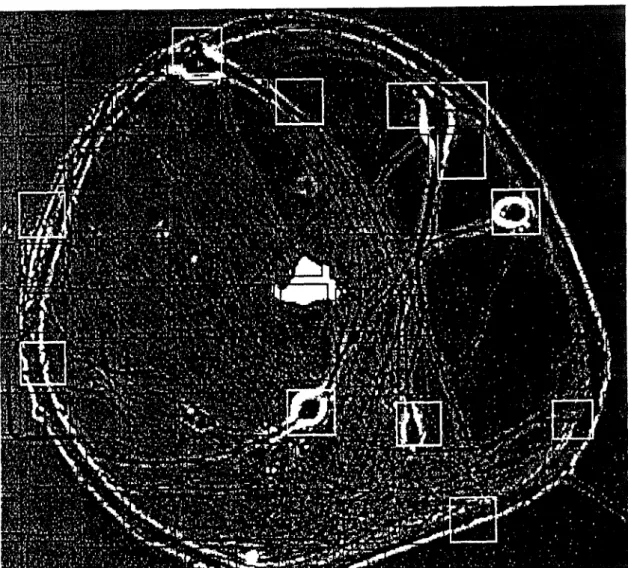
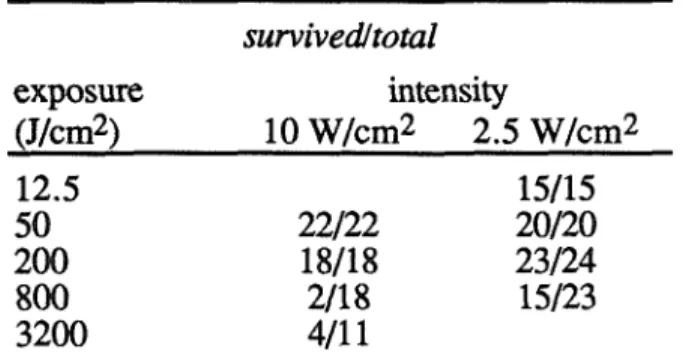
Anecdotal observations during dye recording experiments suggested that for normal staining with RH421 or RH423, using filter set E at a standard illumination intensity of 10 W/cm2, somewhere between 10 and 30 seconds of illumination, caused deterioration of the electrophysiological properties of the cells. The cells in each square were illuminated for or 320 seconds, either with full illumination (here assumed to be 10 W/cm2) or through a neutral-density filter for one-quarter illumination (2.5 W/cm2). Some of the exposed cells appeared to become diseased without dying, making them difficult to score in phase contrast.
DISCUSSION
The grid dish phototoxicity test (Section 6.7) could be used to test the phototoxicity of RH237, RH421 and di-4-ANEPPS; if one of these has much less phototoxicity than RH423, it would be better, since all four dyes have roughly similar voltage sensitivities. These damage control mechanisms may be able to handle occasional brief flashes where continuous exposure would override them. This anecdotal result is reminiscent of Bonhoeffer and Staiger's claim and would be interesting to replicate and expand upon.
CHAPTER 6 REFERENCES
INTRODUCTION
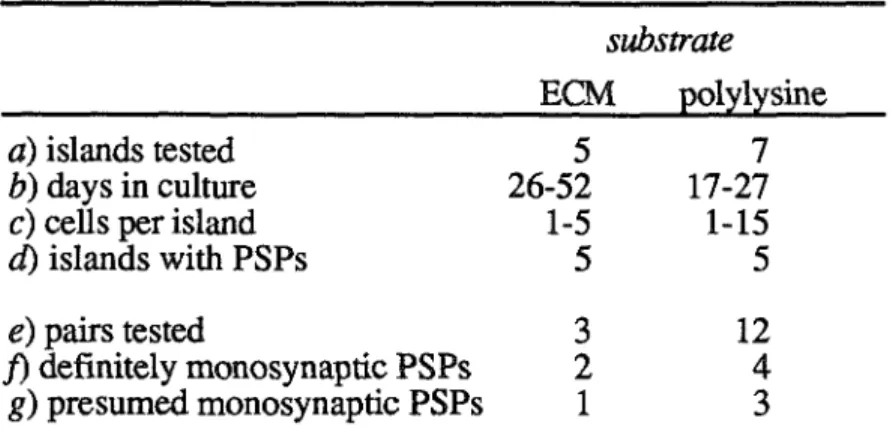
The detection limits of dye recordings were studied in microcultures by recording dye signals from cell bodies and neurites while single neurons or pairs of neurons. When recording dye signals from cell bodies, AP detection was routine, but PSP detection was not. Because the RH423 dye signal is intrinsically linear with respect to membrane potential (Section 6.6), these differences appear to be due to dye signals from APs propagating in axons, obscuring dye signals from cell bodies.
MATERIALS AND METHODS
For the single-cell culture, dye signals were recorded from the cell's soma and neurites (presumed dendrites and axons): the propagating AP was visible in all pixels monitored. Such signals from processes are undesirable for synaptic mapping: if a process crosses the cell body, its signal will contribute to and distort the cell body signal. This culture was strongly connected, and its suprathreshold synaptic potentials were easily detected with dye recording.
MICROCULTURE METHODS
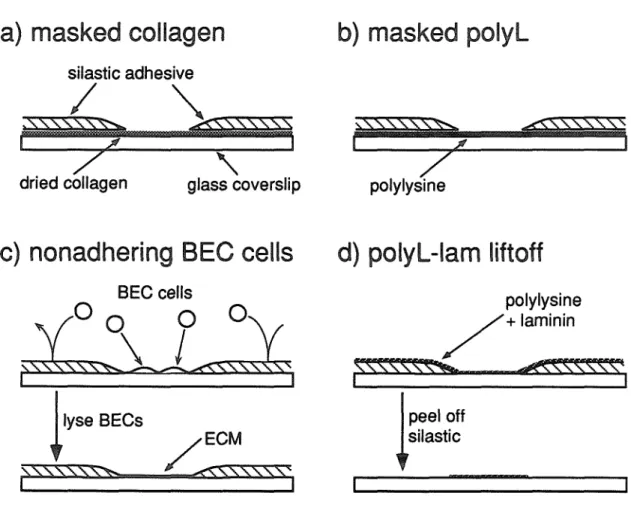
For the masked-collagen and masked-poly-lysine methods, the silastic is applied to a coverslip that is already covered with substrate molecules; for the non-adherent-BEC cells and polylysine-laminin lift-off processes, the silastic is applied to a plain coverslip and the substrate added afterwards. Instead, the silastic pattern is applied directly to the polyimide-coated coverslip on which the BEC cells are grown, and BEC cells are plated on top of the silastic. The silastic is applied to a bare glass coverslip, the coverslip is coated with polylysine and laminin, then the silastic is simply peeled off with forceps1, leaving islands of polylysine-laminin.
INTRACELLULAR PHYSIOLOGY
The panels show responses to cell stimulation before, during and after application of 100 µM hexamethonium. In the five-cell experiment of the last subsection, PSPs could not be optically detected at the cell bodies because they were obscured by signals from propagating APs. Optical signals (6.FIF, filtered and bleach subtracted) are shown from two pixels above the soma of cell 3. Pixel 3R had photocurrent F = 0.75 nA; 3L had F=0.58 nA. The scale bars apply to all three panels.
DISCUSSION
The cell body must of course have a membrane potential equal to that measured by the intracellular electrode. Hyperpolarization of the cell body should have no effect on the axon, except in segments very close to the cell body. In experiments where the cell body was hyperpolarized, pixels above thin neurites showed no signal.
CHAPTER 7 REFERENCES
SUMMARY
Good system design is especially important for a dye recording device: since the desired signals are usually quite close to the noise, it is important not to add additional signals. An extensive series of experiments found the best conditions for dye absorption with an optimal signal-to-noise ratio. Once the device and dye recording conditions were developed, they were used to record dye signals from marine microcultures while stimulating individual neurons intracellularly.
FUTURE TECHNICAL IMPROVEMENTS
Increasing the illumination intensity is not necessary (it would increase phototoxicity to undesirable levels), but a more stable light source would be useful. A fiber optic camera with separate photodiodes has three advantages over an array of photodiodes: the number of pixels can be increased more easily, making electrical connections to the photodiode leads easier, and since any photodiode can be used, the photodiodes can be chosen for low noise and low capacitance. Although a fiber optic camera was the optimal solution when this detector was designed, it could soon be overtaken by large photodiode arrays or fast charge devices.
FUTURE MICRO CULTURE EXPERIMENTS