He pioneered the theoretical side of the exploration of neural coding in the electric fish, and all the work described here constitutes his legacy. None of the work described in these pages would have been possible without the painstaking and rigorous work of Walter Metzner and Rüdiger Krahe.
What is a neuronal code?
Organization of the Thesis
In Chapter 2, I will describe our explorations of the robustness and variability of the neural code through primary amplitude-coding sensory afferents. In Chapter 3 I will describe our study of the characterization of stimulus reconstruction and feature extraction by pairs of pyramidal cells recorded using two electrodes.
Brief history of inquires into neural coding
Hartline independently made similar observations when studying the responses of individual neurons in the compound eyes of the horseshoe crab. At the time of writing this dissertation, several aspects of the coding mechanism are still the subject of ongoing and interesting debate.
Eigenmannia as a model
The presence of an object in the water near the fish affects the amplitude and phase of the signal. Electric fish have taken a dominant role in the nocturnal waters of the tropics by exploiting electrical signals.
Introduction to some of the methods
- Stimulus
- Electrophysiological recordings
- Stimulus reconstruction
- Feature extraction
- Bursting
For most of the experiments to be described here, s(t) was a random, zero-mean signal with a flat power spectrum (white noise) up to a certain cutoff frequency (fc) and. 10 Previous work done by Fabrizio Gabbiani compared the performance of the Euclidean and Fisher classifiers (Metzner et al., 1998).
What would it mean to understand the neuronal code?
We will argue that we now have a relatively good understanding of the first phase of transferring the stimulus from the environment to the spike train of the sensory afferents. The stimulus can be estimated quite accurately given the spike train and we built a model that can predict the coding, variability and robustness of the neuronal responses.
Figure legends
The stimulus had a cut-off frequency of 5 Hz. c) Two second stimulus sample. d) The estimated stimulus (dashed line) is superimposed on the original stimulus (solid line) during the same 2-s period shown in (c). e) Ten-second segment illustrating the stimulus (solid line) and its rating (dashed line). An example of a linear feature extraction algorithm using the Euclidean classifier (Metzner et al., 1998). a) A brief example of a stimulus and spike train, showing some 100 ms pre-spike stimulus segments (grey shaded boxes) and some pre-spike stimulus segments (white dashed boxes).
Overview
Our results were summarized in a phenomenological model of P-receptor afferents, including both their linear transfer properties and the variability of their spike trains. Because of their relatively high precision with respect to the EOD cycle frequency, P-receptor afferent spike trains possess the necessary temporal resolution to support coincidence detection operations at the next stage in the amplitude coding pathway.
Introduction
They therefore transmit information about amplitude changes of the electric field to higher order neurons in the brain. In contrast, variability in the timing pathway was characterized in considerable detail, revealing the high accuracy of neurons in encoding phase shifts of the EOD.
Methods
- Preparation and electrophysiology
- Stimulation
- Characterization of spike train variability
- Stimulus estimation
- Robustness of RAM encoding to spike time jitter, and random spike additions
- Modeling of P-receptor afferent spike trains
If nβ ≠0 and/or 0nγ ≠, the distance the remaining spikes move nα is smaller on average to compensate for the extra cost incurred by adding and deleting spikes (see Eqs. 2.4 and 2.5; the term in parentheses in of equation 2.5 will be < 1). The random threshold properties of the model determine the variability of the resulting spike trains.
Results
- Responses of P-receptors to repeated presentations of identical RAMs
- Quantification of response variability
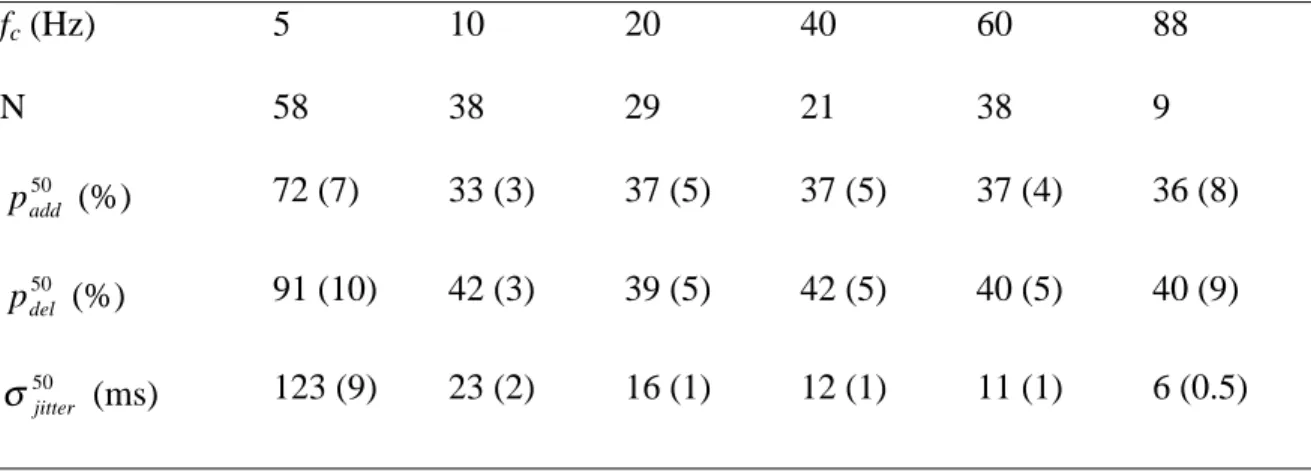
- Dependence of temporal jitter on stimulus cut-off frequency
- Variability and stimulus contrast
- Robustness of stimulus encoding
- Modeling of P-receptor afferent variability and linear transfer properties
By definition, this neural also takes into account differences in spike numbers between two spike trains (ie, the need to generate or delete spikes to transform one spike train into another; see Methods and Figure 1 ). Consequently, the mean distance between two spike trains of this P receptor afferent closely followed that of the gamma-10 neuron (see Figure 7B , triangles and squares) and was always smaller than the corresponding distance in a Poisson model ( Figure 7B , circles ). The )Dn(0 value in Figure 7B gives the mean difference in the number of spikes between two spike trains normalized by the total number of spikes.
Discussion
- Quantification of spike train variability
- Variability under various stimulus conditions
- Variability and robustness of encoding
- Variability and the processing of amplitude modulations in the ELL
- Encoding of biological signals and analog to digital conversion
For long time intervals (T ≥1 s), variances larger than the average of spike values are often observed, indicating positive long-term correlations in the spike trains (Teich et al., 1996). In contrast to the amplitude coding path, high reliability in the time coding path is necessary for the response to avoid jamming.
Tables
Figure legends
Each grid of spikes (9 per panel, 500 ms long) illustrates the response of the same P receptor. Plot of the timing jitter (mean ± sem) causing a 50% reduction in the encoding fraction as a function of stimulus bandwidth.
Overview
Introduction
Previous studies of information encoding in the electrosensory system have shown that afferents of a single P-receptor convey up to 80% of the information about the random amplitude modulations (RAM) of the electric field (see Chapter 1 and (Wessel et al., 1996, Gabbiani and Metzner, 1999) Individual pyramidal cells, however, only poorly encode the time course of a stimulus, instead reliably indicating the occurrence of up- and down-strokes in stimulus amplitude with spike bursts (Gabbiani et al., 1996, Metzner et al., 1998).
Methods
- Preparation and electrophysiology
- Anatomy
- Stimulation
- Cross-correlations
- Stimulus reconstruction
- Feature extraction
The nomenclature of the brain structures used for the light microscopic analysis follows (Maler et al., 1991). In this light, we extrapolated our estimate of the stimulus by calculating the encoding fraction from different repetitions, as discussed previously (see Chapter 2 and (Kreiman et al., 2000b).
Results
- Characteristics of correlated activity in ELL pyramidal cells
- Encoding of the time course of RAMs
- Feature extraction by multiple pyramidal cells
- Terminal spread of single primary afferents
We quantified the strength of the correlations for pairs of the same type by measuring the width at half height and the peak. For the remaining 6 cell pairs, no clear correlation was found between stimulus bandwidth and the width of the cross-correlograms.
Discussion
Source of correlated activity
It also ruled out that a large proportion of mediated input from P-receptor afferents was shared between neighboring pyramidal cells. Pyramidal cells may require coincident input from two or more primary afferents to function effectively.
Encoding of stimulus time course
In conclusion, even for pairs of pyramidal cells with overlapping receptive fields, random activity appeared to be due to largely separate but spatially overlapping primary-afferent inputs elicited by the same stimulus. We extended this approach to analyze whether the stimulus time course is preserved in the combined activity of groups of pyramidal cells.
Extraction of stimulus features by “distributed bursts”
It has been shown for cat geniculate neurons (Dan et al., 1998) and for salamander retinal ganglion cells (Meister et al., 1995) that temporally correlated activity could even be used as an additional channel for information flow to the cortex. The time scales determined for interspike intervals within bursts of single neurons were approx. 7-15 ms (Gabbiani et al., 1996, Metzner et al., 1998).
Figure legends
In both cases, the terminal fields were reconstructed from 3 consecutive cross-sections (thickness: 50 µm) of the ELL. Distribution of the spontaneous firing rates of the pyramidal cell units studied in this chapter.
Scope and motivation of the project
The direct feedback pathway to ELL has many of the properties that were proposed by Crick to play an important role in sensory “searchlight” mechanism (Crick, 1984): (i). Maler and colleagues have suggested that the several types of nonlinear elements occur in the ELL that would be ideally suited for this purpose: (i) voltage-dependent EPSPs, (ii) dendritic spike bursts, (iii) voltage-dependent inhibition, and (iv) ) frequency-dependent synaptic facilitation (Berman and Maler, 1999).
Methodological procedures
Stimulation
During the last 15 seconds the local stimulus was presented on top of the global stimulus. 23 Sinusoidal stimuli were used only to establish a stable recording and to coarsely map receptive fields.
Electrophysiology
Data analysis
Preliminary results
Neuronal response, example
During the combined local and global stimulation, it appears that the neuron will still respond to several of the peaks in the global stimulus, but not as strongly and reliably as before. Thus, there does not seem to be a change in the reliability of the neuronal response upon the appearance of a sudden local stimulus.
Summary of results
For each experiment, we assessed unit performance in eliciting upstrokes (E cells) and downstrokes (I cells) as described previously (see Chapter 3). Our preliminary observations suggest that the difference in feature extraction between type E and type I pyramidal cells (Figure 4-8a) disappears under conditions of local stimulation (Figure 4-9b).
Discussion
Although it was verified that the neuron's activity was modulated in the presence of the local stimulus alone25, it is not entirely clear what the effective stimulus was in the skin of the fish. It is also conceivable that the modulation of neuronal responses in the presence of a salient stimulus is modified at a later stage in the processing of information in the nervous system.
Figure legends
Summary of changes in firing rate between different periods of the experiment. a) Mean normalized firing rates for all (n = 96) trials. Summary of changes in the probability of misclassification, pe, between different periods of the experiment.
Neural coding and feature extraction
Coding principles
174 all invariance properties that are thought to occur higher up in the nervous system of the fish (Heiligenberg and Bastian, 1984, Heiligenberg, 1991, Konishi, 1991). Inhibition evoked by primary afferents in the electrosensory lateral line lobe of the weakly electric fish (Apteronotus leptorhynchus).
Σ-∆ A/D converters
Logan's theorem and stimulus reconstruction
At first it may seem that the information conveyed by the zero crossings is insufficient to adequately characterize a signal30. An important edge extraction method takes into account the zero crossings of the ∇2G operator on an image.
How might this relevant to the electric fish?
Pyramidal cells can reliably detect ups and downs in the stimulus, but still provide poor information about the exact location of the zero crossings32. But it is not clear that the information from T-receptor afferents could be used to detect zero crossings of the amplitude modulation as presented here.
Future directions
Correlating gamma-aminobutyric acid circuits and sensory function in the electrosensory lateral line lobe of A. Prey capture in the weakly electric fish Apteronotus albifrons: Sensory acquisition strategies and electrosensory consequences.