NEURAL MECHANISMS OF PERCEPTUAL DECISION MAKING
By
Braden A. Purcell
Dissertation
Submitted to the Faculty of the Graduate School of Vanderbilt University
in partial fulfillment of the requirements for the degree of
DOCTOR OF PHILOSOPHY in
Psychology May, 2013 Nashville, Tennessee
Approved:
Professor Thomas J. Palmeri Professor Jeffrey D. Schall Professor Gordon, D. Logan
Professor Mark T. Wallace
ii
ACKNOWLEDGEMENTS
I thank my family for their constant love and support, for emphasizing the importance of education, and for teaching me the joy of learning. I thank Tom Palmeri for taking me on as a graduate student, teaching me cognitive modeling, and supporting me through every step in my graduate career. I thank Jeff Schall for taking me into his lab, teaching me to question
everything, and always pushing me to be a better scientist. I thank Gordon Logan for his
excellent guidance and for reminding me to always do work that I love. I thank Mark Wallace for serving on my committee and asking stimulating questions. I thank everyone in Jeff Schall’s laboratory for countless valuable discussions. In particular, I thank Rich Heitz and Jeremiah Cohen for training me in neurophysiology and for immeasurable intellectual contributions to our projects. I thank Geoff Woodman for teaching me to record and interpret event-related potentials in non-human primates. I thank Polly Weigand for long hours spent on data collection and histology. I thank David Godlove for constant constructive criticism. I thank everyone in the Division of Animal Care, Vanderbilt Vision Research Center, Center for Integrative and Cognitive Neuroscience, Advanced Computing Center for Research and Education, and the Psychology Department staff for exceptional support throughout graduate school. I thank all of my colleagues in Department of Psychology and Vanderbilt Neuroscience Program for so many useful discussions, great feedback, and fascinating talks. I cannot imagine a better environment to have completed my doctorate. Finally, I thank Jonathan Hooper for helping me maintain the work-life balance that is necessary for a successful career.
This work was supported by National Institutes of Health Grants T32-EY07135, NEI RO1-EY08890, NEI P30-EY008126, P30-HD015052, NEI R01-EY21833, NEI R01-EY019882, National Science Foundation Grants SBE-0542013 and BCS0957074, and by Robin and Richard Patton through the E. Bronson Ingram Chair in Neuroscience at Vanderbilt University.
iii
TABLE OF CONTENTS
Page
ACKNOWLEDGEMENTS ... ii
LIST OF TABLES ... vii
LIST OF FIGURES ... viii
Chapter I. INTRODUCTION ... 1
1.1. Introduction ... 1
1.2. Stochastic accumulator models of perceptual decision making ... 3
1.3. Neuroanatomy of eye movement decisions ... 6
1.4. Neurophysiology of eye movement decisions ... 9
1.5. Linking propositions ... 15
1.6. Overview of studies ... 17
II. MIMICRY IN MODEL DYNAMICS: RELATING STOCHASTIC ACCUMULATOR MODEL PARAMETERS TO NEURAL DYNAMICS ... 20
2.1. Abstract ... 20
2.2. Introduction ... 20
2.3. Method ... 24
2.3.1. Overview of models ... 24
2.3.2. Measures of model dynamics ... 27
2.3.3. Simulation methods ... 29
2.4. Independent race model simulations ... 30
2.4.1. Identifying sources of across-trial variability from model dynamics: noiseless independent race. ... 31
2.4.2. Identifying sources of across-trial variability from model dynamics: noisy independent race ... 34
2.4.3. Generalization across parameter space ... 38
2.4.4. Accumulator noise, not Poisson spiking, distorts response dynamics ... 43
2.4.5. Across-condition changes in model parameters and dynamics ... 45
2.4.6. Noise obscures leakage dynamics ... 52
2.4.7. Noise obscures feed-forward and lateral inhibition ... 54
2.5. Discussion ... 59
2.5.1. On the identification of neurophysiological signals identified with evidence accumulation. ... 60
2.5.2. On the interpretation of neurophysiological signals identified with evidence accumulation. ... 61
iv
2.5.3. On the use of neurophysiology to discriminate alternative
models ... 65
2.5.4. Conclusions ... 68
III. FROM SALIENCE TO SACCADES: MULTIPLE-ALTERNATIVE GATED STOCHASTIC ACCUMULATOR MODEL OF VISUAL SEARCH ... 70
3.1 Abstract ... 70
3.2 Introduction ... 70
3.3 Materials and methods ... 72
3.3.1 Behavior and physiology ... 72
3.3.2 Simulation methodology ... 75
3.4 Results ... 86
3.4.1 Visual search behavior and neurophysiology ... 86
3.4.2 Gated competitive accumulation explains search performance .... 88
3.4.3 Gated competitive accumulation predicts dynamics of presaccadic movement activity ... 92
3.4.4 Gating inhibition and lateral competition are necessary .. 97
3.4.5 Control of speed-accuracy tradeoff ... 102
3.5 Discussion ... 104
3.5.1 A neurophysiologically-constrained account of visual search .... 105
3.5.2 Extending perceptual decision tasks to multiple stimuli ... 106
3.5.3 Strategic adjustments in speed and accuracy ... 107
3.5.4 Neurophysiological implications ... 108
3.5.5 Conclusions ... 109
IV. RESPONSE VARIABILITY OF FRONTAL EYE FIELD NEURONS MODULATES WITH SENSORY INPUT AND SACCADE PREPARATION BUT NOT VISUAL SEARCH SALIENCE ... 110
4.1 Abstract ... 110
4.2 Introduction ... 110
4.3 Materials and methods ... 112
4.3.1 Behavioral tasks and recordings ... 112
4.3.2 Data analysis ... 115
4.3.3 Accumulator model simulations. ... 120
4.4 Results ... 121
4.4.1 FEF response variability does not reflect behavioral relevance or physical conspicuity ... 122
4.4.2 FEF response variability reflects the strength of sensory input .. 127
4.4.3 FEF response variability reflects saccade preparation ... 131
4.4.4 Visually-responsive and saccade-related subpopulations ... 135
4.4.5 Stochastic accumulator simulations ... 137
4.4.6 Response variability during memory-guided saccades ... 138
4.4.7 Response variability and RT ... 140
4.5 Discussion ... 141
4.5.1 Relation to theories of visual search and attention ... 142
4.5.2 Stronger sensory input decreases response variability ... 143
4.5.3 Response variability as a signature of saccade preparation ... 145
v
V. ON THE ORIGIN OF EVENT-RELATED POTENTIALS INDEXING COVERT ATTENTIONAL SELECTION DURING VISUAL SEARCH: TIMING OF SELECTION BY MACAQUE FRONTAL EYE FIELD AND EVENT-RELATED
POTENTIALS DURING POP-OUT SEARCH ... 147
5.1 Abstract ... 147
5.2 Introduction ... 148
5.3 Materials and methods ... 150
5.3.1 Behavioral tasks and recordings ... 150
5.3.2 Data analysis ... 153
5.4 Results ... 157
5.4.1 Behavior ... 157
5.4.2 Selection time ... 158
5.4.3 Timing and magnitude of selection during efficient and inefficient search. ... 164
5.4.4 Trial-by-trial correlation of spike rate, LFP, and ERP amplitude ... 167
5.4.5 Control for differences in signal-to-noise ratio across measures of neural activity. ... 169
5.5 Discussion ... 170
5.5.1 Comparison of human and macaque N2pc. ... 171
5.5.2 The origin and interpretation of the N2pc. ... 172
5.5.3 Relation to previous studies of attentional selection across cortex ... 175
5.5.4 Relation to theories of visual search and attention ... 176
VI. SUPPLEMENTARY EYE FIELD DURING VISUAL SEARCH: SALIENCE, COGNITIVE CONTROL, AND PERFORMANCE MONITORING ... 178
6.1 Abstract ... 178
6.2 Introduction ... 178
6.3 Materials and methods ... 181
6.3.1 Behavioral tasks and recordings ... 181
6.3.2 Data analysis ... 185
6.4 Results ... 188
6.4.1 Absence of salience in SEF spiking activity during visual search ... 188
6.4.2 Absence of salience in SEF LFP during visual search ... 193
6.4.3 Comparison of visual responses in SEF and FEF ... 197
6.4.4 Absence of cognitive control in SEF during priming of pop-out 199 6.4.5 Performance monitoring in SEF during visual search ... 203
6.5 Discussion ... 205
6.5.1 Absence of salience in SEF ... 205
6.5.2 Does salience require ventral stream innervations? ... 206
6.5.3 Absence of priming effects in SEF neurons ... 207
6.5.4 Performance-monitoring signals in SEF during visual search .... 209
VII. GENERAL DISCUSSION ... 210
7.1 Summary of results ... 210
7.2 Open questions and future directions ... 211
vi
7.2.1 Linking propositions ... 211
7.2.2 Modeling at multiple levels ... 213
7.2.3 On the role of feed-back in perceptual decision-making ... 213
7.2.4 Performance monitoring during perceptual decisions ... 214
APPENDIX ... 216
BIBLIOGRAPHY ... 220
vii
LIST OF TABLES
Table Page
3.1 Best fitting parameter values and fit statistics for all model architectures and data sets. ... 91 4.1 Difference in mean discharge rate (DR) and Fano factor (FF) (±SE) for trials in which the target or distractors were in the RF. ... 124 5.1. Response time and selection time search slopes, in ms/items, for each neural signal during efficient (pop-out) and inefficient visual search. Values are slope of linear regression ±SE. ... 158 5.2 Comparisons of target selection time and latency of visual onset across signals during
efficient (pop-out) search ... 161
6.1 Numbers (percentages) of visually-responsive neurons and LFP that selected targets ... 189
viii
LIST OF FIGURES
Figure Page
1.1 Illustrations of perceptual evidence (A) and evidence accumulation (B). ... 4
1.2 Schematic of brain areas and pathways involved in visually-guided saccade generation. ... 9
1.3 Population averages from 33 visual and 21 movement neurons recorded from FEF during a memory-guided saccade task in which the target appeared inside (dark gray) or opposite (light gray) the RF of the neurons. ...11
1.4 Visual neuron recorded from the FEF of a macaque monkey performing the visual search task. ...12
1.5 Movement neuron recorded from the FEF of a macaque monkey performing a color search task. ... 15
1.6. Potential bridge loci of stochastic accumulator model processes. ... 17
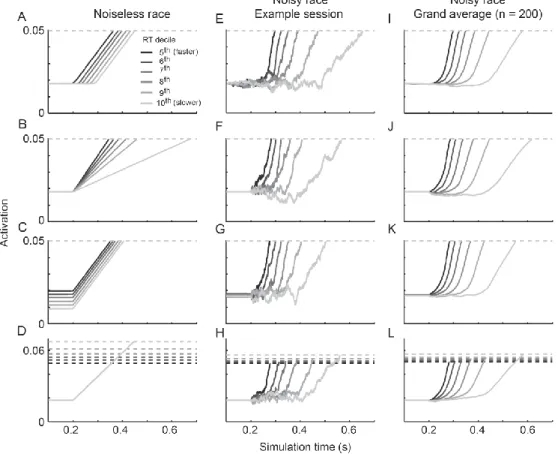
2.1 Independent race model dynamics. ... 32
2.2 Measures of model dynamics for a noiseless independent race model (s = 0). ... 34
2.3 Measures of model dynamics for a noisy independent race model (s = 0.1). ... 37
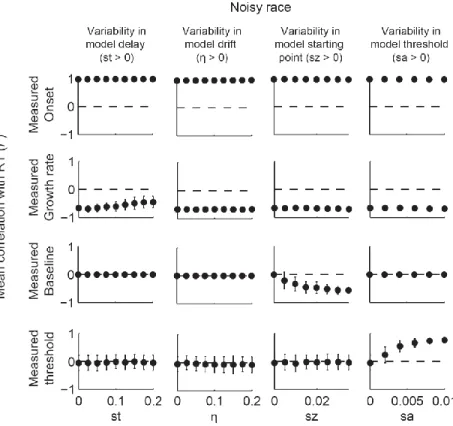
2.4 Measures of grand average model dynamics for a noisy independent race model. ... 38
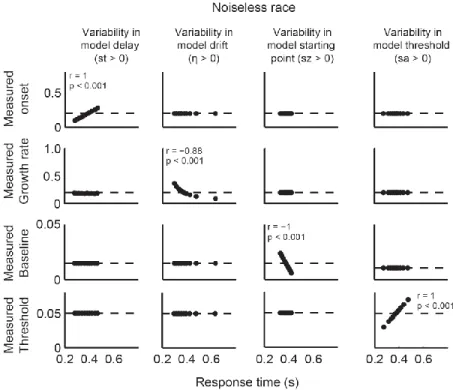
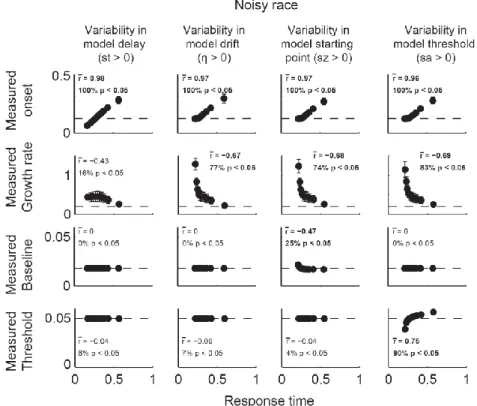
2.5 Correlations between measures of model dynamics and RT for a noisy independent race model (s = 0.1) with increasing levels across-trial variability. ... 40
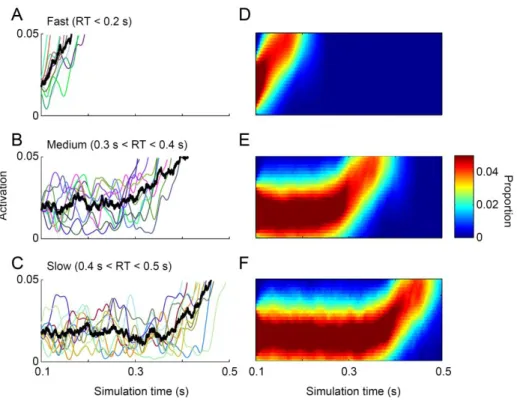
2.6 The impact of noise (s = 0.01) on independent race model dynamics for simulations resulting in fast (top; RT < 0.2 s), medium (middle; 0.3 s < RT < 0.4 s) and slow (bottom; 0.4 s < RT < 0.5 s) responses. ... 41
2.7 The effect of drift rate (v), threshold (a), and coefficient of variation (CV = s/v) on mean RT (A), and the mean predicted correlation between each measure of neural dynamics and RT (B). ... 43
2.8 Independent race model dynamics with Poisson spiking. ... 45
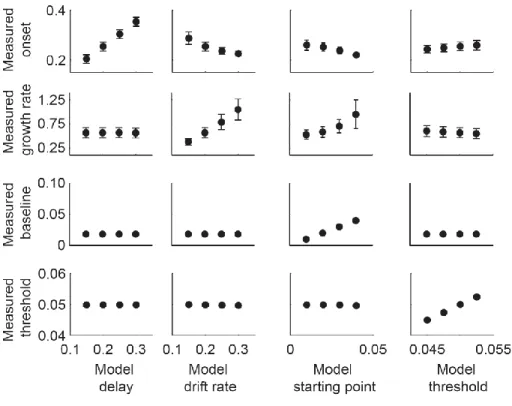
2.9 Across-condition changes in independent race model dynamics. ... 47
2.10 Across-condition changes in measures of model dynamics ... 48
ix
2.11 Encoding delay can be more reliably measured using only the first RT decile or the variance
onset ... 49
2.12 Independent race model mean and variance dynamics ... 51
2.13 Leaky race model dynamics. ... 54
2.14 Noiseless race model dynamics with feed-forward (A-C) and lateral (D-F) inhibition. ... 58
2.15 Noisy race model dynamics with feed-forward (A-C) and lateral (D-F) inhibition. ... 59
3.1: Visual search task and behavior. After fixating for a variable delay, an array of stimuli was presented, one of which was the target (e.g., L) and the rest were distractors of random 90o orientations (e.g., T). ... 74
3.2: Gated competitive accumulator model architecture. ... 77
3.3: Frontal eye field physiology during visual search. ... 88
3.4: Gated competitive accumulator model fits to pooled search performance. ... 90
3.5: Gated competitive accumulator model fits to individual monkey search performance. ... 91
3.6: Movement neuron and gated accumulator dynamics. ... 93
3.7: Quantification of movement neuron and gated competitive accumulator model dynamics across set size. ... 95
3.8: Quantification of movement neuron and gated competitive accumulator model dynamics across response time bins within each set size. ... 97
3.9: Rejection of alternatives to gated competitive accumulation. ... 99
3.10: Fit summary for alternative model architectures fit to pooled (A), monkey Q (B), and monkey S (C) search performance data. ... 100
3.11: Models with no gate fail to predict observed movement neuron dynamics. Observed (brackets) and predicted (points) median correlation between response time and four measures of neural dynamics for set size 2 (A), 4 (B), and 8 (C). ... 102
3.12: Threshold and gating inhibition can explain speed-accuracy tradeoffs. A,B, Mean expected reward rate as a function of the threshold (A) and gate (B) values when other parameters are fixed at the values which best fit the pooled search performance. ... 104
4.1 Color and form visual search tasks. ... 114
4.2 Temporal dynamics of discharge rate and Fano factor aligned on array onset for the full population of 304 neurons during all visual search tasks. ... 122
4.3 Temporal dynamics of discharge rate (top) and Fano factor (bottom) for efficient (left) and inefficient (right) search. ... 126
x
4.4. Effect of luminance on discharge rate (DR) and Fano factor (FF). ... 128
4.5. Effect of set size on discharge rate (DR) and Fano factor (FF) for trials in which the target (left) or distractors (right) were in the neurons’ RFs. ... 129
4.6. Effect of set size on discharge rate (DR) and Fano factor (FF) during efficient (left) and inefficient (right) visual search. ... 131
4.7 Temporal dynamics of discharge rate (A) and Fano factor (B) aligned on saccade initiation during visual search for the full population of 304 neurons. ... 133
4.8 Mean-matched discharge rate (DR) (top) and Fano factor (bottom) as a function of time relative to array presentation (left) and saccade initiation (right). ... 133
4.9. Spatial tuning of mean discharge rate (A,C) and Fano factor (B,D) as a function of distance from RF center (in degrees polar angle) during the post-array (left) and pre-saccadic (right) epochs. ... 135
4.10. Visually-responsive and saccade-related subpopulations. ... 136
4.11. Accumulator model simulations. ... 138
4.12. Memory-guided saccades. Mean discharge rate (A) and Fano factor (B) during memory- guided saccades aligned to target onset (left) or saccade (right) in which the target appeared inside (dark gray, Target in RF) or diametrically opposite (light gray, Target opp RF) the neurons’ RFs. ... 140
4.13. Mean discharge rate (A,C) and Fano factor (B,D) aligned on the cue (left) and saccade (right) for memory-guided saccade trials with RT earlier (green) and later (red) than median RT. ... 141
5.1 Visual search task and behavior. ... 152
5.2 Target selection during a representative session. ... 159
5.3 Population selection times for each type of signal. ... 161
5.4 Within-session selection time differences across signals. ... 162
5.5 Average selection time for FEF single-unit spikes (top), FEF LFPs (middle), and m-N2pc (bottom) at each set size. ... 165
5.6 Average magnitude of selection (response amplitude when the target was in the preferred location of the signal minus the response amplitude when a distractor was in the preferred location) for FEF single-unit spikes, FEF LFPs, and the m-N2pc at each set size. ... 167
5.7 Trial-by-trial correlations between FEF LFP amplitude and the amplitude difference between posterior EEG electrodes (A), between FEF LFP amplitude and FEF single-unit firing rate recorded on the same electrode (B), and between FEF single-unit firing rate and the amplitude difference between posterior EEG electrodes (C). ... 169
xi
5.8 Selection time by number of trials. ... 174
6.1 Distribution of visual afferents to supplementary eye field (SEF). ... 180
6.2 Visual search task. ... 183
6.3 Localization of SEF. ... 184
6.4 Representative visually-responsive neuron during detection and search. ... 189
6.5 Distribution of directional biases for visually-responsive SEF and FEF neurons and LFP. . 191 6.6 Neuron-antineuron test for target selectivity. ... 193
6.7 Representative visually-responsive LFP site during detection and search. ... 195
6.8 The distribution of receptive field widths for SEF (open histogram) and FEF (solid red histogram) across the population of neurons across the population of neurons (top) and LFP (bottom) during the memory-guided saccade task. ... 198
6.9 Representative SEF neuron (A) and LFP (C) during detection (gray) and visual search tasks (black) when the target fell inside the RF. ... 199
6.10. Priming of pop-out task and behavior. ... 200
6.11. A, Mean discharge rate of a representative neuron recorded during the priming of pop-out task when the target. ... 202
6.12. A, The mean discharge rate of the same representative neuron shown in Figure 6.11 with discharge rate divided by the number of trials since the target switch (n). ... 203
6.13. Representative error-related neuron during detection and search. ... 204
A.1 Diffusion model dynamics ... 216
A.2 The impact of noise on diffusion model dynamics ... 217
A. 3 Across-condition changes in diffusion model dynamics ... 218
A.4 The effects of varying sample size on the noisy independent race model dynamics ... 219
1 CHAPTER I
INTRODUCTION
1.1 Introduction
Perceptual decisions guide responses based on sensory information. For example, upon encountering a new object, we must decide what it is that we’re seeing before we decide how to respond. Perceptual decisions are among the most simple and frequent types of decisions exhibited by humans (e.g., Palmeri, 1997), monkeys (e.g., Schall, 2003), rats (e.g., Kepecs et al., 2008), mice (e.g., Harvey et al., 2012), and fruit flies (e.g., Zhang et al., 2007). Therefore, if we want to understand the neural mechanisms underlying complex goal-directed behavior, then perceptual decision making is a good place to start.
Recent advances in methods for monitoring neural activity from awake, behaving animals and humans have opened the door to rich descriptions of neurophysiological signals occurring during perceptual decisions. However, understanding how this underlying neural activity ultimately leads to behavior is not trivial. Even the simplest behaviors depend on coordinated activity across a number of different brain areas. Different brain areas might implement different computations, or the same computation might be distributed across different areas. Moreover, even within a small region of cortex, different neurons have distinct morphologies, patterns of connectivity, and response properties depending on their position within the local microcircuit.
Thus, even within a single brain area, different neuronal populations might implement different computations. Given this complexity, how can we begin to meaningfully relate the growing body of neurophysiological observations to complex behavior like decision-making?
The field of cognitive psychology provides an alternative perspective for understanding behavior. A fundamental concept in cognitive psychology is that mental operations can be divided into a series of basic processes (Donders, 1969; Marr, 1982; Sternberg, 2001). These
2
theories explain behavior in terms of simple processes that often fit with our subjective experience of what it means to think and act. For example, I first perceive an object, and then categorize it, and then act. Mathematical psychologists have made this approach more rigorous by implementing these processes in computational models (Townsend and Ashby, 1984; Luce, 1991; Busemeyer and Diederich, 2009; Farrell and Lewandowsky, 2010). Cognitive models make the processes explicit by establishing how information is quantitatively represented and the algorithms by which it is transformed to drive behavior.
Cognitive and mathematical psychology have more-or-less converged on a general framework to explain the processes underlying perceptual decisions. Stochastic accumulator models (also termed sequential-sampling models, accumulator models, or rise-to-threshold models) explain perceptual decision-making by assuming that perceptual information
accumulates to a response threshold (Nosofsky and Palmeri, 1997; Ratcliff and Rouder, 1998;
Smith and Van Zandt, 2000; Usher and McClelland, 2001; Ratcliff and Smith, 2004; Bogacz et al., 2006). These models propose that perceptual decision-making entails at least two distinct processes: (1) a stimulus must be encoded with respect to the current task, and (2) some
mechanism must accumulate that evidence to reach a decision. This family of models currently provides the best account of decision-making behavior across a broad range of behavioral paradigms. Ultimately, however, these models were not developed to explain how these representations and algorithms could be implemented by the biological processes in the brain.
This overall goal of this work is to evaluate whether specific neuronal populations can be identified with the stages of processing proposed by stochastic accumulator models. If so, then these models might provide a framework to understand how observed neural activity leads to choice behavior. One advantage of the accumulator model framework is that it makes clear predictions for how specific model elements should change under certain conditions. By recording neurophysiological signals from macaque monkeys performing perceptual decision- making tasks, we can test whether the responses of different neuronal populations change in ways
3
that are consistent with model predictions. In this way, the models can provide a way to understand how basic computations underlying perceptual decisions might be distributed across different brain areas, or even across different neuronal populations within the same region.
The remainder of this chapter will review evidence that specific neuronal populations can be identified with the processes proposed by stochastic accumulator models. I will focus on perceptual decisions about where and when to move the eyes because the basic anatomy and physiology of the oculomotor system are relatively well understood. Likewise, I will focus mainly on decisions about visual information because the visual system is better understood than other sensory modalities. I will first review the stochastic accumulator model framework and its key assumptions. I will then review anatomy of visually-guided saccades. Finally, I will review the neurophysiology of sensorimotor areas thought to be involved in perceptual decisions. This literature review raises open questions regarding potential links between accumulator models and distinct neural states that will motivate the studies described in subsequent chapters.
1.2 Stochastic accumulator models of perceptual decision making
Stochastic accumulator models divide response time into two basic processes. First, sensory information must be encoded with respect to the current task and potential responses to reflect perceptual evidence for a response (Figure 1.1A). Sensory information is noisy due to external noise in the stimulus or internal noise in the brain; thus, a single stimulus is associated with a distribution of evidence. In a standard signal detection theory framework, a perceptual decision would be explained by taking a single sample from the appropriate distribution, comparing it to some criterion, and basing the decision on whether the sample was greater than or less than some criterion (Green and Swets, 1966). Stimuli that are more easily discriminated will more often result in correct classification, whereas stimuli that are more similar will more often produce errors. While this approach provides a good account of choice data across a broad range of tasks (e.g., Murdock Jr, 1965; Ashby and Townsend, 1986; Verghese, 2001), it does not explain how
4 the decision unfolds over time.
Figure 1.1 Illustrations of perceptual evidence (A) and evidence accumulation (B). A: Representation of perceptual evidence for target (solid lines) and non-target (dashed lines) stimuli when the discrimination is easy (top, red) or difficult (bottom, green). Signal detection theory predicts that choices are made by comparing a single sample of evidence to some criterion (e.g., vertical gray line). B: Evidence accumulation dynamics. Samples of perceptual evidence are repeatedly sampled (black lines) until some threshold is reached (gray line). Only one accumulator is illustrated, but decisions typically include multiple racing accumulators representing alternative responses. The quality of perceptual evidence determines the mean rate at which evidence accumulates. Stronger evidence causes faster rates of rise (red arrow) and weaker evidence causes slower rates of rise (green arrow).
Stochastic accumulator models extend signal-detection theory by providing a theory for how samples of evidence are read-out over time. Rather than basing decisions on a single sample of evidence, the distribution of perceptual evidence is repeatedly sampled and accumulated over time (Figure 1.1B). Alternative responses may be represented by bounds in different directions (e.g., Ratcliff, 1978) or by multiple accumulators (e.g., Brown and Heathcote, 2005). A response is selected when the first accumulator bound, or threshold, is reached. The strength of sensory evidence for a particular response increases the rate at which evidence for that response
accumulates (termed the drift or drift rate). Stimuli that are more easily discriminate will result in faster drift rates for the correct response accumulator. Responses with the greatest drift rate are more likely to be selected, but other responses will occasionally win because of noise in the evidence distributions. Often, the drift rate is a free parameter whose value is selected to
optimize the match between predicted and observed behavior (e.g., Ratcliff and Smith, 2004), but more recent models have been developed to explain the computations by which the stimulus
5
representation and drift rate are generated (e.g., Nosofsky and Palmeri, 1997; Palmeri, 1997;
Ashby, 2000; Lamberts, 2000; Palmeri and Tarr, 2008; Smith and Ratcliff, 2009).
Several additional parameters govern the nature of the accumulation process (see Ratcliff and McKoon, 2008, for review). First, the total time necessary for processes outside the
accumulation of evidence is referred to as the non-decision time. The non-decision time includes time preceding the decision that is necessary to encode the stimulus and compute the distribution of perceptual evidence, as well as motor delay after a response threshold is reached. Second, adjustments in the starting point of the accumulation can bias the process in favor of particular responses. Accumulators that start closer to the threshold are more likely to win the race for selection. Third, varying the threshold across all accumulators can adjust the emphasis on speed relative to accuracy. Higher thresholds lead to slower decisions, but allow more time for
evidence to accumulate. This increases the probability that the accumulator with the highest drift rate will win the race (i.e., the correct response). Thus, changes in non-decision time, starting point, and threshold predict very different patterns of behavior.
Alternative models also propose different mechanisms for whether and how accumulators representing alternative responses interact. Independent race models assume that evidence for each response accumulates independently; the first accumulator to reach threshold determines which response is made (Vickers, 1970; Smith and Van Zandt, 2000). Other models assume that alternative responses compete through inhibitory interactions. Models that assume feed-forward inhibition propose that model inputs supporting one response simultaneously reflect evidence against alternative responses (Mazurek et al., 2003; Ditterich, 2006). Drift diffusion (Ratcliff, 1978; Ratcliff and Rouder, 1998) and their discrete analogue random walk models (Laming, 1968; Link and Heath, 1975; Nosofsky and Palmeri, 1997) represent a form of feed-forward inhibition because they assume response boundaries in opposite directions (Bogacz et al., 2006).
In contrast, models that assume lateral inhibition propose that alternative responses inhibit one another. As evidence in favor of one response grows, it inhibits alternative responses more
6
strongly in a winner-take-all fashion (Grossberg, 1976; Usher and McClelland, 2001). These alternative models can vary in other respects such as whether integration of evidence is perfect or leaky. However, it has been very difficult to discriminate these models based on behavioral data alone (Smith and Ratcliff, 2004).
The accumulator model framework parses a single decision into a series of interacting processes that determine behavior. The model makes predictions about how processes should change under specific conditions. For example, drift rate should decline with the difficulty of a perceptual decision and the threshold should increase when accuracy is emphasized. These predictions establish a foundation to begin asking whether the proposed processes map onto specific neuronal populations. Importantly, the neuronal population must also have appropriate anatomical connectivity to mediate the proposed function. For example, a neuron that is said to represent evidence must be anatomically positioned to provide input to a neuron proposed to accumulate evidence. Thus, anatomical considerations provide a basis to begin exploring the potential links between model components and neuronal populations.
1.3 Neuroanatomy of eye movement decisions
The outcome of a decision is a choice expressed through action. A neuron that is involved in decisions about eye movements must therefore be capable of influencing neurons that initiate a shift of gaze. Eye movements are initiated by a network of nuclei in the brainstem (Scudder et al., 2002; Sparks, 2002). Briefly, saccades are produced by a pulse of force that rotates the eyes followed by a step of force that maintains eccentric gaze by opposing the elastic forces of the orbit (Robinson, 1964). The pulse of force is generated by motor neurons that are directly innervated by burst neurons that discharge for saccades of a particular direction, amplitude, and velocity (Fuchs and Luschei, 1970). The step of force is generated by tonic neurons that integrate the velocity to provide a tonic position signal to motor neurons (Cannon and Robinson, 1987).
Burst neurons and motor neurons are tonically inhibited by omnipause neurons (OPNs) that fire
7
tonically, but cease immediately before saccades (Luschei and Fuchs, 1972). OPNs are thought to be inhibited by long-lead burst neurons via inhibitory interneurons (Kamogawa et al., 1996).
Thus, excitation of burst neurons and inhibition of OPNs is necessary for saccade generation.
Three sensorimotor areas are well anatomically positioned to initiate saccades when a response threshold is reached: Superior colliculus (SC), frontal eye field (FEF), and
supplementary eye field (SEF). SC is the main source of subcortical input to the oculomotor brainstem nuclei (Moschovakis et al., 1988). There are also projections from cerebellar nuclei, but they will not be discussed here (see Scudder et al., 2002 for review). FEF, located in the anterior bank of the arcuate sulcus, and SEF, located on the dorsal bank of medial frontal cortex, are the main source of cortical input to the oculomotor brainstem nuclei (Huerta et al., 1987;
Stanton et al., 1988; Huerta and Kaas, 1990; Shook et al., 1990). Of these structures, SC and FEF appear to be most critical for control of saccade initiation. Lesions of either SC or FEF alone result in minimal deficits whereas lesions of both FEF and SC result in an inability to generate voluntary saccades (Schiller et al., 1979). In contrast, lesions of SEF result in temporary
increases in saccade latency, but no major deficits (Schiller and Chou, 2000). Thus, an intact FEF or SC is sufficient for saccade generation, whereas SEF is neither necessary nor sufficient.
To be identified with a representation of perceptual evidence, a neuronal population must be innervated by cortical areas that encode sensory information. Neurons in primary and extrastriate visual cortex encode stimulus features (see Orban, 2008, for review). FEF neurons receive topographic input from many extrastriate visual areas V2, V3, V4, MT, TE and TEO (Schall et al., 1995a; Bullier et al., 1996). The intermediate layers of SC also receive converging inputs from diverse posterior visual areas (Leichnetz et al., 1981; Sparks, 1986; Leichnetz and Gonzalo- Ruiz, 1996; Fries, 2004). Thus, FEF and SC seem to be well positioned to integrate diverse sources of visual information. In contrast, SEF receives inputs from far fewer visual areas (Huerta and Kaas, 1990). However, FEF and SEF are densely connected, and SC receives direct projections from and sends indirect projections to FEF and SEF via the medial dorsal nucleus
8
(MD) of the thalamus (Sommer and Wurtz, 2004b, a; Tanaka, 2007). Therefore, SEF could receive indirect visual information from other sensorimotor areas.
FEF, SEF, and SC are also interconnected with posterior parietal cortex. In particular, the lateral intraparietal area (LIP) in posterior parietal cortex is densely and reciprocally
interconnected with FEF and SC (Andersen et al., 1990; Blatt et al., 1990), and also SEF to a somewhat lesser degree (Schall et al., 1995a). LIP also receives input from numerous visual areas including V3, V3A, V4, MT, MST, and TEO (Blatt et al., 1990), although the topography of these connections is far rougher than those connecting to FEF. Feedback from SC is also relayed to LIP via the MD nucleus of the thalamus and the medial pulvinar (Hardy and Lynch, 1992; Asanuma et al., 2004; Schmahmann and Pandya, 2004). Unlike FEF and SC, however, LIP is not directly connected to oculomotor nuclei in the brainstem (May and Andersen, 1986;
Schmahmann and Pandya, 1989). Thus, while LIP has inputs appropriate to represent perceptual evidence, only FEF, SC, and SEF can directly influence saccade production.
T o summarize, FEF, SC, LIP, and SEF are all at the junction between perceptual and motor processing, but the anatomical connectivity for each region places limits on proposed functions. First, neurons in FEF, SC, and LIP receive diverse inputs from visual cortex and could integrate different sources of sensory information to represent perceptual evidence. SEF is embedded within this network, although it receives inputs from far fewer early visual areas.
Second, FEF, SC, and SEF are directly connected to the brainstem saccade generating nuclei and could initiate saccades when a fixed threshold is reached. Neurons in LIP and other extrastriate visual areas are not directly connected to the saccade generating nuclei of the brainstem and therefore their outputs may undergo further processing prior to saccade initiation. Given these anatomical constraints, we can next ask how neurons within these areas respond while the organism is engaged in perceptual decisions and whether the form of modulation is consistent with predictions of stochastic accumulator models.
9
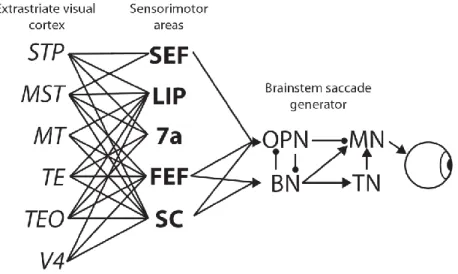
Figure 1.2 Schematic of brain areas and pathways involved in visually-guided saccade generation. Lines indicate reciprocal connections. Arrows indicate one-way projections. SEF, LIP, 7a, and FEF are interconnected. SC is connected to other sensorimotor areas via the mediodorsal nucleus of the thalamus (not pictured). OPN: omnipause neurons. BN: burst neurons. MN: motor neurons. TN: tonic neurons. See text for more details.
1.4 Neurophysiology of eye movement decisions
Neurons in FEF, SC, SEF, and LIP have highly heterogeneous response properties. At the most basic level, these neurons can be classified according to their sensorimotor response properties (e.g., Bruce and Goldberg, 1985). Visual neurons respond briskly when a stimulus is flashed in their receptive field and may sustain an elevated firing rate when the stimulus must be remembered (Figure 1.3, top). These neurons may also show some pre-saccadic discharge (termed visuomovement neurons1). Another class of movement neurons responds primarily when saccades of a particular direction and amplitude are initiated (Figure 1.3, bottom). Visual and visuomovement neurons are found in FEF, SC, LIP, and SEF (Bruce and Goldberg, 1985; Gnadt and Andersen, 1988; Stuphorn et al., 2010). However, saccade-related neurons are found primarily in FEF, SC, and SEF and much less frequently in LIP (Gottlieb and Goldberg, 1999).
The diversity of response properties must be dictated by differences in the local
1 In subsequent chapters, I will use the term visually-responsive neurons to refer to visual and
visuomovement neurons that may also have weaker saccade-related discharge, and I will use the term saccade-related neurons to refer to movement and visuomovement neurons that may also have a weak visual response.
10
microcircuity. In particular, converging evidence suggests that movement neurons in SEF and FEF can be identified with deeper layer 5 pyramidal neurons that distinguish these areas from adjacent cortex (Stanton et al., 1989; Matelli et al., 1991) and are the likely origin of projections to downstream subcortical oculomotor areas (Stanton et al., 1988; Shook et al., 1990, 1991;
Pouget et al., 2009). In SEF, the distribution of movement neurons was found to be significantly deeper than visually-responsive neurons (Russo and Bruce, 2000). In FEF, neurons anti-
dromically stimulated from OPN regions in the brainstem show primarily saccade-related or fixation-related responses (Segraves, 1992). Also, the current threshold for electrically evoked eye movements in FEF is lowest at sites in which saccade-related activity has been recorded (Bruce and Goldberg, 1985). In contrast, histological reconstructions suggest that visually- responsive neurons are distributed throughout the layers (Thompson et al., 1996). Note that some layer 5 projection neurons can also be identified as visually-responsive (Everling and Munoz, 2000; Sommer and Wurtz, 2000), so the division by layer is not perfect. Altogether, however, these observations suggest that visually-responsive and movement-related neurons may represent functionally distinct subpopulations of neurons within sensorimotor areas.
Figure 1.3 Population averages from 33 visual and 21 movement neurons recorded from FEF during a memory-guided saccade task in which the target appeared inside (dark gray) or opposite (light gray) the RF of the neurons.
11
In order to understand how visual and movement neurons might correspond to accumulator- model processes, their properties must be recorded while monkeys perform perceptual decision- making tasks. The visual search paradigm is a perceptual decision-making task that requires subjects to discriminate a target object among a number of distractors in order to select a response (see Wolfe, 2007, for review). Different models have been developed to explain how subjects can discriminate the relevant target from the irrelevant distractors. Many models of search propose that a salience map combines both the physical conspicuousness (i.e., bottom-up
information) and the behavioral relevance (i.e., top-down information) of items in the visual field in order to guide both covert attention and eye movements (Treisman and Sato, 1990; Wolfe, 1994; Itti and Koch, 2001; Bundesen et al., 2005; Wolfe, 2007). Eye movements and covert attention are assumed to be guided to peaks on the salience map.
I will first consider the role of visual neurons during the visual search task. Converging evidence suggests that visual neurons in FEF, SC, and LIP can be identified with the salience map proposed by models of visual attention (Findlay and Walker, 1999; Thompson and Bichot, 2005;
Gottlieb, 2007; Bisley and Goldberg, 2010). During search, the firing rate of these neurons initially elevates regardless of the stimulus in the receptive field. Over time, however, firing rates evolve to select the location of behaviorally-relevant stimuli by maintaining an increased firing rate if the relevant target is in the neuron’s receptive field and reducing firing rate if an irrelevant distractor is in a neuron’s receptive field. This target selection process takes place across a distributed network of visuomotor areas including FEF (Schall and Hanes, 1993; Thompson et al., 1996; Bichot and Schall, 1999a), SC (McPeek and Keller, 2002; Shen and Paré, 2007), LIP (Ipata et al., 2006; Thomas and Pare, 2007; Ogawa and Komatsu, 2009), substantia nigra pars reticulata (Basso and Wurtz, 2002), parietal area 7a, (Constantinidis and Steinmetz, 2001; Katsuki and Constantinidis, 2012), PFC (Hasegawa et al., 2000; Constantinidis and Steinmetz, 2001;
Buschman and Miller, 2007; Katsuki and Constantinidis, 2012), and medial dorsal nucleus of the
12
thalamus (Schall and Thompson, 1994; Wyder et al., 2004). However, it is not known whether SEF neurons represent visual salience.
Figure 1.4 Visual neuron recorded from the FEF of a macaque monkey performing the visual search task. The left panel shows the average normalized firing rate when the target (solid lines) or a distractor (dashed lines) were inside the receptive field of the neuron during an easy (red) and hard (green) color search task. The right panels show the distribution of mean firing rates in the time window 125-200 ms after the array onset (gray box in left panel).
Conventions as in left panel. Firing rate distributions were convolved with a Gaussian distribution for smoothing.
The pattern of firing rate modulation during target selection is consistent with the properties of the hypothetical salience map in several ways. First, the selection process is influence by bottom-up properties of the stimulus. When the target and distractor are easily discriminated, the target is selected earlier and the post-selection firing rate difference (i.e., the magnitude of selection) is larger (Figure 1.4; Basso and Wurtz, 1998; Bichot and Schall, 1999a; Sato et al., 2001; Balan et al., 2008; Cohen et al., 2009b). Note that the evolution of salience is dynamic and these dynamics must be taken into account when explaining decision-making. Second, the selection process is influenced by top-down factors including trial history and expected reward.
When the target identity is fixed for several consecutive trials, the magnitude of selection is greater than if target identity has recently changed (Bichot and Schall, 2002). Firing rates are also modulated by the probability and magnitude of expected reward (Platt and Glimcher, 1999;
Roesch and Olson, 2003; Ding and Hikosaka, 2006). Third, the representation of visual salience
13
by visual neurons is independent of movement production. Search targets are selected even if the animal is instructed to withhold a saccade (Thompson et al., 1997), if the animal responds
manually (Thompson et al., 2005a), or if the location of the target unexpectedly changes (Murthy et al., 2001; Murthy et al., 2009). Importantly, these are the same properties that would be expected of a population of neurons that represented perceptual evidence that a target is present within their receptive field. However, the connection between the neurophysiological
representation of salience and accumulator models has not been established.
Recall that the connections between posterior visual areas and sensorimotor areas that encode visual salience are reciprocal (Figure 1.2). Neurons in the superficial layers of FEF and LIP send feed-back projections to many visual areas (Blatt et al., 1990; Pouget et al., 2009) and SC can relay signals to visual cortex via the pulvinar (Benevento and Standage, 2004; Lyon et al., 2010).
Although, the firing rates of neurons in posterior visual areas are primarily driven by their preference for object features, these responses can also be modulated to some degree by the object’s behavioral relevance (i.e., visual attention; Moran and Desimone, 1985; Luck et al., 1997b; Ogawa and Komatsu, 2004). The effect of microstimulation and pharmacological manipulation of FEF on extrastriate neurons suggests that feedback from frontal areas like FEF might be one source driving these modulations (Moore and Armstrong, 2003; Monosov et al., 2011; Noudoost and Moore, 2011; but note that the role of SC has recently been called into question; Zenon and Krauzlis, 2012). If so, then the representation of salience in sensorimotor areas may be detectable at a population level in regions of posterior visual cortex, although this connection has not been conclusively established.
Next, consider the response properties of FEF and SC movement neurons (Figure 1.5).
During search, movement neuron responses differ from visual neuron responses in two key ways.
First, unlike visual neurons, movement neuron firing rates are not independent of saccade production. Movement neurons respond only before saccades of a particular direction and amplitude (Schiller and Koerner, 1971; Bruce and Goldberg, 1985; Schall, 1991b; Munoz and
14
Wurtz, 1995). These neurons fire before saccades when no stimuli are visible (Bruce and Goldberg, 1985) and when the saccade is directed away from a visual target (Everling et al., 1999; Everling and Munoz, 2000). During search, the onset time of movement neuron firing increases with response time if the target location is indicated via saccade (Figure 1.5, right;
Woodman et al., 2008), but firing rates are suppressed if the location is indicated by hand (Thompson et al., 2005a). When a monkey is instructed to withhold a pre-cued saccade,
movement neurons, but not visual neurons, modulate their firing rate sufficiently early to predict whether or not the saccade was withheld or initiated (Hanes et al., 1998; Brown et al., 2008;
Murthy et al., 2009). The lack of independence from saccade production indicates that these neurons cannot be identified with a covert representation of salience or perceptual evidence.
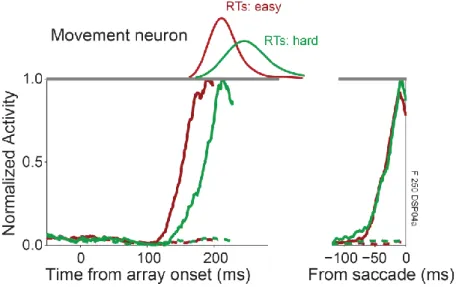
Figure 1.5 Movement neuron recorded from the FEF of a macaque monkey performing a color search task.
Conventions as in Figure 1.4. Left panel is aligned on array onset and right panel is aligned on saccade.
The second key difference between movement and visually-responsive neurons is that movement neurons reach a fixed firing rate threshold immediately prior to saccades (Hanes and Schall, 1996; Dorris and Munoz, 1998; Ratcliff et al., 2003; Brown et al., 2008). This threshold may be identified with the trigger that initiates a saccade by tipping the balance of excitation and inhibition between burst neurons and OPNs (Figure 1.5). The time when movement neuron, but
15
not visual neuron, firing rates reach a fixed level accounts for random variability in response time (Hanes and Schall, 1996; Brown et al., 2008). If a task is made perceptually more difficult, then response times are longer, but movement neurons still reach the same firing rate immediately prior to a saccade (Ratcliff et al., 2003; Ratcliff et al., 2007; Woodman et al., 2008). Note that the value of the threshold is not fixed across all conditions; it may vary during non-visually-guided antisaccades (Everling et al., 1999; Everling and Munoz, 2000), when errors are made
(Thompson et al., 2005b), or when deadlines are employed (Heitz and Schall, 2012). Critically, however, it always appears to be constant within a single condition. Altogether, these
observations indicate that movement neurons exhibit dynamics that seem qualitatively consistent with the predictions of stochastic accumulator models.
1.5 Linking propositions
Linking propositions are statements that map unobservable cognitive states onto observable neural states, and the population of neurons that instantiate the process are referred to as a bridge locus (Teller, 1984; Schall, 2004). Accumulator models make predictions about how the bridge locus for the perceptual evidence and evidence accumulation should change under certain conditions. Given what we now know about the anatomy and physiology of perceptual decision- making, what are the potential bridge loci for perceptual evidence and evidence accumulation? In this section, I summarize four potential neuronal populations to be evaluated (Figure 1.6).
One potential link between model and brain are visual neurons in FEF, LIP, and SC that seem to represent the salience of objects in the visual field. Existing models of visual salience propose that eye movements are targeted to locations at the peak of the salience map, but the neural mechanisms by which a peak on the map are transformed into a command to move the eyes are generally not clear. One possibility is that the representation of salience can be identified with the representation of perceptual evidence that drives a stochastic accumulation to threshold, but this proposal has not been rigorously evaluated.
16
A second potential link between model and brain are FEF and SC movement neurons. The observation that these neurons reach a fixed firing rate threshold seems consistent with the temporal dynamics predicted by accumulator models. Therefore, one possibility is that these neurons might instantiate the accumulation process. Several existing models have shown that movement neuron dynamics can be explained by stochastic accumulation (Ratcliff et al., 2003;
Boucher et al., 2007; Ratcliff et al., 2007), but these models do not explain the source of
perceptual evidence. A complete theory of perceptual decision-making will need to explain both where the accumulation takes place, and the source of evidence being accumulated.
A third potential link between the model and brain are neurons in posterior visual cortex.
Existing models have focused on the role of feature-selective neurons as a source of feed-forward inputs to FEF, LIP, and SC (Shadlen and Newsome, 2001; Mazurek et al., 2003). However, feed- back from FEF and possible also LIP are thought to modulate feature-selective neurons according to behavioral relevance (Ogawa and Komatsu, 2004). One hypothesis is that visual neurons that represent perceptual evidence in FEF are the source of top down inputs. If so, then simultaneous recordings from FEF and posterior visual cortex should reveal very similar patterns of modulation in FEF visual neurons and posterior visual cortex.
A fourth potential link between model and brain are SEF neurons in medial frontal cortex.
SEF is interconnected with FEF, SC, and LIP (Huerta and Kaas, 1990). SEF has both visual and movement neurons (Schall, 1991a). SEF movement neurons, unlike FEF and SC movement neurons, do not reach a fixed response threshold and therefore seem inconsistent with evidence accumulation (Stuphorn et al., 2010). However, the role of SEF visual neurons in representing perceptual evidence is not known. To address this question, SEF neurons must be recorded during the same visual search task as FEF, SC, and LIP. If SEF neurons represent perceptual evidence, then they should be modulated by physical conspicuousness and behavioral relevance similar to other areas known to represent visual salience.
17
Figure 1.6. Potential bridge loci of stochastic accumulator model processes. The following chapters will address whether different regions of macaque cortex represent different components of stochastic accumulator models.
Chapters III and IV will investigate visual and movement neurons in FEF (red). Chapter V will investigate the relationship between FEF and event-related potentials recorded over posterior visual cortex (blue). Chapter VI will investigate the role SEF (green).
1.6 Overview of studies
In the following chapters describe a series of experiments that test whether the neuronal populations described above could serve as the bridge loci for accumulator model processes. Each of the following chapters are published papers or in preparation for publication, and therefore each one is written as an independent entity. However, all papers are connected by a common theme in that they provide evidence for the identification of different neuronal populations with either a representation of perceptual evidence or evidence accumulation.
Chapter II does not directly evaluate potential bridge loci of accumulator model processes, but instead evaluates methods for comparing accumulator models to neural activity. The purpose of this study was to characterize accumulator model predictions for neural dynamics under a range of parameterizations. This is important preliminary step to identify neurons that implement evidence accumulation because noise can cause counterintuitive patterns of dynamics. This study will show that the mapping between model parameters and standard measures of neural dynamics is not one-to-one in the face of noise. In particular, with noise, patterns of predicted dynamics based on intuitions about noiseless accumulators can mislead interpretations of patterns of neurophysiology. These results suggest that model dynamics should be directly compared to
18
neural dynamics, which is the methodology followed in Chapters III and IV. This work is currently in preparation for publication.
Chapter III evaluates whether FEF visual neurons can be identified with a representation of perceptual evidence and whether FEF movement neurons can be identified evidence
accumulation. Following the methodology established in (Purcell et al., 2010), I will use visual neuron firing rates as input to a multiple accumulator model of search behavior. I found that a model that uses visual neuron firing rates as input can predict detailed search behavior. Next, following the methodology established in Chapter II, I will compare predicted model dynamics with observed movement neuron dynamics. I found that the model predicts the dynamics of movement neurons using parameters that were fit to behavior. This supports the identification of visual neurons with perceptual evidence and movement neurons with integration of evidence to threshold. This study is published in The Journal of Neuroscience (Purcell et al., 2012b).
Chapter IV further tests the link between model components and neuronal populations by analyzing the pattern of variability in FEF neurons during search. This study will show that the pattern of response variability in FEF movement neurons is consistent with the pattern of response variability predicted by accumulator models. In addition, this study evaluated how the variability of perceptual evidence may change under different conditions by analyzing the dynamics of visual neuron response variability. We found that the mean, but not the variability, of visual neuron firing rates is modulated by the strength of perceptual evidence. This indicates that evidence is encoded via signal enhancement rather than noise reduction. This study is published in Journal of Neurophysiology (Purcell et al., 2012c).
Chapter V tests the potential link between neuronal activity in posterior parietal cortex and FEF visual neurons through to represent perceptual evidence. To address this question, we recorded extracranial voltage potentials over posterior visual cortex simultaneously with
intracranial neuronal activity from FEF. One advantage of this approach is that ERPs can amplify the representation of perceptual evidence in posterior visual cortex by integrating neuronal
19
activity across many centimeters of cortex. In addition, by using a noninvasive technique, we can attempt to identify a potential index of perceptual evidence that can be measured in healthy humans. This study finds that potentials recorded over posterior visual cortex modulate in much the same way as FEF neurons and local field potentials. The timing of these modulations suggests that FEF may be a source of input driving the generators of these potentials. This study is published in Journal of Neurophysiology (Purcell et al., 2013).
Chapter VI tests whether SEF visual neurons represent perceptual evidence. Although data exist to suggest that SEF may not be directly involved in the accumulation of evidence to initiate saccades (Stuphorn et al., 2010), less is known about the role that SEF may play in representing perceptual evidence for a particular response. We recorded single unit activity and LFP from the SEF of monkeys performing a visual search task. Surprisingly, we found that SEF neurons do not represent the salience (top-down or bottom-up) of stimuli in their receptive field and therefore cannot be identified with perceptual evidence for a response. Instead, SEF neurons signal search errors. This suggests that accumulator model processes do not map onto any SEF neurons.
Instead, SEF may be involved in performance monitoring processes that are used to adjust performance on subsequent trials. This study is published in The Journal of Neuroscience (Purcell et al., 2012a)
Each study addresses the degree to which particular neurophysiological signals could correspond to accumulator model processes. In some cases, the studies support a close mapping between models and physiology. However, this work also highlights several limitations
underlying the assumption that simple cognitive models will map cleanly onto discrete neural elements. In the final section (Chapter VII), I will discuss open questions that are raised by this work and address potential future approaches with which they could be answered.
20 CHAPTER II
MIMICRY IN MODEL DYNAMICS: RELATING STOCHASTIC ACCUMULATOR MODEL PARAMETERS TO NEURAL DYNAMICS
2.1 Abstract
Accumulator models explain perceptual decisions as the accumulation of evidence to a response threshold. The relationship between model parameters and predicted behavior is well known, but the relationship between model parameters and accumulator dynamics has received less attention because dynamics were assumed to be unobservable. The recent identification of neuronal activity with the accumulation process suggests that neural dynamics could be used as a tool for model selection. We characterized the expected patterns of neural dynamics using different accumulator model parameters to determine when different sources of behavioral variability can be distinguished via observed dynamics. Whereas the mapping between model parameters and dynamics is straightforward in the absence of noise, we found that noise complicates this relationship. When noise is moderate to large, changes in the model starting point and threshold could be easily identified through model dynamics, but changes in drift rate were nearly indistinguishable from changes in the start time of the accumulation (i.e., the encoding delay). We suggest an alternative method for distinguishing changes in drift rate and encoding delay based on the across-trial variability of model dynamics. These results inform the interpretation of neurophysiological signals identified with evidence accumulation and suggest that researchers should directly compare neural dynamics to model dynamics, and not model parameters.
2.2 Introduction
Cognitive models allow us to infer the basic processes underlying simple perceptual tasks (Townsend and Ashby, 1984; Busemeyer and Diederich, 2009). These models decompose
21
response time (RT) into distinct processes (Meyer et al., 1988; Sternberg, 2001). Accumulator models (also termed sequential sampling models) currently provide the most complete account of perceptual decision-making behavior (Ratcliff and Smith, 2004). These models assume that perceptual evidence for a particular response is integrated over time by one or more
accumulators. A response is selected when evidence reaches a threshold or boundary. These models can explain RT distributions for both correct and error saccades for a range of perceptual tasks.
Several parameters determine accumulator model predictions. For example, a drift rate parameter defines the mean rate of accumulation, a threshold parameter defines the level of evidence that must be reached for a response to be initiated, and a starting point parameter determines the initiate state of accumulation. Often, parameter values are selected to maximize the match between observed and predicted behavior. The resulting values can then be used to infer the processes that generated behavior. However, model parameters also determine the dynamics of the accumulation process that unfolds over time. Less attention has been paid to the relation between model parameters and dynamics because these dynamics were assumed to be unobservable mental operations.
Recently, several groups have begun to investigate potential linking propositions between accumulator models and neurophysiological measures (Schall, 2004; Smith and Ratcliff, 2004;
Gold and Shadlen, 2007). During decision-making tasks, the firing rates of neurons in frontal eye field (Hanes and Schall, 1996), superior colliculus (Ratcliff et al., 2003), lateral intraparietal area (Roitman and Shadlen, 2002), and premotor cortex (Cisek, 2006) have been identified with accumulation to a threshold. Other groups have identified event-related potentials (ERPs) that seem to reflect the evidence-integration process. During certain perceptual decisions, ERPs recorded over parietal cortex demonstrate dynamics consistent with evidence accumulation (O'Connell et al., 2012). In addition, the lateralized readiness potential (LRP), an ERP related to
22
motor preparation, has been identified with accumulation to a response boundary (Gratton et al., 1988; De Jong et al., 1990; Osman et al., 2000; Rinkenauer et al., 2004; Schurger et al., 2012).
If valid linking propositions can be identified, then accumulator dynamics could be directly observed. This means that accumulator model dynamics that are generated by parameter values fit to behavior could be interpreted as predictions for neural dynamics. If the mapping between model parameters and model dynamics is one-to-one, then predictions for changes in neural dynamics could be derived directly from changes in model parameters. For example, if the model requires a change in drift rate to predict behavior, then one might assume a change in growth rate of underlying spike trains must have occurred. Likewise, if appropriate
neurophysiological data are collected, then one might be able to infer changes in parameters simply by analyzing the neural dynamics. For example, if the growth rate of spike trains changes across stimulus conditions, then one might assume that accumulator models will require changes in drift rate to explain behavior.
One potential problem with this approach is that the mapping between model parameters and model dynamics may not be one-to-one. This isn’t a problem for deterministic models in which evidence accumulation is ballistic (Brown and Heathcote, 2005; Brown and Heathcote, 2008), but many accumulator models assume that evidence is noisy (e.g., Usher and McClelland, 2001; Ratcliff and McKoon, 2008; Smith and Ratcliff, 2009). Furthermore, noise is ubiquitous in neural activity (Faisal et al., 2008). Given sufficient levels of noise, it is possible that different model parameters could predict indistinguishable changes in model dynamics. In other words, the models may exhibit mimicry at the level of dynamics rather than behavior. However, the degree to which this is a problem for the noise levels typically assumed by accumulator models is an open question.
The goal of this study was to characterize the relationship between accumulator model parameters and dynamics. This is a crucial intermediate step towards understanding the relationship between model parameters and neural dynamics that has been unaddressed in
23
previous work. Previous studies have directly compared the model dynamics with neural dynamics (Mazurek et al., 2003; Ratcliff et al., 2003; Boucher et al., 2007; Ratcliff et al., 2007;
Purcell et al., 2010; Purcell et al., 2012b), but the relation to model parameters was not always clear. For example, Purcell et al. (2010) showed that accumulator models predict the firing rates of certain frontal eye field neurons during perceptual decisions, but the effect of specific
parameters on accumulator dynamics was unclear because the models assumed a complex, time- varying drift rate. Other studies have reported model dynamics for sets of parameters that were fit to behavioral data (e.g., Ratcliff et al., 2003; Ratcliff et al., 2007), but it is difficult to know which parameters contributed to which aspects of the dynamics without systematically manipulating the value of individual parameters.
In order to characterize the relationship between parameters and dynamics, we quantified four measures of model dynamics (onset, growth rate, baseline, and measured threshold) that would be expected to correspond to model parameters. These measures of model dynamics were based on established methods that have been applied to neurophysiological data in previous studies (Woodman et al., 2008; Purcell et al., 2010; Purcell et al., 2012b). If the mapping between parameters and dynamics is one-to-one, then variation in certain parameters should correspond to variation in specific measures of dynamics. This would mean that model
parameters could be uniquely identified with specific neural dynamics. Alternatively, when noise is present, changes in one parameter may result in changes in one or more measures of dynamics.
If so, then measures of neural dynamics cannot be uniquely identified with one parameter. This would mean that inferring changes in a specific model parameter based on changes in a specific measure of model dynamics may be invalid.
We find that when models include noise, the mapping between some model parameters and model dynamics is not one-to-one. In particular, noisy accumulator models will predict variability in the growth rate and onset of dynamics regardless of actual sources of across-trial variability. This can lead to changes in the measured onset across conditions even if the actual
24
encoding delay is unchanged. We suggest two alternative methods for identifying changes in the model encoding delay in the face of noise. In addition, we find that when models are noisy, parameters such as leakage, feed-forward inhibition, and lateral inhibition become very difficult to distinguish at the level of model dynamics. Altogether, these results suggest that, in general, model parameters should not be compared directly to neural dynamics.
2.3 Method
2.3.1 Overview of models
Different accumulator models make different assumptions about the nature of evidence accumulation. We first evaluated a general independent race model architecture in which one accumulator is assumed to accumulate evidence for a single response. If multiple responses are present, then multiple accumulators race to threshold to determine which response is executed and the time at which it is executed. This model is similar to several existing models that assume noisy independent accumulators for each response (Vickers, 1970; Smith and Van Zandt, 2000).
If this model includes no intra-trial noise, then it is similar to the linear ballistic accumulator model (Brown and Heathcote, 2008; Palmer et al.) or LATER model (Reddi & Carpenter, 1995).
We also evaluated a bounded race model that assumes a single accumulator with boundaries in both the positive and negative directions representing alternative responses. This model is similar to the well-known drift-diffusion model (Ratcliff, 1978; Ratcliff and Rouder, 1998). Results for the bounded model were highly similar to the independent race model, and therefore we
summarize them in the Appendix (Figure A.1-A.3).
All accumulator models share several common assumptions. We use the term primary parameter to refer to parameters that determine basic properties of the accumulation process under a single experimental condition (Donkin et al., 2011). Accumulator models assume four primary parameters. First, the drift or drift rate (v) determines the mean rate of accumulation.
This parameter is assumed to reflect the strength of sensory evidence for a particular response;