Neurobiological Markers of Rhythm Perception in Children with Specific Language Impairment
Leyao Yu Vanderbilt University
Music Cognition Lab
Mentor: Reyna L. Gordon
Abstract
The possible links between music and language continue to intrigue researchers, who have been
investigating on their similar structures and potentially shared neural mechanisms. In children with typical development (TD), rhythm sensitivity was found to be positively correlated to grammar ability, and regular musical rhythm had a potentially positive influence on their subsequent spoken grammar task performance. Children with Specific Language Impairments (SLI), on the other hand, were found to have deficits in rhythm and meter perception along with the impairments in their lexical and grammatical abilities. The study tested the potential difference in rhythm processing between group of TD and group of SLI, and investigated the correlations between beat perception sensitivity between neural oscillations and expressive language measures. Eighteen children with SLI and sixty-six age-matched children with TD listened to regular beats with different placement of stress. Brain oscillations were measured using EEG system. The results suggested that the group of SLI was less sensitive in beat perception than the group of TD, and a shared neural processing for rhythm and grammar might exist. The findings of neural oscillations were interpreted in the framework of Dynamic Attending Theory. Complementing ongoing studies in the lab, the findings would facilitate future research on the early identification and intervention of SLI.
Keywords: Specific Language Impairment (SLI), language development, rhythm perception, EEG
Introduction
SLI: Definition and Importance
Specific Language Impairment (SLI) is a language disorder that represents impairments in the acquisition and use of language in children who have no hearing loss or other obvious cause of developmental delay (Hulme & Snowling, 2009). SLI negatively influences children’s physical and psychological well-being, autonomy, parent relationships, and social support (Hubert-Dibon, Bru, Le Guen, Launay, & Roy, 2016).The prevalence of SLI for kindergartners in the upper Midwestern region of the United States was 7.4% (Tomblin et al., 1997), with 71% of the population previously undiagnosed.
There is an urgent need to increase the identification and treatment of SLI (National Academy Report, 2016).
Language Development in Children with SLI
Children with SLI have a delayed onset and slow rate of development of word production and language comprehension. In general, children with SLI have delays on both lexical (word-level) skills and grammatical abilities (Hulme & Snowling, 2009). Possessing a limited range of words for their age, children with SLI can encounter the lexical problems such as difficulty in finding the right word and acquisition of verb and tenses. Regarding grammar abilities, children with SLI typically have difficulties in comprehending and producing both syntax and morphology. Studies argued that children with SLI exhibit specific deficits in learning verb morphology and complex syntax (Hulme & Snowling, 2009;
Schuele & Tolbert, 2001). Our study will primarily focus on grammatical deficits and their correlation with musical rhythm under the umbrella of temporal processing capacities.
Etiology of grammatical deficits in SLI
Brain abnormalities were found in children and adults with SLI (Badcock, Bishop, Hardiman, Barry, & Watkins, 2012; Ullman & Pierpont, 2005). Badcock et al., (2012) compared the fMRI imaging
of children with SLI and TD children scanned during a covert naming task and found that children with SLI showed an abnormal increase in grey matter and a reduction of functional activation in Broca’s area.
Atypical rightward asymmetry has also been reported in both anterior and posterior temporal cortex (De Fossé et al., 2004; Herbert et al., 2005). Ullman & Pierpont (2005) proposed that the impaired pathways bring a general procedural deficit, which could be observed in impaired processing of grammatical structures and temporal sequences, including syntax, morphology, and music (Corriveau & Goswami, 2009). More importantly, these studies proposed that the cause of brain abnormality in people with SLI involved genetic factors, which result in atypical structural asymmetries that in turn give rise to abnormal functional organization (Badcock et al., 2012; Bishop, 2009).
The neurobiology developed from these genetic factors may be a mediating endophenotype deficit in SLI (Badcock et al., 2012; Bishop, 2009; Dale, Harlaar, Hayiou-Thomas, & Plomin, 2010;
Hayiou-Thomas, Dale, & Plomin, 2013), though no consensus has been reached. Deficits at the genetic level may lead to abnormalities at the neuroanatomical level, which will then lead to speech and/or language impairments at the behavioral level. Moderate levels of heritability of Language Impairment (LI) were found on psychometrically defined SLI group at both 4 and 12 years in the twin studies (Hayiou-Thomas et al., 2013). In a review of genome-wide association (GWAS) studies of SLI and language traits in the general population (Reader, Covill, Nudel, & Newbury, 2014), methodologies and candidate genes were proposed; however, the role of rhythm in SLI was not addressed.
Limitations
Past research studies and reviews (Bishop, 2009; J. Bruce Tomblin, Hafeman, & O’Brien, 2003) about the risk factors and possible causes of SLI did not cover all aspects of the factors accounting for impaired linguistic and nonlinguistic functions in people with SLI. This paper presents an
interdisciplinary perspective which might help to gain further insight into the etiology of SLI. A
neurobiological comparison of rhythm perception in children with SLI and those with typical language development is presented in this paper.
Rhythm Processing and Speech Processing in TD and SLI
Recent work has shown the positive associations between musical rhythm processing and
grammar processing, indicating that rhythm adaptation ability could be a factor in spoken grammar skills.
The research conducted by Gordon, Jacobs, Schuele, & Mcauley (2015) showed that for typically developing school-aged children, rhythm perception skills and expressive grammar skills are strongly positively associated. For example, the performance on beat-based discrimination tasks of six-year-old children may predict the variance in performance on grammar items categorized by their complex syntax (i.e., subordinate, infinite, complement, and relative clauses) (Gordon, Jacobs, et al., 2015). Furthermore, studies show that musical rhythm with a strong beat structure can influence language states (Bedoin, Brisseau, Molinier, Roch, & Tillmann, 2016; Chern, Tillmann, Vaughan, & Gordon, 2018; Przybylski et al., 2013). This positive influence of rhythmically regular musical stimulation on grammar task
performance is called Rhythmic Priming Effect (RPE). Performance of children (SLI, dyslexia, and controls) on a grammaticality judgment task improved after temporally regular prime sequences compared to temporally irregular prime sequences. The benefit of a regular prime for SLI children is greater than for dyslexic children, but still small compared to the benefit for a control group (Przybylski et al., 2013). Based on the previous study, Bedoin et al. (2016) added a baseline condition with
environmental noise, demonstrating that the reported difference in temporally regular and irregular condition is due to a beneficial effect of the temporally regular prime, not due to a cost in processing the temporally irregular prime. Converging with recent work in French-speaking children (Przybylski et al., 2013), Chern et al. (2018) examined the differential influence of rhythmic regular and irregular musical stimuli on the performance of typical developing, English-speaking children in a subsequent grammar task. The result is consistent with previous studies, suggesting that RPE occurs not only in French, but
also in English, and likely other languages. The Chern et al. study suggests that RPE is a shared effect on rhythm and grammar rather than a general effect of music on cognition.
Moreover, co-morbidity of rhythm deficits and grammatical deficits in SLI found in the literature suggests that weakness in rhythm sensitivity may be a risk factor for SLI (Clément, Planchou, Béland, Motte, & Samson, 2015; Corriveau & Goswami, 2009; Corriveau, Pasquini, & Goswami, 2007;
Cumming, Goswami, Colling, Leong, & Wilson, 2015; Weinert, 1992.). Children with SLI are not only impaired in language processing but also in rhythm and meter perception. Corriveau et al. (2007) showed that children with SLI have difficulties in detecting both the amplitude rise time (ART) and duration of simple tones. The individual differences in the rise time and duration processing measures significantly account for variability in standardized measures of language and in measures of phonological awareness after controlling for age and IQ. Within-group correlations exist in children with SLI with age from 9 - 11. Along Corriveau et al. (2007), Cumming, Wilson, & Goswami (2015) found impaired sensitivity to amplitude rise time (ART) and impaired perception of duration in children with SLI (N=45, mean age = 9). Sensitivity to ART and duration were important for perceiving lexical stress. Based on the previous study that children with SLI have musical ability below age expectations (processing musical syntax:
Jentschke, Koelsch, Sallat, & Friederici, 2008; perceiving rhythm: Corriveau et al., 2007; Cumming, Goswami, et al., 2015; Cumming, Wilson, et al., 2015; producing music: Clément et al., 2015; Corriveau
& Goswami, 2009), Sallat & Jentschke (2015) showed that children with SLI have difficulties in perceiving changes in the pitch and rhythm of musical phrases. The performance level of preschool children with SLI was significantly below that of the age-matched controls in linguistic abilities and in rhythmic-melodic perception and rather similar to that of children with comparable linguistic abilities. In the melody recognition tasks, children with SLI performed below both control groups (age-match and linguistic-ability-match).
Framework
Both rhythm and grammar are governed under a hierarchical structure over a temporal span and both can require the listener to dynamically orient attention. Falk & Kello (2017) used rhythmically regular sentences as speech stimuli for the spoken utterance task and showed that neural phase entrainment is a cross-domain effect (also see the framework in Bedoin et al., 2016). The converging evidence for a role of rhythm in language can be considered in a framework of dynamic attending theory (Jones & Boltz, 1989), that certain rhythmic events will create anticipation of the upcoming beats, and thus lead to better discrimination performance. Neural oscillations synchronize with temporally organized stimuli and generate temporal expectancies for upcoming events by directing attention to specific points in time (Large & Jones, 1999). Quené & Port (2005) supported the framework of Large & Jones (1999) by showing that temporal expectancies increase attention toward the timing of stressed or accented syllables. English-speaking participants had significantly shorter reaction time in detecting on the stressed syllables with regular inner-stress timing than those who with irregular inner-stress timing.
Along with syntax and semantics, rhythm may aid listeners to comprehend speech signals by predicting when and what the important contents are coming in the sentences. Thus, in listeners with language disorders such as SLI, an inability to use rhythm efficiently, which would normally assist them in entraining their attention to periodicities in the speech signals, may interfere with speech processing and therefore cause delays in grammatical acquisition.
Rationale for Approach
Although studies have shown behavioral differences in rhythm perception in children with SLI and TD, it is not yet known whether there are differences in brain activity during rhythm listening in these two populations. As a part of the larger study in our lab, this line of research will investigate an objective biological marker in relationship with behavioral assessments to help us better understand the framework of dynamic attending theory. By further studying the correlation of the behavioral data and brain activity,
we hope to facilitate the diagnosis of and early intervention on the large undiagnosed population of children with SLI. This could also facilitate the use of musical rhythmic stimuli and metrical stimulation for therapeutic interventions or educational practices in the future.
Hypotheses
Here we will investigate the potentially different brain responses to rhythm between SLI and TD.
We hypothesize that children with SLI will be less likely to entrain their neural response to beat-based rhythms, which would explain their co-morbid rhythm and grammar deficits. More specifically, we expect (a) children with TD have a greater difference in brain responses to the beat-based rhythm than children with SLI and (b) a positive correlation exists in individual participants’ expressive language skills and their neural responses to beat-based rhythms.
Methods Participants
Eighty-four native English-speaking children (TD: N = 66; age range: 5.46 – 8.17 years; M = 6.65 years, SD = 0.85 years; 31 males; SLI: N = 18; age range = 5.29 – 8.08 years; M = 6.81 years, SD = 0.89 months; 12 males) participated in this study as part of a larger study on rhythm and language development. Parents signed informed consent and children gave verbal assent in accordance with the Vanderbilt University Institutional Review Board approval. Participants were recruited from a larger ongoing study examining rhythm and language. Children received a small toy, and parents received gift cards for compensation. Study data were managed and stored using REDCap electronic data capture tools (Harris et al., 2009).
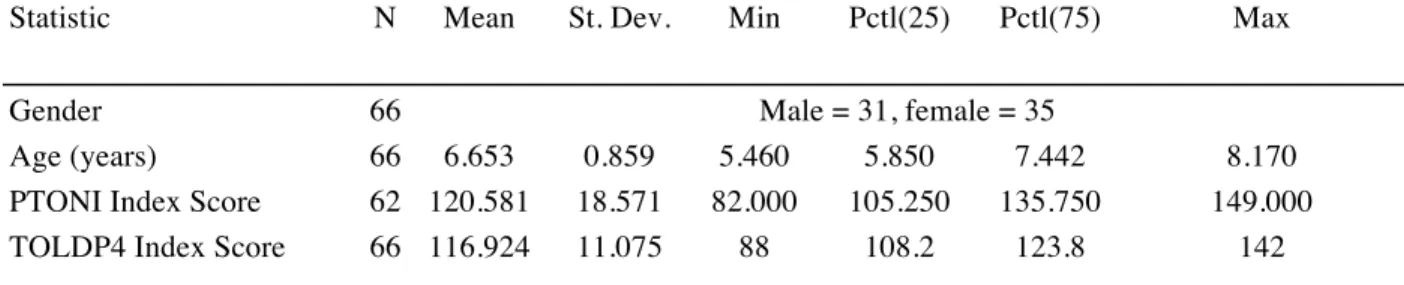
Table 1. Participants with TD Demographics
Statistic N Mean St. Dev. Min Pctl(25) Pctl(75) Max
Gender 66 Male = 31, female = 35
Age (years) 66 6.653 0.859 5.460 5.850 7.442 8.170
PTONI Index Score 62 120.581 18.571 82.000 105.250 135.750 149.000 TOLDP4 Index Score 66 116.924 11.075 88 108.2 123.8 142
Table 2. Participants with SLI Demographics
Statistic N Mean St. Dev. Min Pctl(25) Pctl(75) Max
Gender 18 Male = 12, female = 6
Age 18 6.808 0.885 5.290 5.922 7.507 8.080
PTONI Index Score 18 100.611 14.411 83 89.2 109.8 135
TOLDP4 Index Score 18 88.833 13.828 72 78 95.2 124
Screening Measures
Demographic. After consent was given, parents completed questionnaires about their child’s chronological age, grade, medical history, parents’ formal education, and musical background.
Hearing Screening. A bilateral pure-tone audiometry (20 dB SPL) at 1000, 2000 and 4000 Hz in each ear confirmed all participants had normal hearing. Participants who did not pass were informed and encouraged to contact their school or their pediatrician for a follow-up hearing screening.
Nonverbal IQ. To rule out intellectual disability, the Primary Test of Nonverbal Intelligence (PTONI; Ehrler & McGhee, 2008) was used to assess and control for age-normed nonverbal IQ.
Participants must score ≥78 (standard score) to qualify for the study.
A valid administration of the PTONI was not able to be conducted during the screening for four participants due to shyness or inattention. However, evidence of study eligibility could be derived from
clinical judgments and normal performances on other cognitive and language assessments. The overall spoken language index scores for four participants were within the normal range. When a PTONI score was not able to be correctly administrated, these scores ruled out global intellectual disability (Camarata
& Swisher, 1990).
Language Screening. The Test of Language Development - Primary - 4th Edition (TOLD-P4;
Hammill & Newcomer, 2008) consists of a series of receptive and expressive tasks that use verbal and picture prompts to measure vocabulary, syntax, and sentence imitation, yielding six quotients: Listening, Organizing, Speaking, Grammar, Semantics, and Spoken Language. Children must receive a standard score of 85 or less on two or more quotients among six to qualify for the SLI group (Average TOLD score over six quotients: TD Mean = 116.9, SD = 11.08; SLI Mean = 88.83, SD = 13.83 ). Scores below
criterion on the Screening probe of the Test of Early Grammatical Impairment (TEGI; Rice & Wexler, 2001) were also used to determine SLI eligibility. TEGI phonological probe was used to assess the presence of phonemes needed for valid administration of this screener. Two participants with SLI had scores on the TOLD-P4 that were not consistent with language impairment. However, they both had documented histories of speech-language therapy for expressive language difficulties, and were judged by clinical research staff to be appropriate for inclusion in the SLI cohort.
For the rest sixteen SLI participants, nine people had language profiles consistent with primary expressive language disorder, and seven had profiles consistent with mixed receptive-expressive language disorder. Clinical judgements were made from scores of subtests of the TOLD-P4. Subtests of Picture Vocabulary and Syntactic Understanding primarily were primarily used to assess receptive language.
Subtests of Relational Vocabulary, Oral Vocabulary, Sentence Imitation, and Morphological Completion were primarily used to assess expressive language.
Test of Expressive Grammar
Language Variable. The Structured Photographic Expressive Language-Test-3 (SPELT-3;
Dawson, Stout & Eyer, 2003) is used to measure children’s expressive grammar. Children are shown pictures and asked specific questions that are formulated to elicit answers in particular grammatical constructions.
Rhythm Perception
Children completed two rhythm measures: beat-based advantage assessment (BBA), a rhythm discrimination task, and the rhythm section of the Primary Measures of Music Audiation (PMMA;
Gordon, 1979). Since the BBA and PMMA are both rhythm discrimination tasks, the overall proportion correct for both tests were averaged into a Rhythm Composite Score (as in Gordon, Shivers, et al., 2015), which provides an index for perceptual rhythmic acuity.
BBA. The children’s BBA is a computer-based test based on the adult version developed by Grahn & Brett (2007). The test consists simple and complex rhythm sequences. For each trial, children heard two successive presentations of a standard rhythm and then judged whether a third rhythm was the same or different from the standard. The test was structured as a game using characters that were either
‘copycats’ or ‘different’ from each other, and this continued for 28 trials. Responses side-associations were counterbalanced across participants.
PMMA. The rhythm section of the PMMA is a computer-based test in which children hear two melodies with same, single pitch but varying in duration. Children judged whether the rhythmic patterns were the same or different. The test is structured as a game in which correct answers help a dog advance to its home, and this continues for the entire set of 40 trials.
Electroencephalography
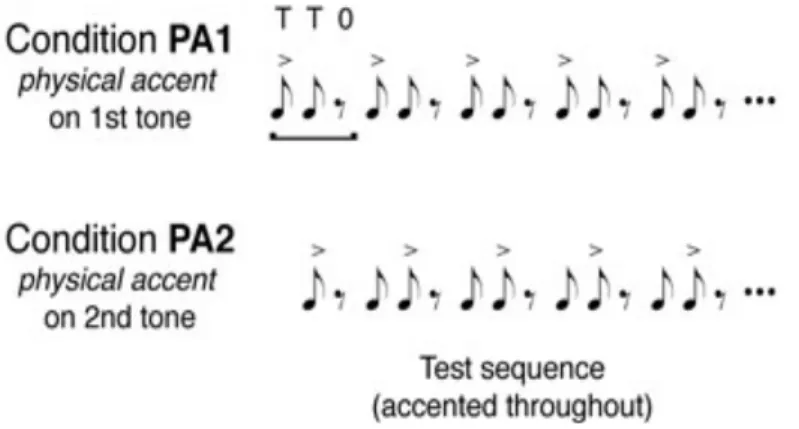
Stimuli. Auditory stimuli were recorded in woodblock sound adapted from the paradigm in the research of Iversen, Repp, & Patel (2009) (Figure. 1). The first condition, PA1, is the strong-weak-rest
tone sequence, with the accent on the first tone; and the second condition, named PA2, is the weak- strong-rest tone sequence, with the accent on the second tone. Each tone sequence has a duration of 600 ms. Nine blocks of each condition, with forty-eight tone sequences forming a block, were played
continuously in random order. Each stimulus presented through a speaker positioned above the midline of the child’s head and matched in loudness, while the child was watching an age-appropriate silent movie.
EEG was obtained while participants listened passively to auditory tone sequences.
Figure 1. Experiment paradigm. Two conditions (PA1: accented tone – tone – rest; PA2: tone – accented tone – rest) were presented to subjects.
(Iversen et al., 2009)
EEG Acquisition. Electroencephalographic (EEG) recordings of children with TD (N = 66) and children with SLI (N = 18) were collected individually in a sound-dampened room at the EEG Lab at the Vanderbilt Kennedy Center. Continuous EEG was recorded using a 124 Ag/AgCl electrodes embedded in soft sponges (EGI Geodesic Sensor Net). Lower eye channels were excluded. EEG signals were sampled at 500 Hz for temporal precision. Data was acquired in Net Station 4.4.2 before an update of the EEG acquisition system on 11/9/2016, then was acquired in Net Station 5 with amplifier upgrade from
NetAmps 200 to NetAmps 400 without changing in nets after the update. 6 SLI participants and 27 TD of the total 84 participants collected in NS 4.4.2 were acquired with a hardware filter of 0.01 to 200 Hz, and participants on NS 5 were acquired without the hardware filter. Therefore the same filter of 0.01 – 200 Hz was applied to participants on NS5 offline before any other filtering. The entire session last around 10
minutes. No behavioral responses were required. To facilitate cooperation during data acquisition, an age- appropriate video with muted sound was shown to participants.
Data Preprocessing
Offline processing of EEGs was performed using EEGLAB (Delorme & Makeig, 2004). Signals were smoothed using a 55-Hz low-pass filter. An IIR filter of 0.1 Hz was then applied to get rid of the drifting effect. Data were referenced to the average of the left and right mastoids. Next, line noise was cleaned using clean_line function. Bad electrodes characterized by consistently high noise levels were replaced using the spherical spline interpolation algorithm (Perrin, Pernier, Bertrand, & Echallier, 1989).
The data were then cleaned using Individual Component Analysis (ICA) to eliminate the cardiac and ocular artifacts. Next, data were divided into 1200-ms sections with the interval of [-400, + 800] time lock to the stimulus onset. Trials with 15 or more artifacts including eye blinks, movements, or bad channels were rejected. For event-related potential analysis, data were baseline-corrected with the baseline of [-100, 0] ms and averaged across trials for each stimulus condition.
Data Analysis
After EEG preprocessing, individual ERPs were exported to MATLAB R2017a (The Mathworks Inc., 2017). To study the entrainment effect, the synchronization of neural oscillations with temporally organized stimuli (Large & Jones, 1999),event-related potential (ERP) analysis was done by using Fieldtrip Toolbox (Oostenveld, Fries, Maris, & Schoffelen, 2011) at the time window [-100, +500]. ERP elicited by PA1 were subtracted from those elicited by PA2, thus revealing the difference between the conditions. Next, cluster-based permutation tests (Maris & Oostenveld, 2007) were used to examine the statistical significance across condition. The same method was used to examine the group differences between children with SLI and children with TD in the difference waves.
Brain-behavior correlation between the individual differences in neural response and expressive grammar scores measured by SPELT-3 was analyzed. Since the index score of SPELT-3 reflects the global expressive grammar ability, we grouped scores for various grammatical aspects to unpack the subtle differences in children’s grammatical performance. The categories were defined as in Gordon, Jacobs, et al. (2015). The study was in particular interested in the categories of complex syntax and transformation. The complex syntax category contained multiclausal items and the transformation category contained interrogative, passive, and negation items. Both categories were shown to have correlations with behavioral rhythm measures (Gordon, Jacobs, et al., 2015). For EEG data, the sum under significant time period provides a measure of the magnitude of differences under conditions over time (Lense, Gordon, Key, & Dykens, 2014). Voltage of difference waves were summed up individually for both groups under the time window of clusters with statistical significance in the group of TD. Then Pearson correlation coefficients in Rstudio (Rstudio Team, 2015) were used to document the correlation between individual sum and SPELT scores.
Results
Within-group difference
The difference of ERP between PA1 and PA2 was analyzed using cluster-based permutation tests.
Results reveal a significant difference between the two conditions. On the first tone, the TD group elicited a greater response in PA1 than in PA2 (p < .001, Figure 2a); the difference between the two conditions was not significant in the SLI group (Figure 2b). On the second tone, both SLI and TD groups elicited a greater response in PA2 than in PA1 (TD: p < .001, SLI: p = .04, see Figures 2a, 2b). Figure 3a, b and c showed SLI and TD’s significant clusters in timestep over central-parietal regions of the scalp.
The TD group revealed similar differences between PA1 and PA2 on evoked beta and gamma activity. In both frequency bands, we found a greater response in PA1 than in PA2 on the first tone and a greater response in PA2 than in PA1 on the second tone (both p < .001, see Figures 4a, 4b).
Although SLI’s evoked gamma activity had no or marginal difference between conditions, the evoked beta elicited a greater percentage of change in PA1 than in PA2 on the first tone (p = .03, see Figure 4c, d).
Figure 2a. Grand average ERP of TD (N = 66). Figure 2b. Grand average ERP of SLI (N = 18)
Blue line represents PA1 (strong-weak-rest), red line represents PA2 (weak-strong-rest), and black line represents the difference between condition.
0 100 200 300 400 500
-3 µV -2 µV -1 µV 0 µV 1 µV 2 µV
3 µV SLI Grandaverage Event-related Potential (N = 18) PA1
PA2 Difference
Time from stimulus onset (ms)
0 100 200 300 400 500
-3 µV -2 µV -1 µV 0 µV 1 µV 2 µV
3 µV TD Grandaverage Event-related Potential (N = 66) PA1
PA2 Difference
Time from stimulus onset (ms)
Figure 3
Figure 3a. Positive cluster in timestep in TD. Latency: 62 - 200 ms. Significant channels are marked in white. 3b. Negative cluster in TD.
Latency: 206 - 398 ms. 3c. The only significant positive cluster in SLI. Latency: 412 - 500 ms. No significant difference was found between PA1 and PA2 on the first tone. Color bar shows the difference between conditions in µV.
Figure 4a, 4b.
Evoked responses in TD (10 – 50 Hz) of PA1 and PA2.
Figure 5c, 5d.
Evoked responses in SLI (10 – 50 Hz) of PA1 and PA2. For the color bar, 1 stands for 100%.
Figure 4
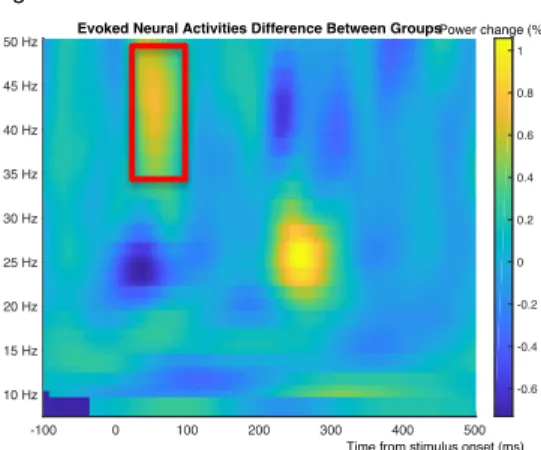
Figure 5. Between group difference in evoked gamma activity were found in the range of 35 – 50 Hz for 40 ~ 80 ms, marked by the red rectangle.
Between-group difference
To compare the onset amplitude and latency between groups, difference waves were computed separately for the two groups by subtracting individual ERPs and evoked responses of PA2 from PA1 (Figure 5). It was suggestive that SLI and the TD groups had group differences on evoked gamma activity (p = .08). Starting at 50 ms after the onset of the first tone and ending around 100 ms, the cluster indicated that there was a smaller difference in gamma activity between conditions in the SLI group than in the TD children.
Induced beta and gamma
Figure 5 showed that SLI and TD have potential difference between 200 ~ 300 ms interval on 20 ~ 30 Hz frequency band, but cluster-based permutation analysis did not show that such difference is significant.
We would like to further examine the differences, and were also interested in the different roles played by beta and gamma bands activity. Therefore, beta and gamma activity in epochs were extracted and
averaged across participants in both groups. Induced beta activity resembled the onset and amplitude of the grand average ERP, while induced gamma activity reflected non-phaselocked, single-trial brain responses to the auditory stimuli (Figure 6 a-d).
-100 0 100 200 300 400 500
10 Hz 15 Hz 20 Hz 25 Hz 30 Hz 35 Hz 40 Hz 45 Hz
50 Hz Evoked Neural Activities Difference Between Groups
-0.6 -0.4 -0.2 0 0.2 0.4 0.6 0.8 1 Power change (%)
Time from stimulus onset (ms)
Figure 5
Brain-behavior correlation
To relate cluster-based permutation results to the behavioral measures, cluster sums were calculated. We tested the construct validity by testing the correlation between behavioral rhythm
composite and cluster sums. A positive correlation was found between behavioral rhythm composite and the difference of positive evoked beta cluster sums across conditions after controlling for age (p = .049, df
= 62, R = 0.24, Figure 7a).
Partial correlations were run between expressive language measures and cluster sums. A marginally significant negative correlation was found between complex syntax and the difference of negative ERP cluster sums after controlling for age (r(84)= -0.21, p = .06; Figure 7b). Based on other publications, we expected to find a correlation between rhythm and the Transformation items on the
0 100 200 300 400 500
-0.2 µV -0.15 µV -0.1 µV -0.05 µV 0 µV 0.05 µV 0.1 µV 0.15 µV
0.2 µV TD Induced Beta Acitivities
PA1 PA2
Time from stimulus onset (ms)
0 100 200 300 400 500
-0.1 µV -0.08 µV -0.06 µV -0.04 µV -0.02 µV 0 µV 0.02 µV 0.04 µV 0.06 µV 0.08 µV
0.1 µV TD Induced Gamma Acitivities
PA1 PA2
Time from stimulus onset (ms)
0 100 200 300 400 500
-0.2 µV -0.15 µV -0.1 µV -0.05 µV 0 µV 0.05 µV 0.1 µV 0.15 µV
0.2 µV SLI Induced Beta Acitivities
PA1 PA2
Time from stimulus onset (ms) -0.1 µV 0 100 200 300 400 500
-0.08 µV -0.06 µV -0.04 µV -0.02 µV 0 µV 0.02 µV 0.04 µV 0.06 µV 0.08 µV
0.1 µV SLI Induced Gamma Acitivities
PA1 PA2
Time from stimulus onset (ms)
Figure 6a - d
Figure 6a, 6b. Induced beta and gamma activity in the group of TD. Figure 7c, 7d. Induced beta and gamma activity in the group of SLI.
SPELT-3 (Gordon, Jacobs, et al., 2015), but there was no significant correlation between transformation and cluster sums (see Table 3).
In addition, we wanted to know if there was any subgrouping in our SLI cohort. Previous studies have shown that the comorbidities of grammar and music do not necessarily happen to every child with SLI (Bedoin et al., 2016; Peretz et al., 2012). Since children with expressive deficits may not have any impairment in their receptive domain, children with mixed deficits of language impairment may have less beat perception sensitivity than children with expressive deficits. Unpaired t-tests were applied to
examine the potential group difference in neural activity. No significant difference were found among groups (Figure 8a, 8b).
Figure 7a. The positive beta cluster sum relates to rhythm composite scores (r(62) = .27, p < .05). The positive beta cluster sum was a measure for beat perception sensitivity. 7b. It is suggestive that the negative cluster sum of ERP is correlated with complex syntax.
Figure 8a, 8b. Scatterplot of cluster sums for children with different types of deficits in the group of SLI. No significant difference were found among groups.
Red = Mixed Deficits Blue = Expressive Deficits Black = Other
Table 3.
Discussion
In this thesis we set out to investigate the potential difference in neural activity during beat perception between children with SLI and TD. The study aimed to compare children with SLI and their typically developing peers’ neural responses to two sets of tone sequences with different placements of strong beats, and to investigate the association between the individual neural activity and expressive language ability. The data showed that children with SLI have less beat perception sensitivity than children with TD, and individual neural responses could be related to individual behavioral beat perception ability and language processing and production abilities. This results aligned with previous studies showing associations between musical rhythm processing and grammar processing in both typical developing children (Bedoin et al., 2016; Gordon, Jacobs, et al., 2015; Przybylski et al., 2013), and
Table 1
Means, standard deviations, and correlations with confidence intervals
Variable M SD 1 2 3 4 5 6
1. Spelt Standard
Score 111.15 12.99
2. Spelt Complex
Syntax 9.55 2.30 .77**
[.66, .84]
3. Spelt
Transformation 9.24 1.94 .89** .74**
[.84, .93] [.62, .82]
4. Rhythm
Composite Score 68.70 11.45 .46** .39** .49**
[.25, .63] [.16, .57] [.28, .65]
5. Positive Beta
Cluster Sum 6717.06 7470.14 .13 .12 .12 .27*
[-.09, .33] [-.09, .33] [-.09, .33] [.03, .48]
6. Positive Gamma
Cluster Sum 3846.86 4607.44 .16 .13 .11 .11 .45**
[-.05, .37] [-.08, .34] [-.10, .32] [-.13, .34] [.26, .61]
7. Negative ERP
Cluster Sum -6135.54 5056.70 -.07 -.19 .02 -.18 -.15 -.13
[-.28, .14] [-.39, .03] [-.19, .24] [-.40, .06] [-.35, .07] [-.34, .08]
Note. M and SD are used to represent mean and standard deviation, respectively. Values in square brackets indicate the 95% confidence interval for each correlation. The confidence interval is a plausible range of population correlations that could have caused the sample correlation (Cumming, 2014). * indicates p
< .05. ** indicates p < .01.
comorbidities of rhythm deficits and grammar deficits in SLI (Clément et al., 2015; Corriveau &
Goswami, 2009; Corriveau et al., 2007; Cumming, Goswami, et al., 2015).
Beta band’s metrical interpretation role
The study has found significant within-group differences across conditions. The difference elicited on the first tone is different from the difference on the second tone, and the response to the weak beat in PA2 resembles the response to the accented beat. More specifically, the envelops of induced beta retained the asymmetrical shape, suggesting that beta activity may account for metrical interpretation. The findings are in line with previous studies examining beta waves (Cirelli et al., 2014; Fujioka, Trainor, Large, & Ross, 2009, 2012; Iversen et al., 2009; Zanto, Snyder, & Large, 2009). Although the ranges of beta activity
were defined differently, these studies defined beta with the mean around 20 Hz, which is within the range of investigation of the current study. Iversen et al. (2009) suggested that beta activity (20 ~ 30 Hz) function both bottom-up and top-down control in metrical interpretation. The current study clearly adds evidence to the bottom-up processing of metrical structure in beta bands. The positive correlation between neural correlates in evoked beta activity and the rhythm composite scores further suggests beta’s role of metrical interpretation.
Reason behind asymmetry
In addition, Iversen et al. (2009) proposed two possible explanations for the asymmetrical differences across conditions, summarizing as first tone advantage and non-beat enhancement. The findings in this study support the second explanation by observing a significantly positive cluster on the 200 ms rest, with the latency lasting to around 50 ms prior to the onset of next tone sequence. The cluster indicated that PA2 had a greater negativity than PA1 during the rest, and this suppression of the response in PA2 elicited a greater response on the upcoming beat. Greater response in PA2 than in PA1 was
observed 50 ms prior and 50 ms after the onset (Figures 1, 2), suggesting the neural response to the onset of PA2 might be a combination of the enhancement from suppression and the actual response to the auditory stimuli.
Metrical expectancy
The study has found that the increase of responses preceding the tone onsets in both evoked beta and gamma activity, featured by the early latency of significant clusters. The findings showed that entrainment is not an age-specific effect for dynamic attending theory (Large & Jones, 1999), and aligned with previous studies which suggested that the 20 ~ 60 Hz frequency band was capable of facilitating people to form metrical expectancy endogenously and exogenously generating neural oscillations similar to metrical structure in adults (Fujioka et al., 2009; Iversen et al., 2009; Zanto et al., 2009) and children (Cirelli et al., 2014). Given that there was not an explicit task demand during the rhythmic listening, the current study suggests that children with typical and atypical language developments are both capable of forming metrical expectancy with exogenous auditory stimuli. Therefore, there are be some underlying mechanisms of metrical expectancy that are shared between TD and SLI children, and both groups are able to gain benefit from such metrical expectancy. Moreover, this finding suggests that there might be other underlying neural mechanisms that affect the rhythm perception ability in children with SLI, especially the ability to gain benefits from entrainment effect. RPE studies (Bedoin et al., 2016; Chern et al., 2018; Przybylski et al., 2013) have shown that both groups had a positive influence on the grammar tasks after listening to temporally regular prime sequences, though the group of SLI had a smaller benefit compared to the group of TD. Although research speculated that the impaired neural entrainment effect in the SLI population caused the smaller benefit (Bedoin et al., 2016; Corriveau & Goswami, 2009), our study suggests that the SLI population may not have an impaired neural entrainment to auditory stimuli, although the group of SLI did not have some clusters that the group of TD had. For example, the group of SLI did not perceive the first tone in two condition differently, as shown in both figure of ERP and
cluster-based permutation results. However, the cluster-based permutation test might have a smaller statistical power for a small sample size of eighteen participants compared to a larger sample size of sixty-six participants. In this case, it is worth further exploring other factors that affect the difference of benefits obtained from RPE, possibly in procedural memory system (Ullman & Pierpont, 2005) and basal ganglia with a larger sample of SLI (Kotz, Schwartze, & Schmidt-Kassow, 2009).
Rhythm perception sensitivity
The study interpreted a greater distinction across conditions as a greater sensitivity in perceiving beats. The marginal group difference between the SLI group and the TD group on evoked gamma activity suggested that children with SLI were less sensitive than children with TD in perceiving the difference of auditory stimuli. Aligning with it, the negative correlation between individual negative ERP cluster sums on the second tone and complex syntax suggested a positive correlation between beat perception
sensitivity and ability to acquire complex syntax. In agreement with the reported correlations between language and music (Corriveau et al., 2007; Falk & Kello, 2017), the study indicates the shared neural basis between rhythm and grammar. These findings thus suggest that it will be interesting to further exploit the association between beat perception and language skills in different age groups, aiming to identifying language impairment in the early stage in childhood or infancy, and in particular increase the chance of early intervention.
Limitations
The study has a few limitations to be noted. First, the heterogeneity of the group may have led to low statistical power to detect effects, and thus future studies require a larger group of children with SLI.
Our SLI cohort did not have much variability in terms of the levels of symptoms; they showed moderate symptoms overall. Future studies should collect data from moderate-severe and severe SLI populations, in order to examine group differences between children with SLI and children with TD. Secondly, the study
did not address the direction of causality. If rhythm is linked to language development, poor rhythm perception ability could cause delayed grammar development; children with poor grammar ability could also result in weaker neural entrainment if the poor grammar ability restrains their childhood music experience. Future studies can apply longitudinal measures to unveil the direction of causality. Thirdly, EEG does not have a good spatial resolution, which limits our insight into neural sources of the activity, making it difficult to compare with other brain studies on SLI. Future studies can use fMRI and source analysis to further investigate potential impairment in neural pathways.
Conclusion
This study measured the oscillatory neural activity to tone sequences in children with SLI and their typical developing peers. The predictive nature of neural oscillations supported the dynamic attending theory. Taken together, the characteristics of evoked and induced beta-band responses provide evidence for a system capable of making predictions and encoding metrical patterns; in contrast, the characteristics of evoked and induced gamma-band responses only revealed its anticipatory nature to exogenous auditory stimuli. The findings were consistent with the previous literature on neural
entrainments and roles of frequency bands. Behavioral correlations with expressive language scores took an important first step the usage of passive auditory rhythms tasks to investigate early-onset language disorders, but only suggestive evidence was found in favor of differences between neural entrainment to rhythm in children with SLI and their TD peers. Taken together, the study provided new evidence to the shared neural basis of rhythm and grammar. Future research should aim to investigate beat perception with a developmental trajectory, localize neural sources and further probe the difference in gamma activity between typically and atypically developing children.
References
American Psychological Association. (2010). APA Sixth Edition. American Psychological Association.
https://doi.org/10.1006/mgme.2001.3260
Badcock, N. A., Bishop, D. V. M., Hardiman, M. J., Barry, J. G., & Watkins, K. E. (2012). Co-localisation of abnormal brain structure and function in specific language impairment. Brain and Language.
https://doi.org/10.1016/j.bandl.2011.10.006
Bedoin, N., Brisseau, L., Molinier, P., Roch, D., & Tillmann, B. (2016). Temporally regular musical primes facilitate subsequent syntax processing in children with Specific Language Impairment. Frontiers in Neuroscience.
https://doi.org/10.3389/fnins.2016.00245
Bishop, D. V. M. (2009). Genes, cognition, and communication: Insights from neurodevelopmental disorders.
Annals of the New York Academy of Sciences. https://doi.org/10.1111/j.1749-6632.2009.04419.x
Camarata, S., & Swisher, L. (1990). A Note on Intelligence Assessment Within Studies of Specific Language Impairment. Journal of Speech, Language, and Hearing Research. https://doi.org/10.1044/jshr.3301.205 Chern, A., Tillmann, B., Vaughan, C., & Gordon, R. L. (2018). New evidence of a rhythmic priming effect that enhances grammaticality judgments in children. Journal of Experimental Child Psychology.
https://doi.org/10.1016/j.jecp.2018.04.007
Cirelli, L. K., Bosnyak, D., Manning, F. C., Spinelli, C., Marie, C., Fujioka, T., … Trainor, L. J. (2014). Beat- induced fluctuations in auditory cortical beta-band activity: Using EEG to measure age-related changes. Frontiers in Psychology, 5(JUL), 1–9. https://doi.org/10.3389/fpsyg.2014.00742
Clément, S., Planchou, C., Béland, R., Motte, J., & Samson, S. (2015). Singing abilities in children with specific language impairment (SLI). Frontiers in Psychology. https://doi.org/10.3389/fpsyg.2015.00420
Corriveau, K., & Goswami, U. (2009). Rhythmic motor entrainment in children with speech and language impairments: Tapping to the beat. Cortex, 45(1), 119–130. https://doi.org/10.1016/j.cortex.2007.09.008 Corriveau, K., Pasquini, E., & Goswami, U. (2007). Basic Auditory Processing Skills and Specific Language Impairment: A New Look at an Old Hypothesis. Journal of Speech, Language, and Hearing Research.
https://doi.org/10.1044/1092-4388(2007/046)
Cumming, R., Goswami, U., Colling, L. J., Leong, V., & Wilson, A. (2015). Awareness of rhythm patterns in speech and music in children with specific language impairments. Frontiers in Human Neuroscience.
https://doi.org/10.3389/fnhum.2015.00672
Cumming, R., Wilson, A., & Goswami, U. (2015). Basic auditory processing and sensitivity to prosodic structure in children with specific language impairments: a new look at a perceptual hypothesis. Frontiers in Psychology, 6(July), 1–16. https://doi.org/10.3389/fpsyg.2015.00972
Dale, P. S., Harlaar, N., Hayiou-Thomas, M. E., & Plomin, R. (2010). The Etiology of Diverse Receptive Language Skills at 12 Years. Journal of Speech, Language, and Hearing Research. https://doi.org/10.1044/1092-
4388(2009/09-0108)
Dawson, J., C. Stout & J. Eyer. 2003. Structured Photographic Expressive Language Test-3. Dekalb, IL: Janelle Publications.
De Fossé, L., Hodge, S. M., Makris, N., Kennedy, D. N., Caviness, V. S., McGrath, L., … Harris, G. J. (2004).
Language-association cortex asymmetry in autism and specific language impairment. Annals of Neurology.
https://doi.org/10.1002/ana.20275
Delorme A, & Makeig S. (2004). EEGLAB: An open source toolbox for analysis of single-trial EEG dynamics including independent component analysis. Journal of Neuroscience Methods.
https://doi.org/10.1016/j.jneumeth.2003.10.009
Ehrler, D.J., & McGhee, R.L. (2008). PTONI: Primary Test of Nonverbal Intelligence: Pro-Ed.
Falk, S., & Kello, C. T. (2017). Hierarchical organization in the temporal structure of infant-direct speech and song.
Cognition. https://doi.org/10.1016/j.cognition.2017.02.017
Fujioka, T., Trainor, L. J., Large, E. W., & Ross, B. (2012). Internalized Timing of Isochronous Sounds Is Represented in Neuromagnetic Beta Oscillations. Journal of Neuroscience. https://doi.org/10.1523/jneurosci.4107- 11.2012
Fujioka, T., Trainor, L. J., Large, E. W., & Ross, B. (2009). Beta and gamma rhythms in human auditory cortex during musical beat processing. In Annals of the New York Academy of Sciences. https://doi.org/10.1111/j.1749- 6632.2009.04779.x
Gordon, R. L., Jacobs, M. S., Schuele, C. M., & Mcauley, J. D. (2015). Perspectives on the rhythm-grammar link and its implications for typical and atypical language development. Annals of the New York Academy of Sciences, 1337(1), 16–25. https://doi.org/10.1111/nyas.12683
Gordon, R. L., Shivers, C. M., Wieland, E. A., Kotz, S. A., Yoder, P. J., & Devin Mcauley, J. (2015). Musical rhythm discrimination explains individual differences in grammar skills in children. Developmental Science, 18(4), 635–644. https://doi.org/10.1111/desc.12230
Gordon, E.E. (1979). Primary Measures of Music Audiation. Chicago, IL: GIA Publications.
Grahn, J. A., & Brett, M. (2007). Rhythm and beat perception in motor areas of the brain. Journal of Cognitive Neuroscience. https://doi.org/10.1162/jocn.2007.19.5.893
Harris, P. A., Taylor, R., Thielke, R., Payne, J., Gonzalez, N., & Conde, J. G. (2009). Research electronic data capture (REDCap)-A metadata-driven methodology and workflow process for providing translational research informatics support. Journal of Biomedical Informatics. https://doi.org/10.1016/j.jbi.2008.08.010
Hayiou-Thomas, M. E., Dale, P. S., & Plomin, R. (2013). Language Impairment From 4 to 12 Years: Prediction and Etiology. Journal of Speech, Language, and Hearing Research. https://doi.org/10.1044/2013_jslhr-l-12-0240 Herbert, M. R., Ziegler, D. A., Deutsch, C. K., O’Brien, L. M., Kennedy, D. N., Filipek, P. A., … Caviness, V. S.
(2005). Brain asymmetries in autism and developmental language disorder: A nested whole-brain analysis. Brain.
https://doi.org/10.1093/brain/awh330
Hubert-Dibon, G., Bru, M., Le Guen, C. G., Launay, E., & Roy, A. (2016). Health-related quality of life for children and adolescents with specific language impairment: A cohort study by a Learning Disabilities Reference Center.
PLoS ONE. https://doi.org/10.1371/journal.pone.0166541
Hulme, C., & Snowling, M.J. (2009). Specific language impairment. In C. Hulme & M.J. Snowling (Eds.), Developmental disorders of language learning and cognition (pp. 129–171). Chichester: Wiley-Blackwell.
Iversen, J. R., Repp, B. H., & Patel, A. D. (2009). Top-down control of rhythm perception modulates early auditory responses. In Annals of the New York Academy of Sciences. https://doi.org/10.1111/j.1749-6632.2009.04579.x Jentschke, S., Koelsch, S., Sallat, S., & Friederici, A. D. (2008). Children with specific language impairment also show impairment of music-syntactic processing. Journal of Cognitive Neuroscience.
https://doi.org/10.1162/jocn.2008.20135
Jones, M. R., & Boltz, M. (1989). Dynamic Attending and Responses to Time. Psychological Review.
https://doi.org/10.1037/0033-295X.96.3.459
Kotz, S. A., Schwartze, M., & Schmidt-Kassow, M. (2009). Non-motor basal ganglia functions: A review and proposal for a model of sensory predictability in auditory language perception. Cortex.
https://doi.org/10.1016/j.cortex.2009.02.010
Large, E. W., & Jones, M. R. (1999). The dynamics of attending: How people track time-varying events.
Psychological Review. https://doi.org/10.1037/0033-295X.106.1.119
Lense, M. D., Gordon, R. L., Key, A. P. F., & Dykens, E. M. (2014). Neural correlates of cross-modal affective priming by music in williams syndrome. Social Cognitive and Affective Neuroscience.
https://doi.org/10.1093/scan/nst017
Maris, E., & Oostenveld, R. (2007). Nonparametric statistical testing of EEG- and MEG-data. Journal of Neuroscience Methods. https://doi.org/10.1016/j.jneumeth.2007.03.024
National Academies of Sciences, Engineering, & Medicine. (2016). Speech and Language Disorders in Children:
Implications for the Social Security Administration's Supplemental Security Income Program. In S. Rosenbaum &
P. Simon (Eds.). Washington, DC: The National Academies Press.
Oostenveld, R., Fries, P., Maris, E., & Schoffelen, J. M. (2011). FieldTrip: Open source software for advanced analysis of MEG, EEG, and invasive electrophysiological data. Computational Intelligence and Neuroscience.
https://doi.org/10.1155/2011/156869
Peretz, I., Gosselin, N., Nan, Y., Caron-Caplette, E., Trehub, S. E., & Béland, R. (2012). A novel tool for evaluating children’s musical abilities across age and culture. Frontiers in Systems Neuroscience.
Perrin, F., Pernier, J., Bertrand, O., & Echallier, J. F. (1989). Spherical splines for scalp potential and current density mapping. Electroencephalography and Clinical Neurophysiology. https://doi.org/10.1016/0013-4694(89)90180-6
Przybylski, L., Bedoin, N., Krifi-Papoz, S., Herbillon, V., Roch, D., Léculier, L., … Tillmann, B. (2013). Rhythmic auditory stimulation influences syntactic processing in children with developmental language disorders.
Neuropsychology. https://doi.org/10.1037/a0031277
Quené, H., & Port, R. F. (2005). Effects of timing regularity and metrical expectancy on spoken-word perception.
Phonetica. https://doi.org/10.1159/000087222
Reader, R. H., Covill, L. E., Nudel, R., & Newbury, D. F. (2014). Genome-Wide Studies of Specific Language Impairment. Current Behavioral Neuroscience Reports. https://doi.org/10.1007/s40473-014-0024-z
Rice, M., & Wexler, K. (2001). Test of Early Grammatical Impairment. San Antonio: The Psychological Corporation.
Sallat, S., & Jentschke, S. (2015). Music Perception Influences Language Acquisition: Melodic and Rhythmic- Melodic Perception in Children with Specific Language Impairment. Behavioural Neurology, 2015, 1–10.
https://doi.org/10.1155/2015/606470
Schuele, C. M., & Tolbert, L. (2001). Omissions of obligatory relative markers in children with specific language impairment. Clinical Linguistics and Phonetics. https://doi.org/10.1080/02699200010017805
Snyder, J. S., & Large, E. W. (2005). Gamma-band activity reflects the metric structure of rhythmic tone sequences.
Cognitive Brain Research, 24(1), 117–126. https://doi.org/10.1016/j.cogbrainres.2004.12.014
Team, Rs. (2015). RStudio: Integrated Development for R. [Online] RStudio, Inc., Boston, MA URL http://www.
rstudio. com. https://doi.org/10.1007/978-81-322-2340-5
The Mathworks Inc. (2017). MATLAB - MathWorks. Www.Mathworks.Com/Products/Matlab. https://doi.org/2016- 11-26.
Tomblin, J. B., Hafeman, L. L., & O’Brien, M. (2003). Autism and autism risk in siblings of children with specific language impairment. International Journal of Language and Communication Disorders.
https://doi.org/10.1080/1368282031000086363
Tomblin, J. B., Records, N. L., Buckwalter, P., Zhang, X., Smith, E., & O’Brien, M. (1997). Prevalence of specific language impairment in children. Journal of Speech, Language, and Hearing Research.
https://doi.org/10.1044/jslhr.4006.1245
Ullman, M. T., & Pierpont, E. I. (2005). Specific language impairment is not specific to language: The procedural deficit hypothesis. Cortex. https://doi.org/10.1016/S0010-9452(08)70276-4
Weinert, S. (1992). Deficits in acquiring language structure: The importance of using prosodic cues. Applied Cognitive Psychology, 6, 545-571.
Zanto, T. P., Snyder, J. S., & Large, E. W. (2009). Neural correlates of rhythmic expectancy. Advances in Cognitive Psychology. https://doi.org/10.2478/v10053-008-0057-5