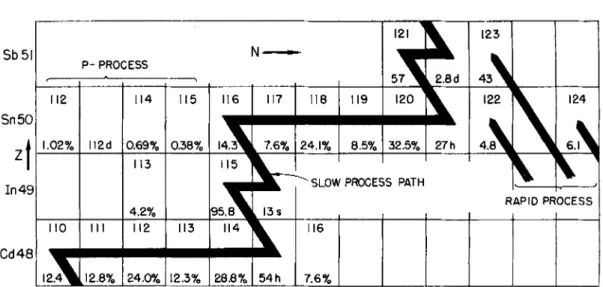
This article is concerned with stellar neutron capture processes that occur at a slow rate compared to the intermediate beta decay, the so-called s-process in the synthesis of the elements. 1)1 (hereafter designated as B2FH) showed that neutron capture processes played the primary role in the synthesis in stars of the. The s-process and the r-process are thus responsible for the synthesis of all the relatively abundant isotopes of the heavy elements.
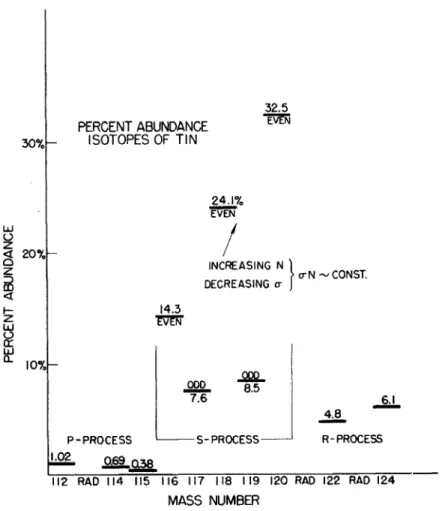
Their low abundances of the order of 1 percent or less are consistent with their production only in the p process. This equation is based on the basic assumption of the s process that beta decay between isobars is fast compared to the rate of neutron capture. Neutron capture in heavy elements occurs through many levels of extensive overlap of the composite core produced in the capture.
THE SEARCH FOR A SOLUTION
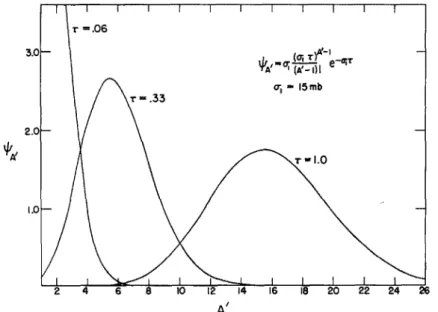
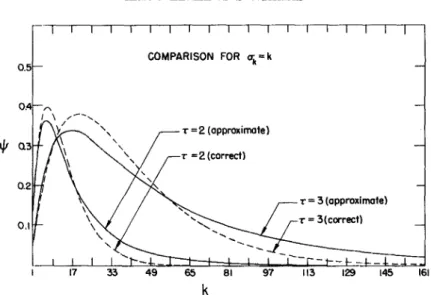
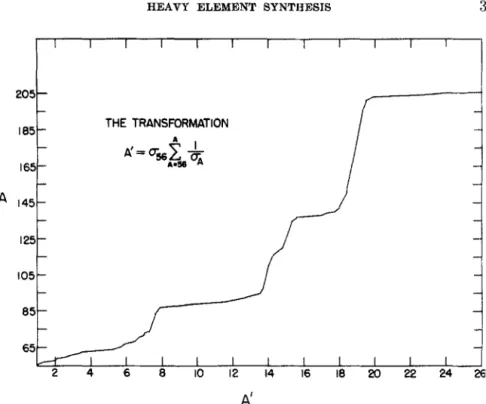
The cross-sections of the capture chain determine the degree of capture at each value of A. Then it is desirable that the coefficients of lower powers of the number 8 in the numerator disappear. Such observations strengthen our confidence in the general validity of the approximation procedure.
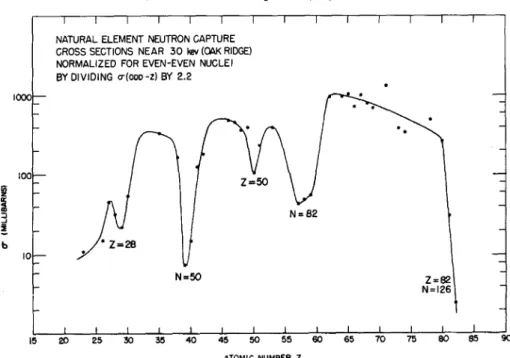
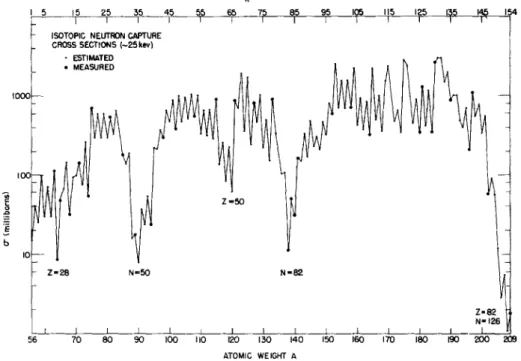
In order to apply the previous developments to the s-process, it is necessary to assume numerical values for each of the cross-sections in the s-process neutron capture chain. Rather, the choice must be made on the basis of available experimental measurements of the neutron capture cross sections. The average energy dependence of the cross sections in this energy range indicates that u(25 kev) is only about 10 percent larger than u(30 kev).
This is due to the energy and thus temperature dependence of the neutron capture cross sections. The third exception applies to (TN products of isotopes of Pb and Bi.
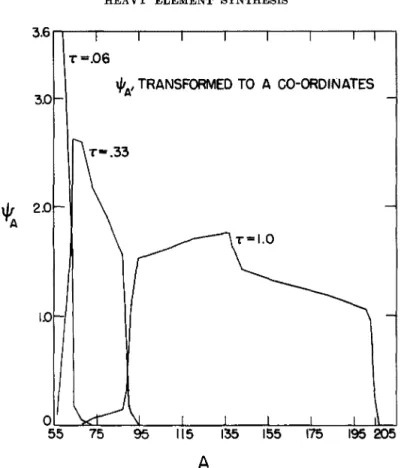
Calculated Abundances of the Heavy Nuclei
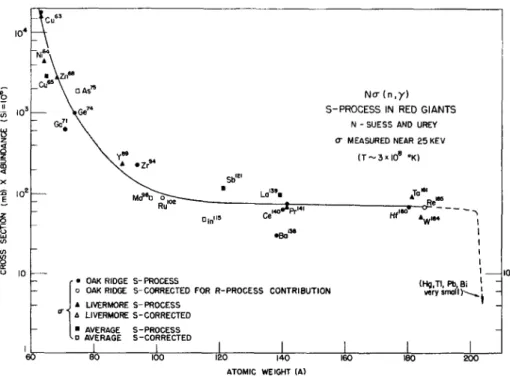
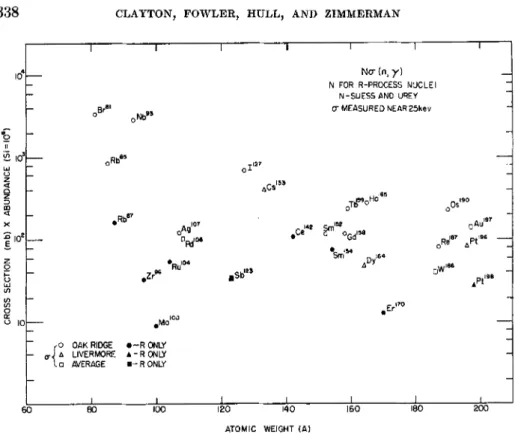
The comprehensive review by Suess and Urey (6) emphasizes the role of the fractionation problem in. In the ongoing discussion, the concern will lie with the relative contributions of the r and ~ processes. In view of the fact that only the abundances formed in the s-process participate in this correlation, the quantity.
The method of normalization for the ~-process calculations is to adjust the parameters of the model until the. The ~-process contributions are the difference between the observed abundances and the ~-process contributions o This procedure naturally produces an exact match of the observed abundances with Nr + N. The abundance of each isotope follows from the element abundance and the known isotopic composition of the elements in earthy material.
The last two columns contain respectively the sum of the r and !!, process contributions and the ratio of the r tot. The ratio "Nr/Ns" is an indication of the relative extent to which the isotopes were formed by these two processes in the solar system. Future measurements of the capture cross sections for all the isotopes of Ba will return this randomness and will , as the case may be, confirming or disproving the ~-process calculations.
The importance of these two elements lies in the somewhat arbitrary reduction of the Suess and Urey surpluses carried out by CFHZ for determining the. Despite the success of these calculations, the theoretical quantities should be regarded as only preliminary. Better known cross sections will also provide more data points for determining the IA curve.
The shape of the r-process yields can be improved with better theoretical expressions for the neutron-rich binding energies.
5 2.1xlO yr
97- Element
100- IA eTA
1.8 r-only
105- CTA
This procedure will give good results if no resonances are found in the very low energy regions corresponding to the stellar temperatures. In the case of C12 (p,y) there seems to be no reason to doubt the extrapolation, which is made from a strong resonance at ~ = 456 kev. For a state in N14 to contribute an important resonance i:Qr c 1 3 I p at stellar temperatures, the resonance energy would have to fall close to the effective 'stellar energy for it.
Resonance energies exceeding this range would appear far in the tail of the Maxwell-Boltzmann energy distribution for protons (kT~2 kev), while the Coulomb barrier. Although this ratio would not create problems for terrestrial and polar carbon, it would leave the C12/C1 3 = 5 value observed in the above stars as a un·. An entirely new mechanism for the stellar production of c1 3 would have to be devised and would almost certainly encounter great theoretical difficulties.
This result indicates that any other state in the 7-8 Mev range is most likely to be a T. The last level is particularly interesting because it lies in the appropriate 01 3 f P energy range. Proton groups up to 7.40 and 7.60 levels appeared, however, only at one angle, while the other states appeared at all rotation angles. They attribute these traces to states at 7.40 and 7.60 because they could think of no other source for them.
In view of the fact that no known level exists at 7.60 Mev and that a Q of Such an identification would seem rather arbitrary in light of the relationship would seem rather arbitrary in light of the relatively small error cited by both investigators and the close agreement of Q values to other observed states. Hebbard and Vogl (34) accurately determined the positions of the 7.97 and 8.06 levels by observing the g~a beam yield as a function of proton energy in 0 13 (p, y )" With regard to the uncertainty in other lower excited states , .
In summary, it can be stated that existing evidence of states in N14 in the excitation range 7-8.4 Mev demonstrates·.
- General Experimental Arrangement a. Equipment
- Lauritsen. An eleotrostatio defleotion system was designed to oompensate fluotuations in the beam position ~d entranoe
The capture mechanism could be efficient for the N14 states that can be described in terms of the direct removal of a neutron from the N15 ground state configuration. Suffice it to say that the chance of population of the excited levels of N14 appears to be good. It was hoped that 'such reactions would make frequent recalibration of the electrostatic analyzer unnecessary.
When installed in the base of the booster post, the deflectors performed their function adequately, but caused an unfortunate electron load that dropped the terminal voltage by an undesirable amount. The deflectors were then removed, reshaped and rebuilt in a more compact geometry that would place the top of the deflector system well below the lower ground ring of the booster column. The position of the beam in the input tube is determined by a pair of slots that can be rotated remotely.
To view the beam position from the images of the slits, a periscope and lens system was designed to focus on a remotely insertable quartz located below the second of the two slits. For the energies used in the present experiment, elastically scattered deuterons were present in large abundance from the (HD) component of the singly charged mass-three beam. A 10-4 cm nickel slug was placed in front of the counting surface to lower the alpha energy to a point between that of the deuterons and protons.
The known che~c~l composition of the target and the titanium and nitrogen, stop cross-sections were then used to calculate the thickness of the target, which corresponds to Hebbard's value. yield and the natural composition of nitrogen. The magnetic spectrometer is not as accurately reproducible due to a combination of hysteresis effects and thrust from the cone bearing flux meter mounts as described by. For the (He3, a) reactions on nitrogen, the incident particle energy must be reduced by the energy thickness of the surface carbon layer plus half. the energy thickness of the TiN layer or the incident particle.
By monitoring this yield, the author believes he knows the thickness of the carbon surface layer to some extent.
- value measurements
- Results
- values were not computed for the alpha particles popu- lating the N14 (7.97) and N14 (8.08) states because of poor
- Comparison of N13 and c 1 3 Energy Level Diagrams Data on' the N14 (He 3 , a ) N1 3 reaction were taken with
- Discussien
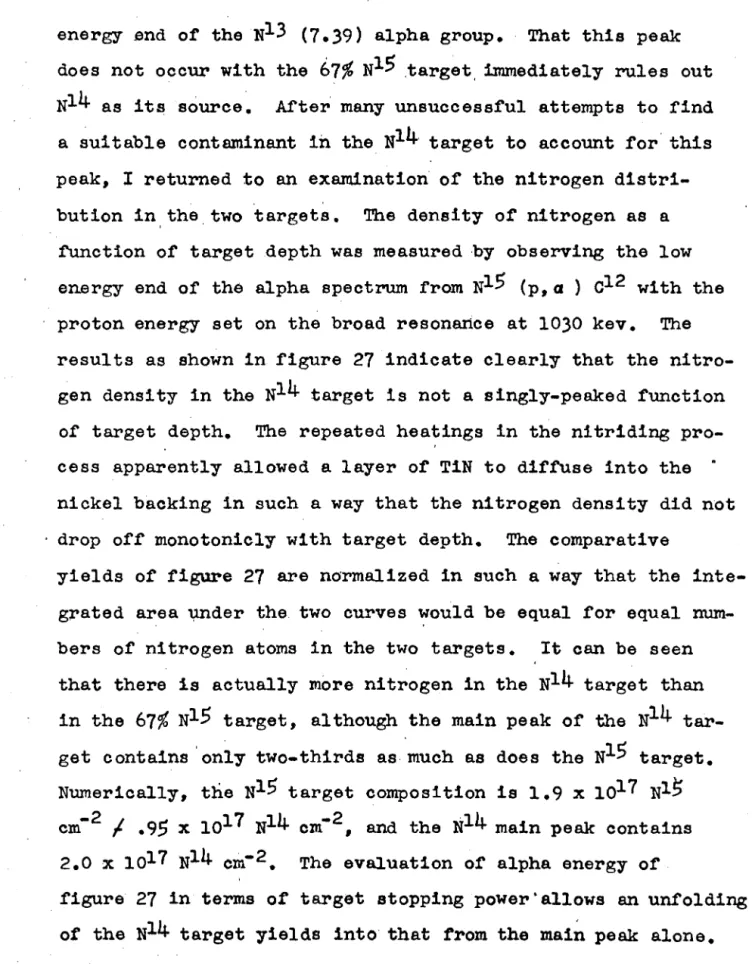
The energy range of the alphas guaranteed in this experiment was chosen at both angles to cover the range of 7 to 8 Mev excitation for the residual N14 nucleus in the reaction N15 (He 3, a ) N1 4 . Since the N15 target contains 33~ N1 4 atoms, the yields were repeated with the natural nitrogen target to obtain clear evi-. The momentum resolution of the magnetic spectrometer used in the experiment was p/8P = 231, which corresponds to. After many unsuccessful attempts to find a suitable contaminant in the N14 target to account for this peak, I returned to an investigation of the nitrogen distribution.
This fact may be mainly due to the reaction N14 (He3, p) 016 with a ~ = 15.2 Mev which can populate a large number of unstable alpha states in 016 • The fact that the continuum from the N14 target is about twice as big than since. Some amplification of the 90° yields from the N1 5 target in this direction will be bad. The observed width at half maximum of this yield is determined by the largest e.
The full laboratory width of the final state is not considered because the base state is narrow. The bottom three excitation values are averages of measurements taken during this experiment. Comparison of energy level diagrams of N13 and c 1 3 Reaction data of N14 (He 3 , a ) N1 3 were taken with Reaction data of N14 (He 3 , a ) N1 3 were taken with target natural nitrogen primarily to determine which reaction the cluster seen from target 67~ N1 5 should be attributed to target core N1 4.
The corresponding region in N13 was inconvenient for conventional charged particle reactions, the resonances in C12 I p 'embrace almost all the data kno~. In light of the fact that this last weak resonance has been overlooked by several observers, the cen-firmatien state at 7.17 Mev excitatien in this experiment is essential. The thickness of the TiN target layer gives the inoidentical He3 berum an energy width of about 20 kev.
The yields to the other excited states in N14 from this reaction would therefore be substantial evidence of the operation of the compound core mechanism.
PULSE HEIGHT
Triangles represent yields from a TiN target spiked with 67% N15_, while columns represent yields from a native TiN target with ±In statistics. Two curves.