To achieve this potential, methods for DNA and RNA analysis and design must be improved. These algorithms allow rapid silicodin design and improvement of nucleic acids prior to their synthesis and testing in the laboratory.
Structural Hierarchy of Nucleic Acids
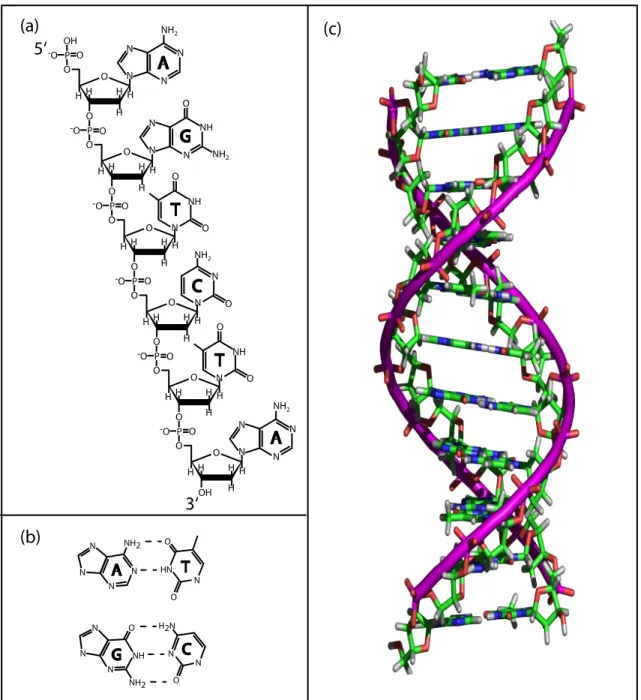
Primary Structure
Secondary Structure
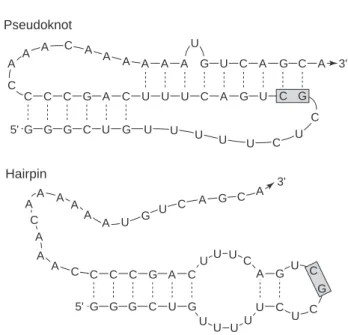
An important secondary structure motif in both engineered DNA nanostructures [42, 43] and biologically relevant RNAs [39] is the pseudoknot (see figure 1.2). This easy-to-describe structure-function relationship makes secondary structure descriptions the best choice for many nucleic acid applications and was essential in the creation of the biosensor described in Chapter 5.
Tertiary Structure
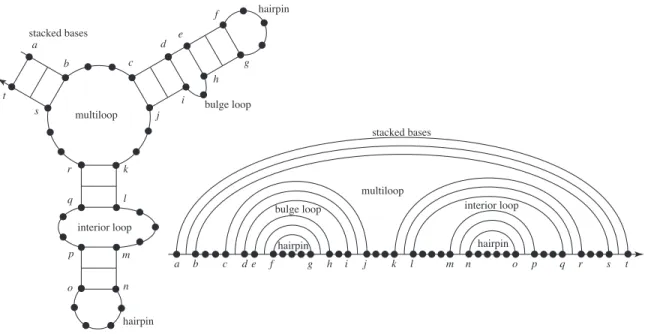
Because of the strength of base-pairing interactions, secondary structure is often sufficient to describe a useful level of function for a DNA or RNA nanostructure. Canonical loops of nucleic acid secondary structure: hairpin loops (one closing base pair), stacked base pairs (two closing base pairs with both loop sides of length zero), a bulge loop (two closing base pairs with one loop side of length greater than zero), an internal loop (two closing base pairs with both loop sides of length greater than zero) and a multiloop (more than two closing base pairs).
Thesis Overview
Analysis
The computational challenge of modeling tertiary structure directly makes this level of description, while important, not currently necessary for the development of new technologies.
Design
Construction
Nucleic acid-triggered catalytic drug release. Proceedings of the National Academy of Sciences of the United States of America.
Abstract
Introduction
The energy of the structure is the sum of the energies of its constituent loops. The goal of the present work is to design non-redundant pseudoknot recursions that allow for partition function calculations on a limited set of physically important pseudoknots.
Partition Function without Pseudoknots
- Standard Energy Model
- O(N 4 ) Algorithm
- O(N 3 ) Algorithm
- Minimum Energy Structure Modifications
The contribution of the partition function associated with the subinterval [d, e] is given by a previous evaluation of Qbd,es such that the total contribution for each internal loop structure is exp(−Ginteriori,d,e,j /RT)Qbd,e. When the exponential energies are multiplied in the partition function algorithm, the loop energies are summed for energy minimization.
![Figure 2.1. O(N 4 ) Algorithm: Recursion for Q i,j , the full partition function for the subsequence [i, j]](https://thumb-ap.123doks.com/thumbv2/123dok/10400640.0/31.918.231.733.88.229/figure-o-n-algorithm-recursion-partition-function-subsequence.webp)
Partition Function with Pseudoknots
Pseudoknot Energy Model
Recurrence relations that generate each secondary structure exactly once can be equally well applied to energy minimization calculations or partition function calculations by treating the loop energies differently in the two cases. Finally, when the contributions of alternative structures are summed in the partition function diagram, a minimum is adopted from these structures in the energy minimization diagram.
O(N 8 ) Algorithm
The recursion energy is 2β2, where β2 is the penalty associated with each base pair adjacent to the inside of the pseudoknot. If there is at least one extra base pair or pseudo-knot in the spanning region to the left, right, or on both sides of the gap, a multiloop is formed within the spanning region.
![Figure 2.10. O(N 8 ) Algorithm: Recursion for Q i,j , the full partition function for the subsequence [i, j]](https://thumb-ap.123doks.com/thumbv2/123dok/10400640.0/42.918.237.728.134.379/figure-10-o-algorithm-recursion-partition-function-subsequence.webp)
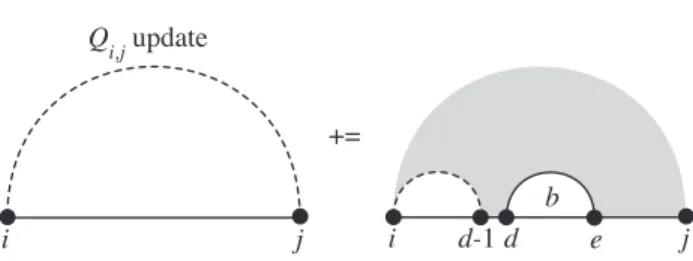
O(N 5 ) Algorithm
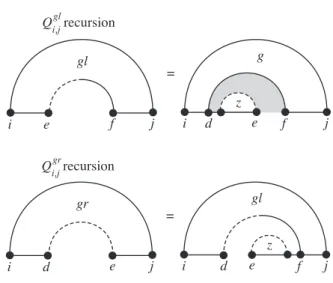
The recursions for Qgl and Qgrare defined in Figure 2.16, where the inner pseudoknot regions are specified by introducing z-curves. For the three multiloop cases where there is an additional voltage pair, we introduce the left and right supplementary gap recursions QglsandQgrs defined in Figure 2.18.
Methods
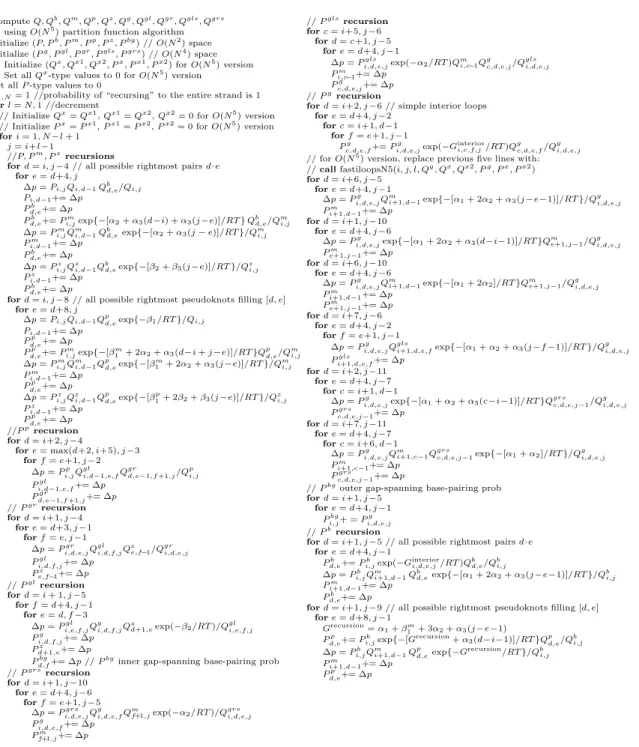
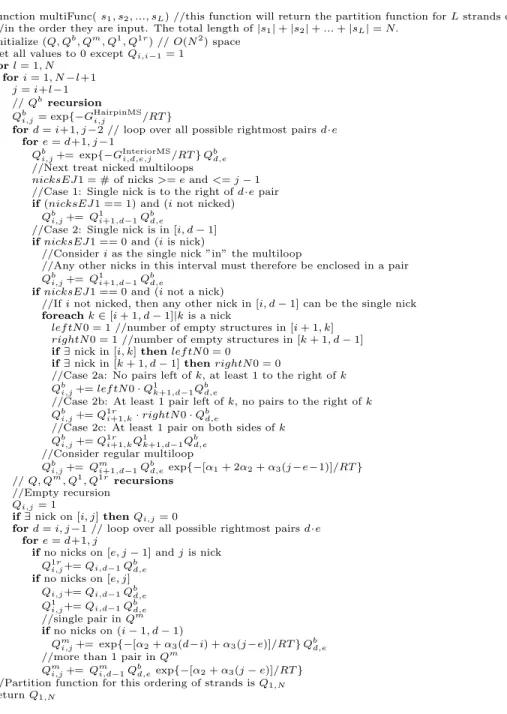
Pseudocode implementation of an O(N5) dynamic programming partition function algorithm for pseudoknot nucleic acids. Here N is the length of the strand and l = j −i+ 1 is the length of the substrand considered at some point during the recursive process.
Results
Pseudoknot Model Parameterization
The O(N5) structure prediction algorithm avoids introducing false pseudoknots in 92% of the negative controls and correctly predicts 61% of the pseudoknots in the positive controls. Modifications to the formulation of the pseudoknot energy expression can be accommodated to the extent that the dynamic programming framework allows.
Algorithm Complexity
We chose to balance our parameters to obtain as many correct pseudoknots as possible while maintaining at least a 90% rate on the negative control. Further help in parametrizing the pseudoknot model using computational or experimental studies would be greatly appreciated.
N)log10(seconds)
Conclusions
We describe a non-redundant dynamic programming algorithm that computes the partition function of an RNA or ssDNA strand over secondary structure space. A preliminary parameterization of the model is performed for RNA using 200 RNA pseudoknots and 400 unpseudoknotted tRNAs.
Abstract
Introduction
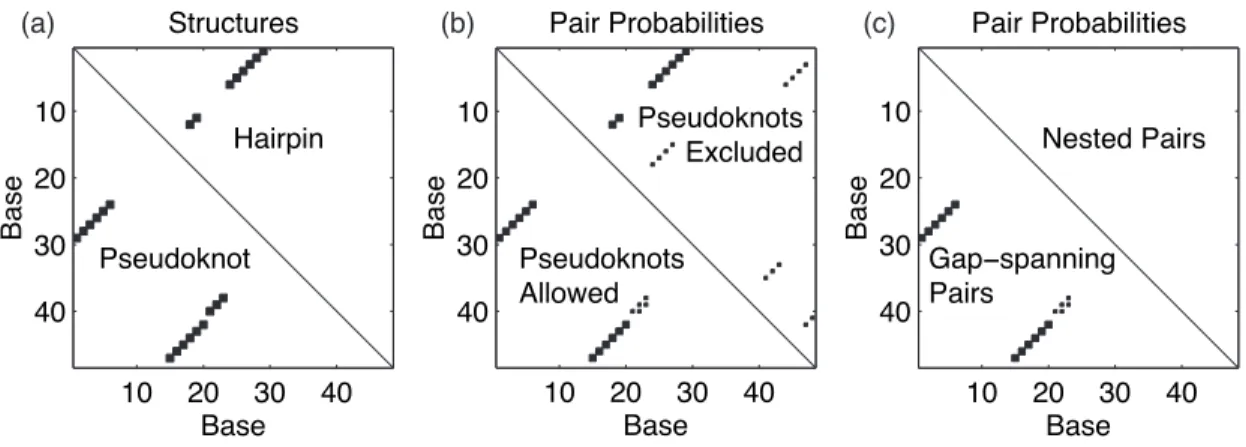
McCaskill's original paper [11] defines elegant dynamical programs to compute the partition function and base pairing probabilities over the ensemble of secondary structures that are not pseudoknot. This shift in equilibrium is clearly identifiable when the base pairing probabilities for the two sequences are compared.
Algorithm
- Partition Function Recursions
- Recursion Probabilities
- Pseudoknots
See Chapter 2 for a detailed description of the partition function algorithm (with or without pseudoknots) in terms of recursion diagrams. Starting from the partition function algorithm in Figure 2.4, a recursive probabilistic algorithm is obtained by performing three modifications: (1) the two outermost loops are modified so that the algorithm starts with the full chain of length l = N and decrements down to subsequences of length l = 1 , (2) all recursive updates are transformed, since the order of recursive blocks (Qb,[Q, Qm]) is reversed ([P, Pm], Pb) in Eq.
Methods
Pseudocode detailing the algorithm for computing the recursion probabilities in the pseudocased case is shown in Figure 3.4, where the computation of Pi,jbg using (3.3) and (3.4) has been embedded at little extra cost.2 We describe how to reduce the complexity in Appendix C of the pseudo-circular algorithm from O(N6) to O(N5).
Applications
16] examine this equilibrium shift for segments of the wild-type and mutant sequences described in Figure 3.1, showing that the pseudoknot conformation dominates the hairpin for the wild-type sequence (∼95% to ~5%), but competes approximately equally in the mutant sequence (∼50% to ~50%). In the absence of DNA pseudoknot parameters, we investigate an RNA analog of their sequence for the portion of the pseudoknot unit cell depicted in Figure 3.7a.
Conclusions
Abstract
Introduction
Using a positive design paradigm, sequence A would be selected since it exhibits a stronger affinity than sequence B for the target structure (i.e., lower ΔG◦ ). Negative design methods attempt to select against unwanted outcomes by optimizing sequence specificity for the target structure.
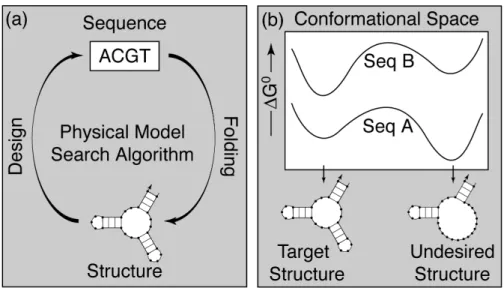
Physical Model
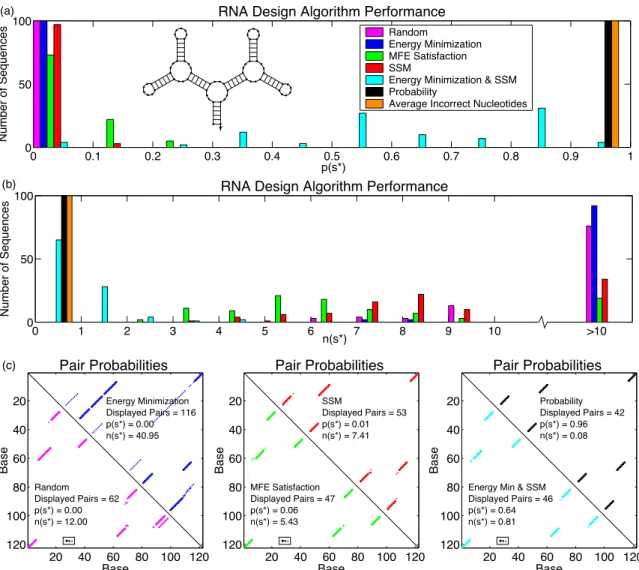
This study uses efficient partition function algorithms and stochastic kinetics simulations to study the thermodynamic and kinetic properties of sequences designed using seven methods that encompass aspects of positive and negative design paradigms. For each basic step, the ratio of forward and backward rates is defined to be consistent with the equilibrium probabilities of the two final states [12, 48].
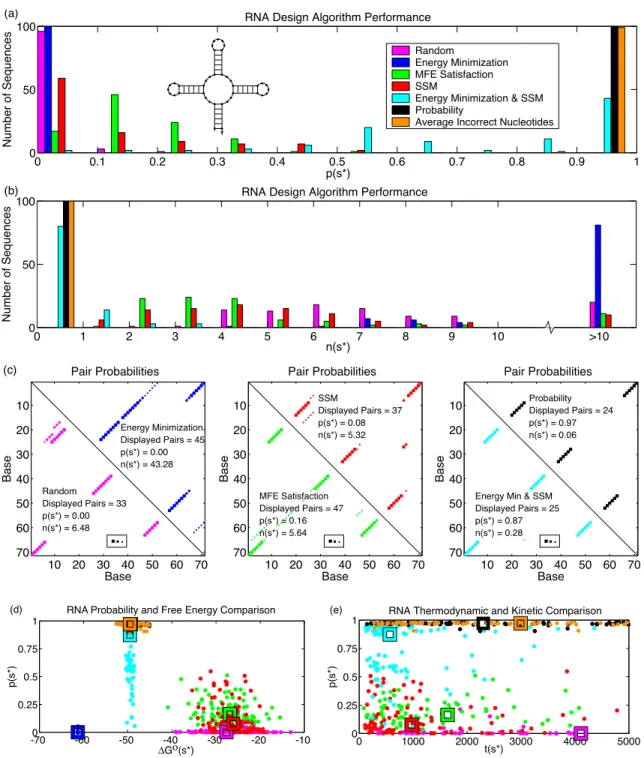
Thermodynamic and Kinetic Evaluation Metrics
By comparing the entries P in the structure matrix S∗ with the entries Si,j∗ ∈ {0,1} describing the target secondary structures∗, we can calculate the average number of irregular nucleotides n(s∗) in the equilibrium group of secondary structures Ω. Using the same convention, the augmented structure matrix corresponding to the target structure s∗ is denoted by S∗.
Design Criteria
This metric is distinct from the fast folding time when the target structure is not the minimum free energy structure. Sequences that achieve a low energy in the target graph are selected, subject to the constraint that SSM is satisfied [38].
Results
The new probabilities are shown in Figure 4-3, with the original probabilities shown as dotted lines. We estimate (s∗) as the median folding time over 1000 stochastic simulation runs, as plotted against p(s∗) in Figure 4.2e.
Discussion
The other five methods require extensions of standard empirical potential functions to handle multiple strands or pseudoknots.5 The dynamic programming algorithms underlying the three methods also require generalization to handle multi-strand problems. It is informative to compare nucleic acid rational design efforts with those in the related field of protein rational design.
Materials and Methods
- Design Implementation Details
- Global Energy Minimization
- Kinetic Simulation Software
We expect that nucleic acid secondary structure will provide a productive framework for formulating the design problem of functional multi-state machines in a way that simultaneously addresses positive and negative design requirements. Methods developed for protein design can be applied to nucleic acid design if the empirical nearest neighbor potentials [ 34 , 29 ] are cast as a sum of pairwise terms.
Abstract
Introduction
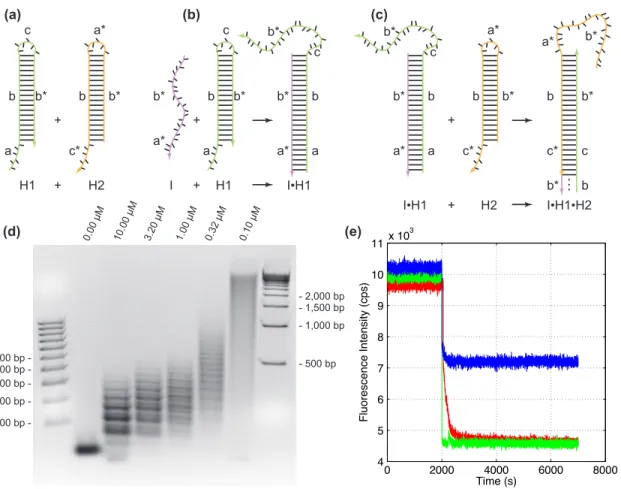
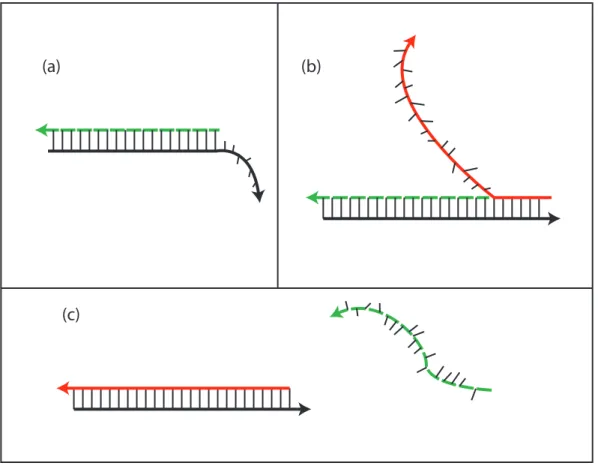
Letters marked with * are complementary to the corresponding unmarked letter. a) Terminals H1 and H2 are stable in the absence of initiator I. b). I is formed at the sticky end of H1 and undergoes an unbiased strand displacement interaction to open the hairpin.
Methods
- System Specifications
- Native Gel Electrophoresis
- Fluorescence Kinetics
In the system described here, the monomer DNA building blocks are mixed together but do not hybridize on an experimental time scale. For Figure 2b, DNA species were combined to give concentrations of 1 μM in 27 μL of reaction buffer, with additions made in order: buffer and/or (I or IATP), H1, and then H2 (note that I and IATP interact with H2 rather than H1).
![Figure 5.2. Aptamer HCR system. (a) Aptamer trigger mechanism. Binding of the DNA aptamer (blue) to ATP [13] exposes a sticky end [22] (magenta) that triggers the HCR mechanism of figure 1 by opening hairpin H2](https://thumb-ap.123doks.com/thumbv2/123dok/10400640.0/109.918.198.768.237.703/figure-aptamer-aptamer-trigger-mechanism-binding-triggers-mechanism.webp)
Results
Addition of I to the hairpin mixture at a lower concentration results in fluorescence quenching via HCR. Addition of insufficient initiator to H12AP (at the same concentration as for the first experiment) provides only partial quenching, demonstrating that HCR, and not I alone, is responsible for the depletion of the stock of H12APmonomer.
Discussion
If the loops were too small (e.g. of length 4 with stems of length 10), polymerization in the presence of initiator occurred very slowly or not at all. Appendix D discusses the thermodynamics of multi-stranded complexes, and Appendix E provides more examples of nucleic acid design.
Composition and Structure of Nucleic Acids
Two complementary strands of DNA can form a double helix, with the two purple tubes added to emphasize the sugar-phosphate backbone. RNA can also form a double helix (called A-RNA), but the structure is shorter (∼27˚A) and fatter (∼26˚A) and the base pairs are significantly tilted with respect to the helical axis [ 24 ].
Nucleic Acids in Biology and Engineering
The stability of base-pairing interactions depends on cations such as Na+ and Mg2+ to stabilize and protect the negatively charged backbone. a) The bottom strand of this double helix has an overlap of six bases. The medium gray terms are the new possible expandable loops with L1 = 4 or L2 = 4. The dark gray terms were previously included in toQxi, expanding smaller possible expandable loops.
Introduction
Definitions
For a multi-string system, a secondary structure refers to absolute base-pairing relationships, so the B-list will vary with the particular order being considered. A loop is formed starting from each base in the secondary structure and following the phosphate backbone in a 5' to 3' direction.
Energy Model
Symmetry
Partition Functions
- Distinct Strands
- Repeated Strands
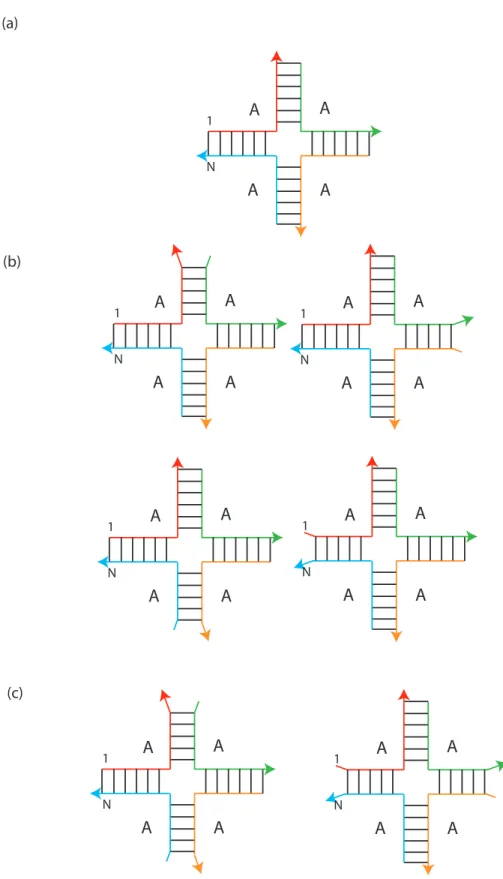
Consequently, the partition function contribution of each secondary structure must be divided by the number of equivalent representations. Each of the rotations g·s is described by exactly the same secondary structure, so overcounting is not a problem with the partition function algorithm.
Equilibrium Concentrations
Pair Probabilities
By symmetry, this is equal to times the calculated expected value of any member of the pair family. The calculation of n(s∗) is simple once the expected value of each pair family is known.
Proof of Lemma
Since this reduced secondary structure is equivalent to a tree, there must be at least two leaves (strands with exactly one base pair). If we can show that all other locations would cause a pseudoknot, then this would prove that there is exactly one circular permutation that allows the original secondary structure.
![Figure 2.2. O(N 4 ) Algorithm: Recursion for Q b i,j , the partition function for the subsequence [i, j]](https://thumb-ap.123doks.com/thumbv2/123dok/10400640.0/32.918.235.730.86.350/figure-o-n-algorithm-recursion-partition-function-subsequence.webp)
![Figure 2.3. O(N 4 ) Algorithm: Recursion for Q m i,j , the parition function for the subsequence [i, j]](https://thumb-ap.123doks.com/thumbv2/123dok/10400640.0/34.918.229.733.97.231/figure-algorithm-recursion-for-the-parition-function-subsequence.webp)
![Figure 2.6. O(N 3 ) Algorithm: Recursion for Q b i,j , the partition function for the subsequence [i, j]](https://thumb-ap.123doks.com/thumbv2/123dok/10400640.0/36.918.235.729.82.342/figure-o-n-algorithm-recursion-partition-function-subsequence.webp)
![Figure 2.11. O(N 8 ) Algorithm: Recursion for Q b i,j , the partition function for the subsequence [i, j]](https://thumb-ap.123doks.com/thumbv2/123dok/10400640.0/42.918.229.740.638.882/figure-11-o-algorithm-recursion-partition-function-subsequence.webp)
![Figure 2.12. O(N 8 ) Algorithm: Recursion for Q m i,j , the parition function for the subsequence [i, j]](https://thumb-ap.123doks.com/thumbv2/123dok/10400640.0/43.918.230.738.198.446/figure-algorithm-recursion-for-the-parition-function-subsequence.webp)
![Figure 2.14. O(N 8 ) Algorithm: Recursion for Q g i,d,e,j , the partition function for the pseudoknot spanning region filling subsequence [i, j] excluding the gap [d+1, e−1]](https://thumb-ap.123doks.com/thumbv2/123dok/10400640.0/44.918.230.737.91.438/algorithm-recursion-partition-function-pseudoknot-spanning-subsequence-excluding.webp)
![Figure 2.17. O(N 5 ) Algorithm: Recursion for Q g i,d,e,j , the partition function for the pseudoknot spanning region filling subsequence [i, j] excluding the gap [d+1, e−1]](https://thumb-ap.123doks.com/thumbv2/123dok/10400640.0/47.918.231.739.132.458/algorithm-recursion-partition-function-pseudoknot-spanning-subsequence-excluding.webp)