Something that cannot be overstated in this thesis is the fruitfulness of the collaborations we have undertaken. Members of the Caltech staff (Nora, Monica, Mike and Steve, Rick, Joe, and every person from Facilities who handled my crazy demands during our move to Linde+Robinson) amazingly keep things running, always with extreme kindness.
Observation and assignment of the A–X electronic transition of chlorine-substituted hydrocarbon peroxy radicals of chlorine-substituted hydrocarbon peroxy radicals
Near-Infrared Pulsed Cavity Ringdown Spectroscopy
In chapters 2 and 3, we present the near-infrared A-X electronic transition spectra of peroxy radicals formed during chlorine-initiated oxidation of unsaturated hydrocarbons. In Chapter 3 we measured the spectrum of the peroxy radical mixture formed during the chlorine-initiated oxidation of perhaps the most important biogenic emission, isoprene, and investigated its spectrum using electronic structure theory.
Multiplexed Photoionization Mass Spectrometry
The final chapter of this section, Chapter 8, describes the construction of a low-temperature flow reactor incorporated into the existing MPIMS instrument for use in the investigation of temperature-dependent radical rate constants and products below room temperature. Details of the design, implementation and testing of the low-temperature flow reactor are detailed here.
Time-Resolved Broadband Cavity-Enhanced Absorption Spectroscopy The final chapter of this thesis, Chapter 9, describes a separate set of experiments carried out
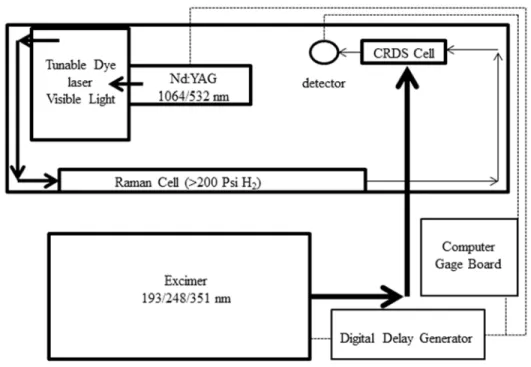
- Near-infrared pulsed laser cavity ringdown spectrometer
- Radical production
- Spectrum
- Quantum chemistry calculations
- Peroxy radical spectra
- Assignment of the chloro-ethyl peroxy radical spectrum
- Assignment of the chloro-propyl peroxy spectrum
- Assignment of the spectra of peroxy radicals with C4 backbones
- Adiabatic electronic 0–0 transition energy scaling
- References
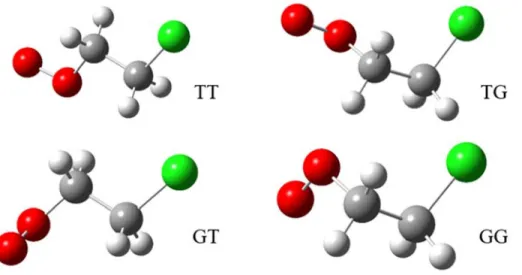
Geometries of the seven unique conformers of the 1-chloropropylperoxy radical (top) and the seven unique conformers of the 2-chloropropylperoxy radical (bottom). Experimental spectrum of the electronic transition A-X of chloro-propylperoxy radical (compensated in the y-direction by 30 ppm) together with the calculated Franck-Condon spectra of the 14 local minimum structures (spectra for the 1-chloropropylperoxy radical conforming in the y-direction are shifted by 10 ppm).
OBSERVATION AND ASSIGNMENT OF THE A–X ELECTRONIC TRANSITION OF THE PEROXY RADICALS FORMED DURING
CHLORINE-INITIATED OXIDATION OF ISOPRENE
Radical production
Chlorine gas was photodissociated using an excimer laser pulse (351 nm); the chlorine atoms formed attacked the isoprene molecule, either adding to one of the four positions on the double bonds or abstracting a hydrogen atom. We kept the isoprene concentration low (compared to the alkene concentrations used in Chapter 2) to prevent isoprene polymerization.
Experimental and theoretical spectrum
Ground and excited state vibrations were calculated for each conformer at B3LYP/aug-cc-pVDZ. Using these frequencies, the Franck-Condon overlap was calculated for the origin transition and excitation to vibrational levels in the excited state.
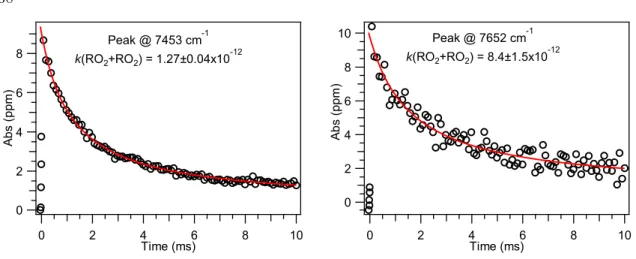
Peroxy radical kinetics
Peroxy radical spectrum and assignment
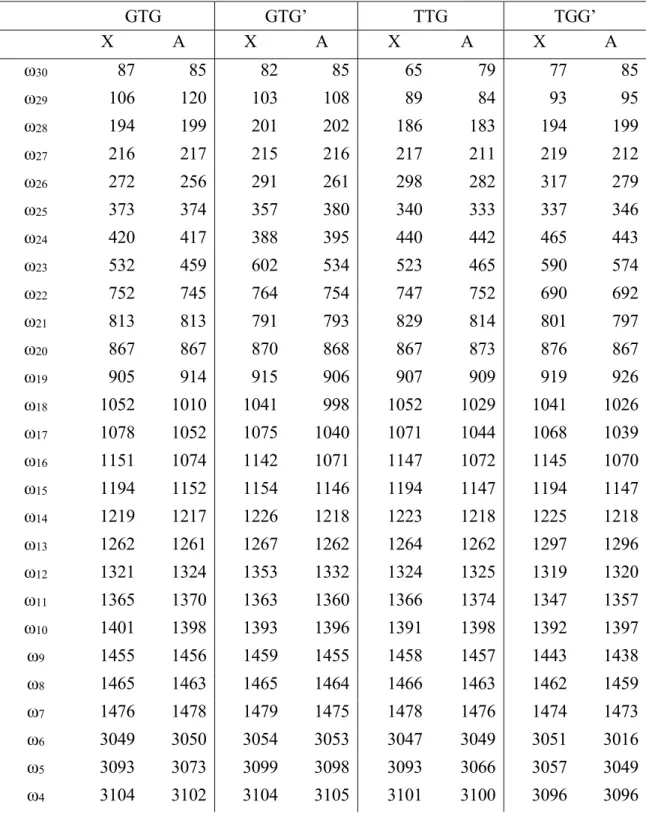
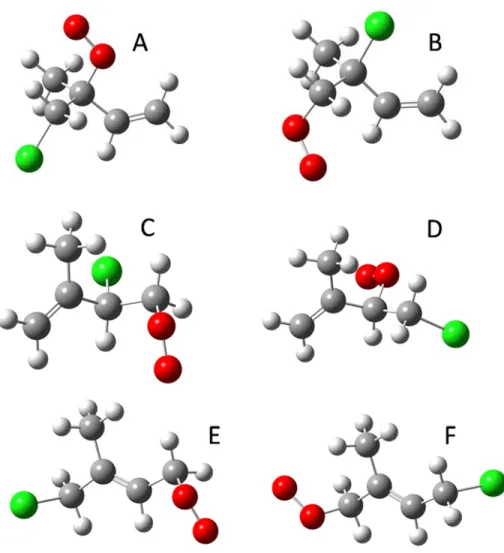
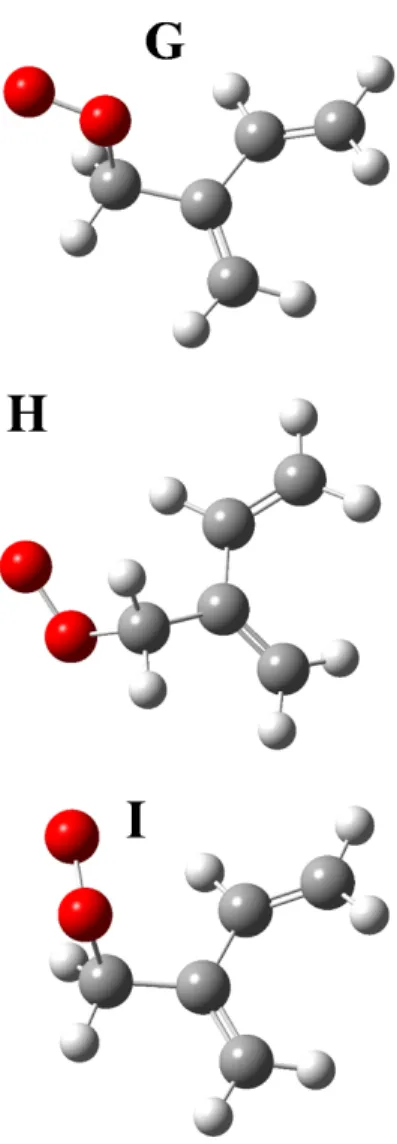
The calculated adiabatic A-X electronic transitions for the six isomers of the chlorine-substituted isoprene peroxy radicals and the three unsubstituted isoprene peroxy radicals are listed in Table 2. The electronic transition energy for conformer A (identified by Lei et al. as the minimum global structure ) is closer in energy to a prominent peak in the experimental spectrum.
Peroxy radical kinetics
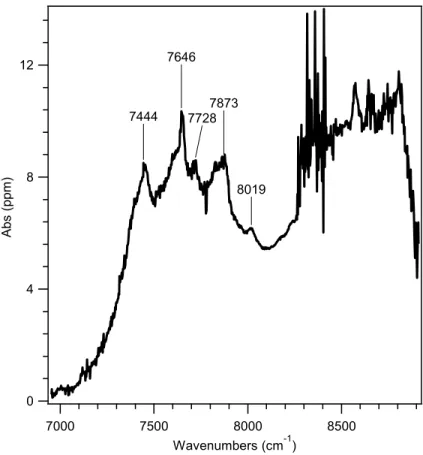
In this chapter, we report the near-infrared spectrum of peroxy radicals formed during chlorine-initiated oxidation of isoprene. Near-infrared cavity ringdown spectrum of peroxy radicals formed from chlorine-initiated oxidation of isoprene.
Multiplexed Photoionization Mass Spectrometer
The reactive mixture was sampled through a pinhole in the side wall of the reactor tube, expanded into the source chamber and passed through a skimmer (1.5 mm diameter) to form a near-effluent molecular beam in a first differential chamber (pressure ~10−6) Torr). The exit slit of the monochromator is sometimes further narrowed as necessary to reduce the photon flux and prevent saturation of the ion detector.
Photoionization cross section determination
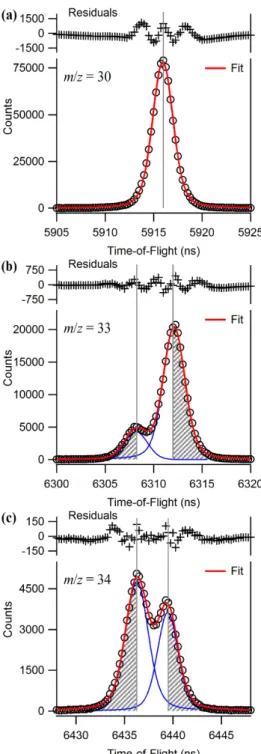
At the two masses where it gave a problem (with/z = 33 and 34), the mass resolution of the OA-TOF spectrometer was sufficient to partially resolve the two peaks.
Instrument response function
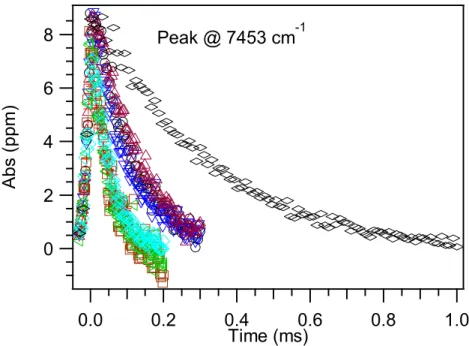
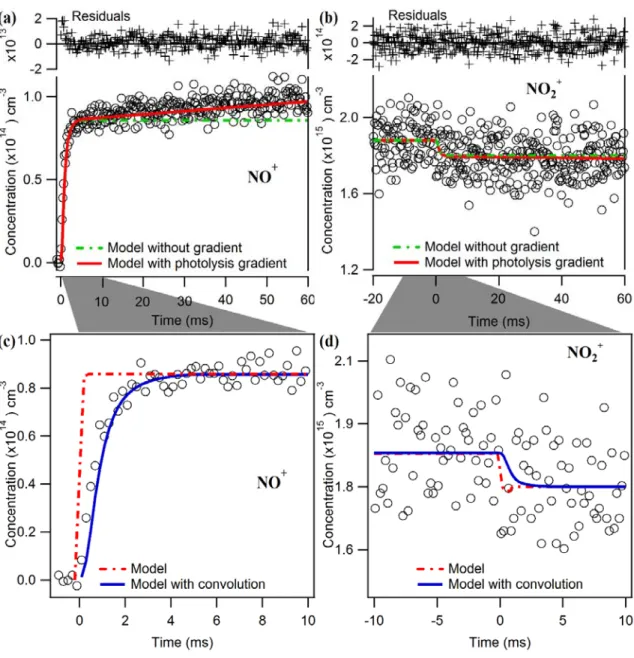
Thus, NO2 depletion and NO product formation are essentially instantaneous compared to the temporal binning (0.2 ms bin size) used in these experiments. The time traces for both types should appear as step functions that immediately reach a constant value.
Kinetics methodology
We therefore determined the Cl atomic concentration from the photolysis fraction and the known Cl2 concentration, as determined by the mass flows. As discussed in the Supporting Information, the Cl atom concentration had formed upon photolysis a weak negative gradient from the top to the bottom of the flow tube.
Single energy cross sections
In the absence of additional chemistry, H2O2 should form at half the rate of HO2 decay. We can explain this reduced yield by a combination of HO2 and H2O2 wall losses as described in the next section.
Absolute photoionization spectra
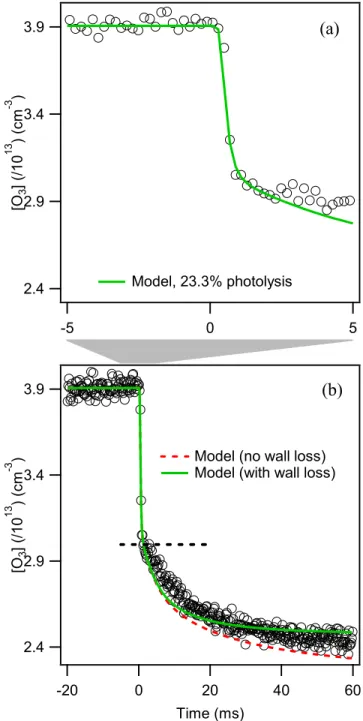
In the absence of coatings, we observed that a significant fraction of the products remained in the flow cell, even after complete pump-out was expected (t > 100 ms). The disturbances caused by the Ar filter are particularly clear in the H2CO spectrum and are noted on the figures with blue asterisks.
Error analysis
Prior to this study, the absolute photoionization cross section of HO2 had not been reported. There are no reports of the H2O2 photoionization cross section in the VUV with which to compare our absolute cross sections.
Validity of empirical estimates of cross sections
C.; Alcaraz, C.; Carrasco, N.; Pernot, P., et al., Determination of the Absolute Photoionization Cross Sections of CH3 and I Produced from a Pyrolysis Source, by Combined Synchrotron and Vacuum Ultraviolet Laser Studies. C.; Plenge, J.; Hunnekuhl, M.; Meiss, H.; Bischof, M.; Ruhl, E., Absolute photoionization cross sections of the primary photofragments of chlorine dioxide and dichlorine monoxide.
Characterization of instrument effects using NO 2 photolysis
We estimated the photolysis gradient from a linear regression of the NO+ data from 15 to 60 ms. The existence of a photolysis gradient implies that the chemical conditions (i.e. the radical concentrations) vary along the length of the flow tube.
Deconvolution of isobaric signals
Compared to the interpolated model without a photolysis gradient (dashed red lines in Figures S1(c) and S1(d)), modeling the kinetics with a photolysis gradient captures both the positive slope in NO and the negative slope in NO2. The negative slope derived from the NO2 kinetics is in good agreement with the linear fit of NO.
Absolute photoionization cross section of methanol
Also shown in Figure S2 is the spectrum collected at m/z = 32 during spectrum collection in the Cl2/CH3OH/O2 photolysis experiment (scaled to match the CH3OH spectrum collected above). Also noteworthy is the sharp drop in the signal at 11,083 eV in the spectrum obtained during kinetics experiments, which is apparently caused by imperfect normalization of the photon flux.
Experiments 19–22
The methanol spectrum collected during photolysis experiments agrees very well with the reference spectrum, indicating that observed kinetic depletions occur at m/z. As a result, we have removed this data point from the spectra reported in the paper.
The numerous superimposed vibronic states in the near-threshold photoionization of HO2 and H2O2 and the highly off-diagonal Franck-Condon factors for the ionization process make it impossible to quantitatively apply the Xu and Pratt model to the estimation of photoionization cross sections of radicals free.12 However. , from Figure S4 it is clear that both HOMO and HOMO-1 of HO2 and H2O2 are qualitatively similar. As discussed in the main text, the observation of near-threshold photoionization cross sections that differ by a factor of ~2 is consistent with the predicted orbital occupation effects predicted by the model for the case where the measured cross section is dominated by ionization from the HOMO- the HO2 single occupancy or H2O2 double HOMO.
Full kinetics model
C.; Lesclaux, R., Mechanism of the photooxidation of formaldehyde studied by flash photolysis of formaldehyde-oxygen-nitric oxide mixtures. This table does not include all the major reactions listed in Table 2 in the text.
All rate constants are taken from NASA Data Evaluation14 unless otherwise noted. molecules cm3-1 s-1).
VACUUM ULTRAVIOLET PHOTOIONIZATION CROSS SECTION OF THE HYDROXYL RADICAL
Experiments
Sixteen experiments were performed varying conditions such as initial O3 or H2O concentration, excimer laser fluence, or VUV photon energy. Eight experiments were performed at a photon energy of 13.436 eV, and five experiments at a photon energy of 14.193 eV.
Kinetics modeling
The initial ozone concentration was determined from mass flow rates and measurements of the O3/He mixture with an external ozone monitor immediately downstream of the ozonizer (see supplementary material)30. This wall loss must be determined empirically, as it depends on the specific nature of the wall substrate and any coatings.
Observed kinetics
Under this assumption, we performed several experiments where we varied the initial conditions of the reaction system (in particular, varying the initial OH radical density over a range of OH radicals cm−3) and independently fitted the model to these data to quantify OH wall. Loss rate. We did not try to fit the sharp peak in the signal at early times (the component was assumed to be from OH(v = 1)), but used the model with the added wall loss term in our determination of the photoionization cross-section of OH.
Experimental cross section and spectrum .a Cross Section
We used this procedure to independently obtain the absolute cross section for OH for each experiment listed in Table II. This relative signal was normalized to the VUV photon flux, measured at each energy using a photodiode (SXUV100), and scaled to the absolute cross-sectional measurements reported in Table III.
Experimental error analysis
Instrumental sources of systematic errors in the absolute photoionization cross section of OH usually come from measuring the OH cross section relative to the reference compound, xenon. Adding the random error of O(3P), the modeled concentration errors and the uncertainty of the literature cross-section in quadrature results in an overall uncertainty for O(3P) as reference for the photoionization cross-section of ±30%.
Determining the ozone concentration
The tabulated photoionization spectrum of OH
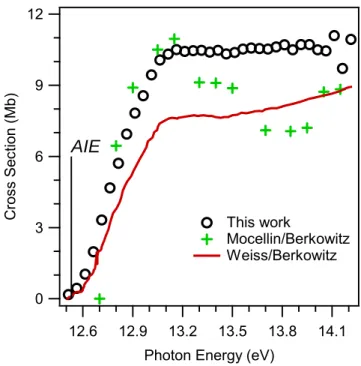
Shown here (black circles) is the absolute photoionization spectrum of ozone measured in this work, which assumes that the ozone monitor reading is accurate.6 Also shown here are the absolute photoionization spectra of ozone from the literature by Mocellin2 (green pluses) and Weiss5 (red line), as Berkowitz estimated.1.
KINETICS AND BRANCHING FRACTION OF THE ETHYL PEROXY RADICAL SELF-REACTION MEASURED USING VUV
Experimental conditions
Ethyl peroxy radicals are produced by hydrogen abstraction of ethane from Cl produced by photolysis of Cl2 at 351 nm. Data were collected for 20 ms before the excimer was fired to establish a baseline for each measure, then data were collected for 130 ms after the excimer, to observe the decay and rise of reactants and products simultaneously.
Photoionization spectra
The in situ method of monitoring the Cl 2 depletions to obtain the initial Cl atom concentration for each experiment was preferred. The number of counts of all products decreased and reached baseline at the end of the data collection, indicating that all products were completely removed from the reaction area before the next data collection began.
Kinetics model
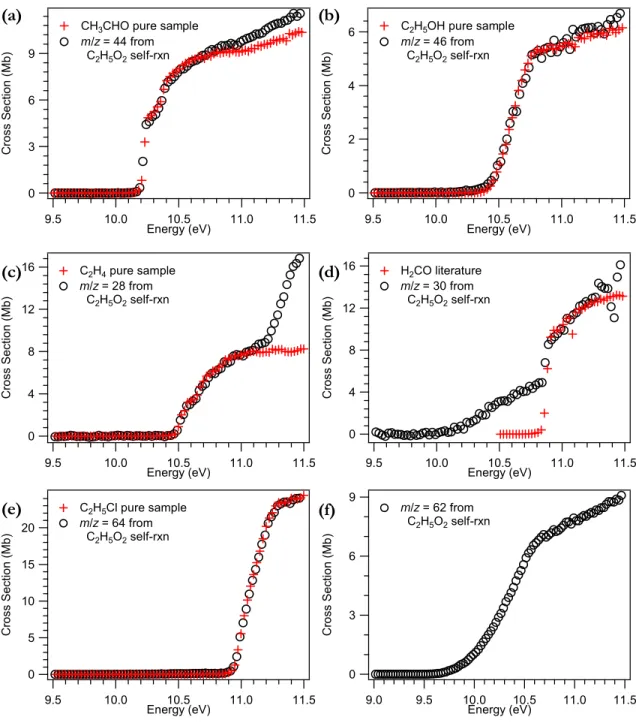
Photoionization spectra
Figure 1(e) shows the excellent agreement that can be obtained when only one species is present in the bulk—the spectrum at m/z 64 is in perfect agreement with that of C2H5Cl (formed by the reaction of Cl2 with C2H5). Panel (f) – the photoionization spectrum collected during the kinetic experiments at m/z 62 – will be discussed below in Section 3.8.
Data points are shown with error bars indicating the error associated with measuring the concentrations of the two species. The error in the reported yield was evaluated to include the error in the photoionization cross sections and the root N error in the ion counts.
The analytical model therefore fails to reproduce the alkoxy radical branching fraction for the conditions used in this work. The error reported here is the 2σ error in the weighted mean of each independent determination of alkoxy.
Dialkyl peroxide formation
We used a matching algorithm to vary the branching fraction for alkoxy radicals and compared the two ratios. Using only data collected at photon energies less than 11.0 eV to minimize impurities, we obtained the branching fraction of the ethoxy channel, alkoxy, from the weighted average of measurements made with oxygen concentrations (Figure 7).
We believe that the formation of the dialkyl peroxide product should have the same rate as that of C2H5OH, because both species have only one source: the self-reaction of C2H5O2. Using multiplex photoionization mass spectrometry, we measured the branching fraction of the radical-forming channel of the ethylperoxy self-reaction.