We appreciate the assistance of Dick Mewaldt in planning and performing the IMP-8 instrument calibrations. Bill Althouse, the project engineer, deserves much of the credit for making the trials a success. According to the current theory of solar cosmic ray modulation, it is difficult to explain the increases in low energy fluxes observed on Earth (Fisk, 1974).
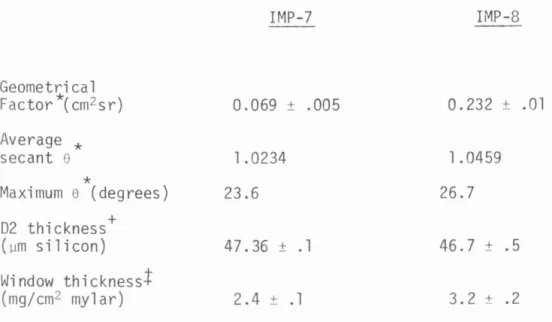
In September 1972 and October 1973, two similar versions of Caltech's Electron/Isotope Spectrometer (EIS) were launched aboard. A 2.4 mg/cm2 aluminized mylar window covers the front of the telescope to block the sun. In addition, the azimuth angle of the telescope at the time of the event is obtained.
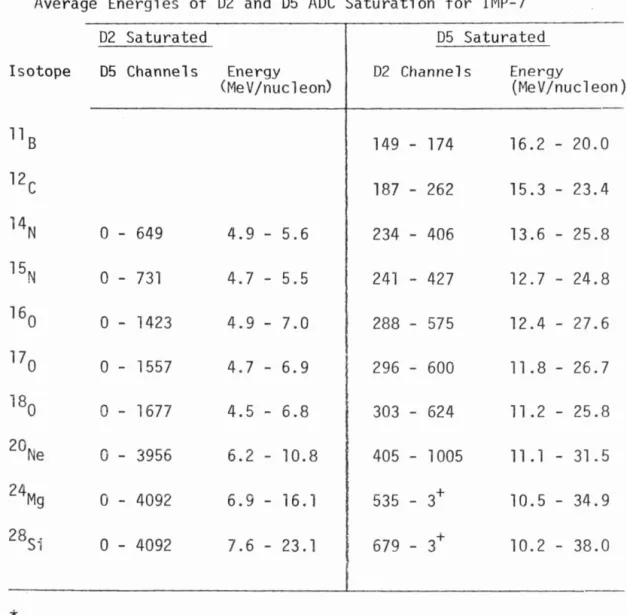
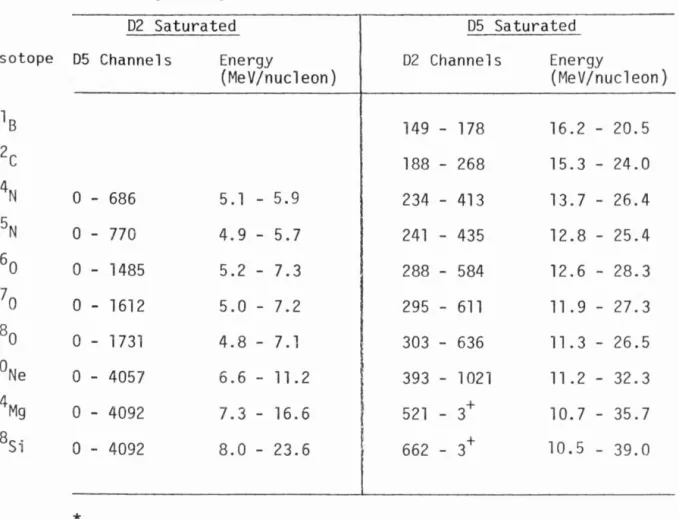
The boundaries of the figure are limited by the number of channels in the 02 and 05 AOCs. A cross-sectional view of the Caltech Electron/Isotope Spectrometer aboard IMP-8 is shown in Figure II - 3 .
Rate
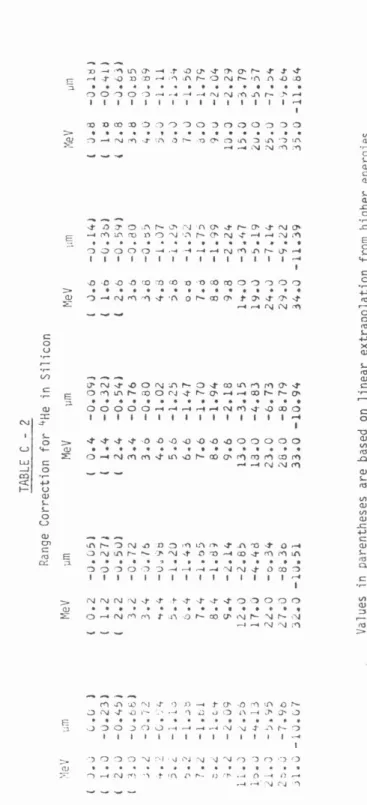
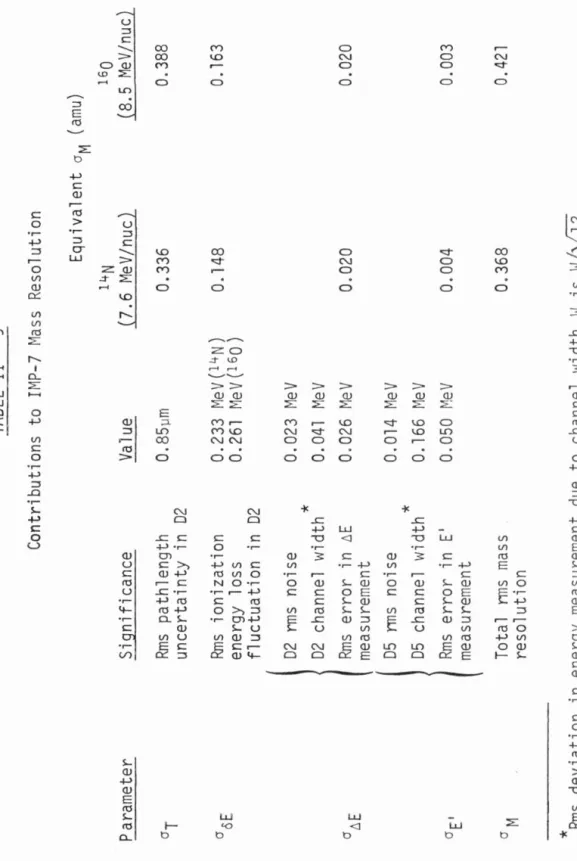
For a more detailed discussion of the range - energy relation and the isotope traces, the reader is referred to Appendix C. For the particle types and energies considered here, the standard deviation in MeV of the energy loss in 02 is given by (Hurford, 1974). It should be noted that the relative size of the individual contributions is a function of the isotope.
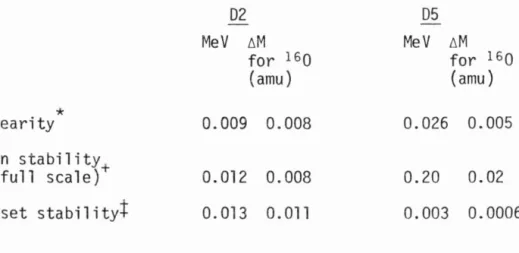
This initial calibration related the voltage used in combination with the pulsers to the energy of the a-particle. The linearity and stability of the gain and offset were examined over an 8 1/2 month period. For a more detailed discussion of the Tandem van de Graaff calibrations, see Hurford (1974) and Vidor (1975).
The main result of the calibration was the accurate determination of the mass response of selected. The Gaussian curve is a reasonable fit, although not the best fit, to the top of the histogram.
MASS RESOLUTION
EIS CYCLOTRON CALIBRATION 8.5 MeV/NUCLEON
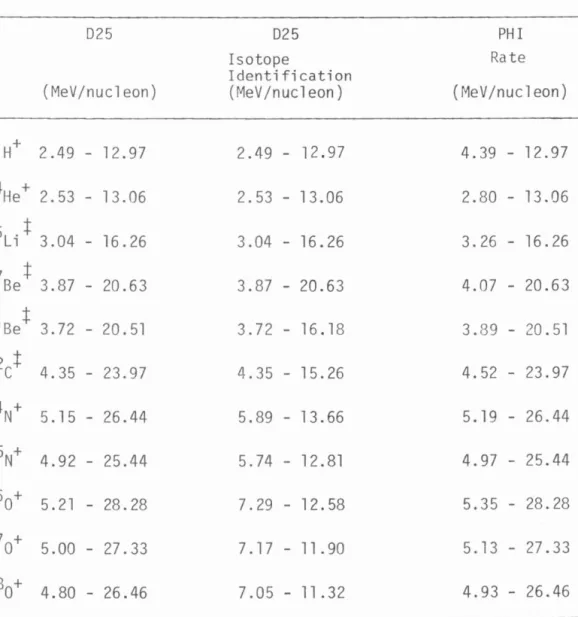
ELEMENT
OBSERVATIONS
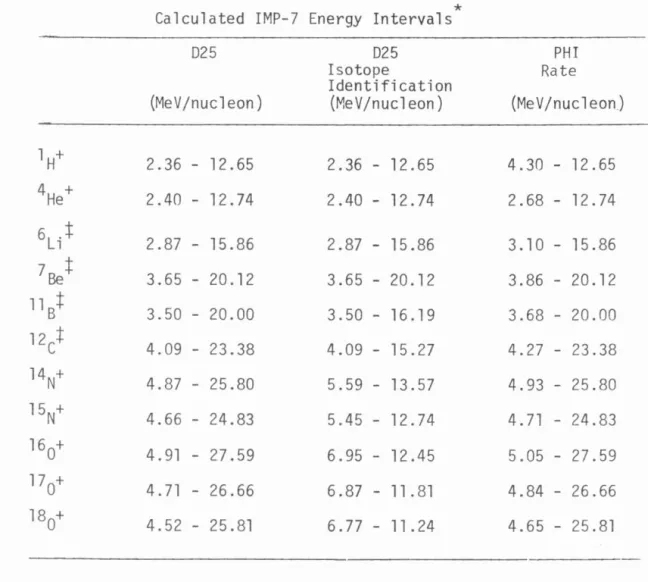
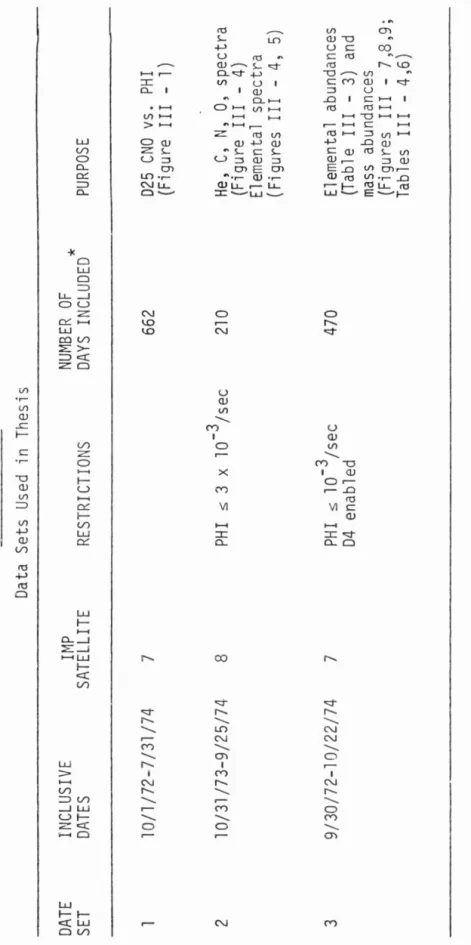
If the relative abundance of the elements is independent of the flux of particles from a solar flare, one would expect the solar flux of oxygen to vary linearly with the solar flux of hydrogen and helium, which is monitored by the PHI scale. For PHI rates ~ 10-3/second, the CNO flux is relatively independent of the PHI rate. The solar pollution to element Z flux can best be estimated by expressing the flux as a fraction of the CNO flux. where JZ,F and JCNO,F are, respectively, the fluxes of element Z and CNO during solar flares, and fZ,F is the relative abundance of element Z in CNO during solar flares.
If we take the PHI interval PHI$10-3/sec, the quantity on the left side of the equation is the relative contribution of the Sun to the flux of element Z for PHI$10-3/sec, and it can be calculated based on the known quantities on the right side of the equation. At energies of -6 - 8 MeV/nucleon there is no significant solar contribution to any of the fluxes listed in Table III - 1 for a PHI rate. Because the effective mass resolution of IMP-8 is - 1 amu for oxygen and smaller for the lighter elements, the bands exclude less than 5% of the real particles.
Since the mass resolution of beryllium is better than the mass resolution of oxygen, less than 7% of the real 7Be and 10Be particles are excluded from the 1 amu limits. To extend the energy range of the spectra, we used the data in the saturation regions.
IMP-8 NOV'73-SEPT'74
The highest energy point of carbon is obtained from the region in which 05 ADC is saturated. This abnormal increase in low-energy nitrogen and oxygen relative to carbon and helium is consistent with the observations of other experimenters (Hovestadt et al., 1973; McDonald et al., 1974). Using more stringent criteria for quiescent helium, the helium flux below 6 MeV/nucleon is significantly reduced.
Because there is background near beryllium on the IMP-8 6E-E' plot (see Figure III-2), only an upper bound for the low-energy beryllium flux can be obtained at this stage of the analysis. The low energy lithium point was obtained from the IMP-7 025 data, as the IMP-7 lithium response (see Section III-C) is cleaner than the IMP-8 response. To extend the spectra to higher energies, the high-energy lithium, beryllium and boron points were obtained from events that activated the detector combinations 0256 or 02567 on the IMP-8 telescope.
The low energy boron flux shows no evidence of a similar improvement to the nitrogen and oxygen fluxes. Although the statistics are poor, low-energy lithium and beryllium fluxes are also consistent with non-enhancement. For clarity, events along the boundary that saturate either ADC 02 or 05 are omitted, but no background is removed from the plot.
To extend the oxygen abundance to lower energies, data from the region in which ADC 02 is saturated were used. It is clear from the plot that pollution due to particles heavier than oxygen is minimal. The clean instrument response of the IMP-7 EIS allows us to calculate element abundances in a straightforward manner.
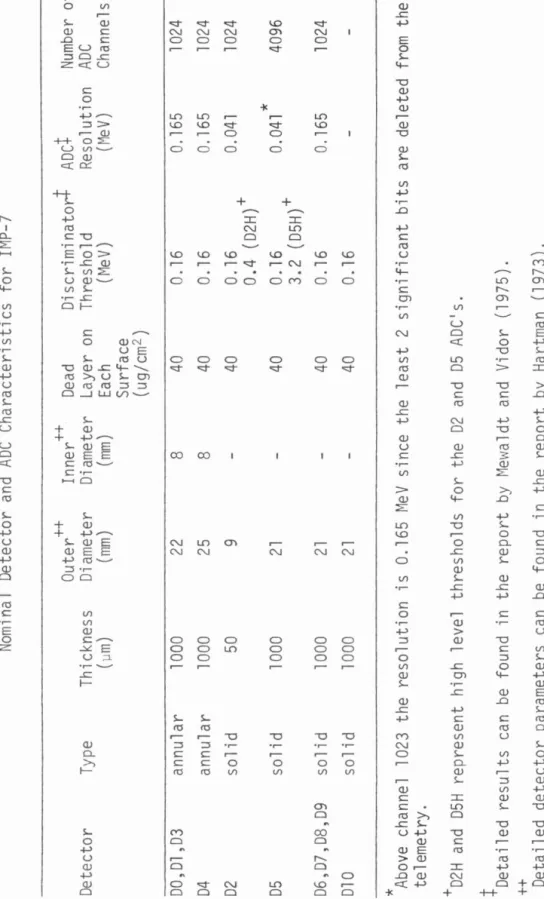
However, due to the instrument limits discussed in Appendix B, we have limited the upper energy limit for the IMP-7 instrument to values below the 05 ADC saturation. Elemental abundances can also be obtained from the IMP-8 EIS data presented in Section III-B. The channels for which the elements can saturate the ADC 02 are also shown in the graph.
05 CHANNEL
SUMMARY AND CONCLUSIONS
The HIZM program requires knowledge of channel-energy conversion and range-energy coupling. With the channel-to-energy conversion and the range-to-energy relation as input, MASCON calculates the 02 channel and the total energy (corrected for the mylar window) as a function of the 05 channel for each isotope. Due to the different hardware and the larger number of interesting events, a slightly different procedure is used.
Note that since the calibrated area-energy relationship is not known at this stage of the analysis, other. row energy tables are used. The outputs of MOUT and MASFIT can be used directly to obtain the isotope response of the instrument. It would have been more difficult to calculate the average 02 and 05 energy loss directly from the raw data, as with an rms mass resolution of -0.3 amu (for oxygen) it is not possible to associate the correct isotope with each event on an individual basis. The program OTHICK uses the energy loss information 02 and 05 to calculate a differential correction (equation C - 5) to the range-energy relation.
The probability of crosstalk is greatest when both the 02 and 05 pulse heights are large, or when the 02 pulse height is - 0.9 the 05 pulse height. From Tables B - l and III - 3, the magnitude of the crosstalk corrections can be compared to the statistical uncertainties in the element ratios. For a more detailed discussion of the 05 ~ 04 cross-talk, the reader is referred to the report by Vidor (1975c).
Since the 025 events on the IMP-8 are not affected by crosstalk, the IMP-8 provides reliable oxygen measurement. Calculation of nitrogen and oxygen isotope masses using the 6E-E' technique (see Section II-C) requires an accurate knowledge of the area-energy relationship. R is the range of a particle with energy E, mass M and charge Z, where M and Z are in units of proton mass and charge.
Schematic representation (not drawn to scale) of the scattering chamber of the Berkeley 8811 Cyclotron. This explains some differences in the energy uncertainties between helium and the other two elements. The mass response of the instrument was examined for the isotopes of hydrogen, helium, nitrogen and oxygen.
The errors in the range energy tables we used for nitrogen result in a mass error so large that isotope identification is not possible unless the mass response of the instrument is known. Therefore, it is necessary to use equation C-4 to calculate the average E' from the known value of the average mass.
N RANGE CORRECTION
16 0 RANGE CORRECTION
To estimate the uncertainty in the range correction, we must first estimate the uncertainty in the mass response. Uncertainties in the data points due to statistics result in uncertainties in the mass response curve. In addition, there are systematic uncertainties that can be estimated by the deviation of the smoothed mass response curve from the individual data points.
These systematic uncertainties are due to fluctuations of the data points about the response curve or imperfect fitting of the response curve to the data points. See Section III-D.) Therefore, the contribution of the helium response uncertainty to the relative nitrogen and oxygen response uncertainties is shown in Table C-5. However, as mentioned earlier, a shift in the absolute size of the area does not affect the mass response of the instrument.
Using the new range of corrections together with Janni's proton range energy table, mass histograms were. obtained for a portion of the hydrogen, helium, nitrogen and oxygen calibration data. The isotopes have the correct masses within the predicted accuracy, thus supporting the validity of the new series of corrections. The data from a 14N and a 160 beam were combined to obtain the mass histogram for helium. H., Simonsen, H., Sorenson, H., "An experimental investigation of charge-dependent deviations of the Bethe stopping force formula", Nucl.
Fisk, L., Kozlovsky, B., Ramaty, R., 11 An interpretation of the observed oxygen and nitrogen enhancements in low-energy cosmic rays", Astrophys. Symposium on Measurements and Interpretation of the Isotopic Composition of Solar and Galactic Cosmic Rays, Durham, New Hampshire (1974). Garrard, T., "A Quantitative Investigation of the Solar Modulation of Cosmic Ray Protons and Helium Nuclei", Ph.D.
Garrard, T., "Caltech Electron and Isotope Spectrometer Experiments on IMP1s Hand J", Space Radiation Lab. E., "Nitrogen and Oxygen Isotopic Composition of the 6 to 12 MeV/nuc Cosmic Ray", Symposium on the Measurement and Interpretation of the Isotopic Composition of Solar and Galactic Cosmic Rays, Durham,. E., "Isotopic Calibration of the dE/dX-E Telescope", Symposium on the Measurement and Interpretation of the Isotopic Composition of Solar and Galactic Cosmic Rays, Durham, New Hampshire (l974c).