In Part II, the newly developed sampled data modeling technique is applied to the issue of interpreting loop gain measurements in high-performance switching regulators. As a result of the inaccuracy of the average state space being almost half the switching frequency, conventional loop gain predictions prove inadequate in this regime. The frequency domain near half the converter switching frequency has been largely ignored.
The new model to be developed in this thesis combines the convenient form of the first existing method with the superior accuracy of the second and forms a powerful tool in the study of high-frequency behavior of switching regulators.
SAMPLED DATA MODELING OF SWITCHING REGULATORS
CHAPTER 1
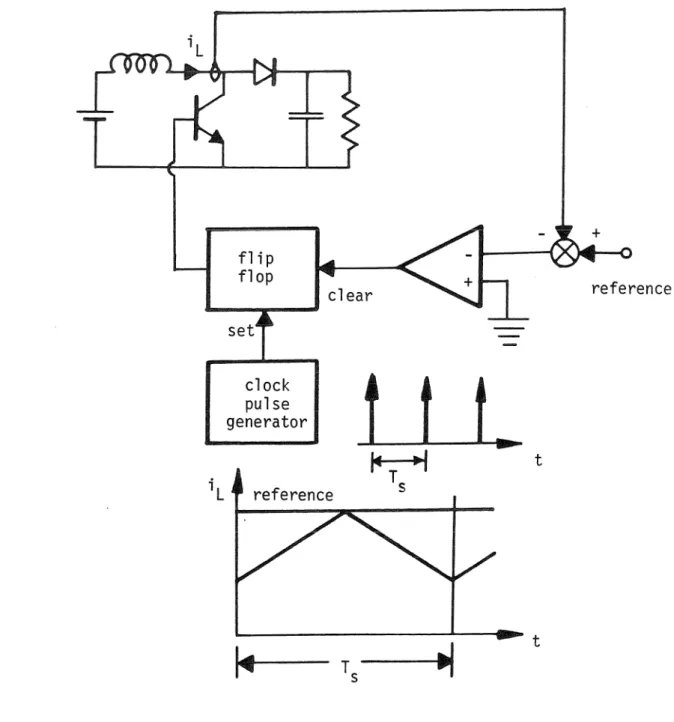
The development of this new method begins with a careful second look at the evolution of the state-space averaging and the discrete modeling techniques. This chapter serves to introduce some of the basic principles used in this thesis. Throughout Part I of this thesis, a method of feedback control known as current programming will be used as a test of the various modeling techniques.
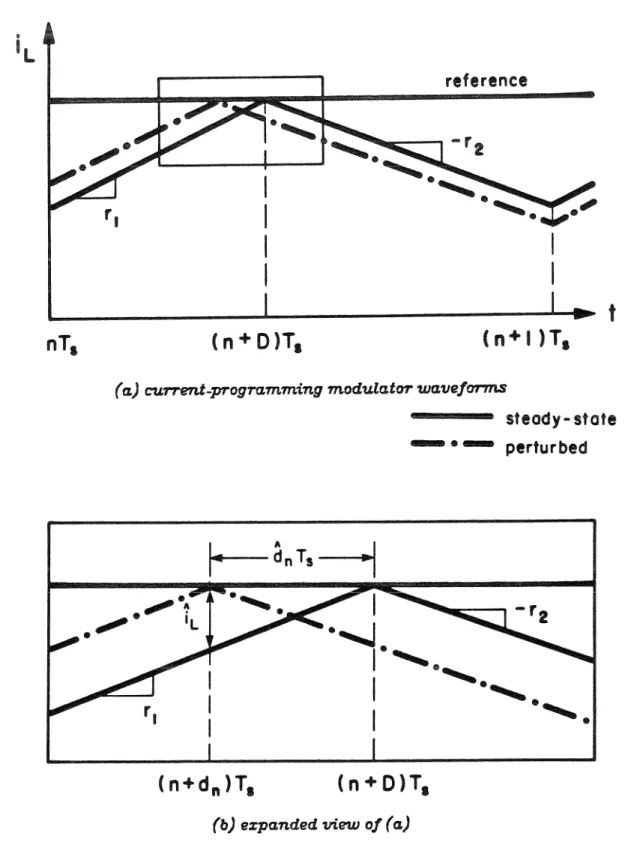
Thus, the only ramp-like slope is the slope of the coupling ripple on the feedback inductor current.
FUNDAMENTALS OF SWITCHING CONVERTER ANALYSIS. 1
Conclusions
The qualitative differences in the high frequency performances and the forms of · the state-space average and discrete modeling techniques are also discussed. The development of the discrete modeling technique begins, as in the case of state-space averaging, with the fundamental Eq. The special moments correspond to the choice of the initial point for the integration of Eq.
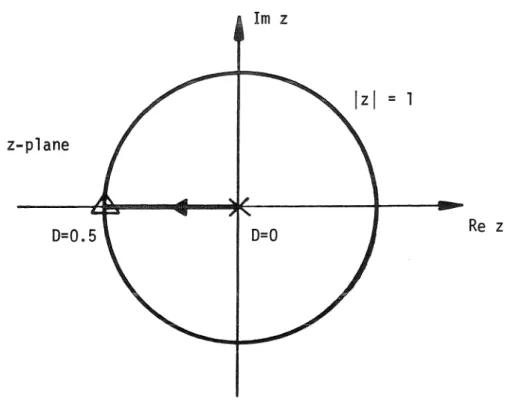
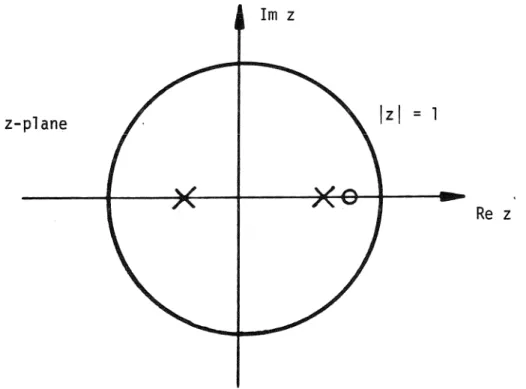
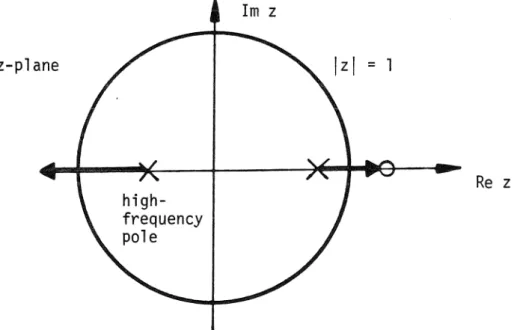
The stability criterion is that the system is unstable if any of the closed loop poles Zp lies outside the unit circle in the z-plane. The zeros of the voltage feedback loop gain are determined by the details of the particular converter. These examples illustrate the accuracy of the discrete modeling technique in the analysis of switching converters.
Section 6.2 of this chapter develops a new modeling technique, the sampled-data method, which combines the continuous form of state-space averaging with the accuracy of the discrete method. The new model is obtained by incorporating only one of the two approximations used for deriving state-space averages. It is natural to ask whether one of these steps was more responsible than the other for the degradation of the ability of state-space averaging to predict the subharmonic oscillations of current-programmed regulators.
The dip s is needed to distinguish this loop gain from the sampled version of the state-space averaged loop gain T(s. The positions of the closed-loop poles Sp can be determined as the roots of
SAMPLED-DATA MODELING AND ITS RELATIONSHIPS WITH DISCRETE MODELING AND STATE-SPACE AVERAGING
We see that the average gain loop in the state space forms a limiting case of the sampled data loop. Similarly, in the transform domain, there is a close relationship between the loop gain of the sampled data r;(s) and the discrete loop gain Tz(z). In such cases, the sampled data and discrete representations of the loop gain become fully equivalent, and either representation can be used.
The only substantial difference between the two block diagrams is the presence of the sampler in the sampled data diagram. With this small change, the loop gain of the sampled data is just the sampled version of the average loop gain of the state space. In contrast to the average state space prediction, the gain of the sampled data loop indicates that instability may indeed occur.
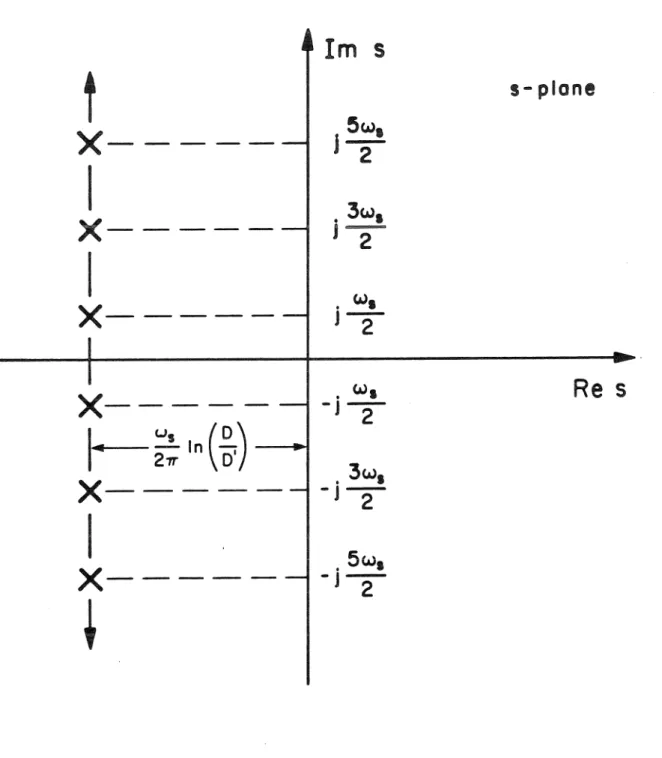
With these approximations, the sample data loop gain T;(s) can be rewritten in an approximate form. Thus, the average loop gains of the sampled data and the state space are approximately related by the transformation of sr.-. The combination of this characteristic with the periodicity of the function means that the gain of the sampled data cycle is real at every multiple of half the switching frequency.
This general figure is quite useful for determining certain design implications of the sampled data loop gain. Finally, the nature of the sampled data loop gain, as a function of real frequency, was investigated.
LOOP GAIN MEASUREMENTS OF SWITCHING REGULATORS
The result was found to agree with the average loop gain in the state space defined in Part I of this paper. - spatially averaged open-loop loop gain measurement block diagram. with steady state conditions maintained by external control of the feed ratio. The effect of this possible difference is a change in the magnitude of the loop size characteristic.
Thus, the state-space average analysis of loop gain measurements turns out to be quite simple. The open-loop measurement is discussed in Section 11.3 and is found to yield the state-space-averaged loop gain as a result. Formulating loop gain predictions using the sampled data technique is similar to state space averaging.
The delay E does not affect the counter, which is reduced to the state space averaged loop gain when t: goes to zero. This new quantity Tc(s) is neither the state space average nor the previously discussed sampled data loop gain, but rather a combination of the two. The correction term consists of the difference between the sampled data loop gain T5*(s) and the state space averaged loop gain T(s).
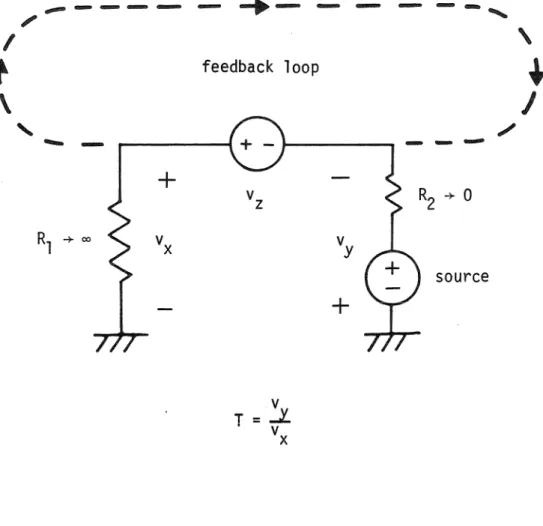
With the feedback loop open, the analysis of the previous chapter predicts that the measured characteristic will be that of the state-space-averaged loop gain T(s. Ve h. The effect of the approach used can be seen in the singularity of this· Thus, as expected, using the approximate, state-space-averaged loop gain results in a loss of accuracy at low frequencies.
Second, the state space averaged loop gain must be replaced by its sampled data equivalent.
10 Phase
CONCLUSIONS
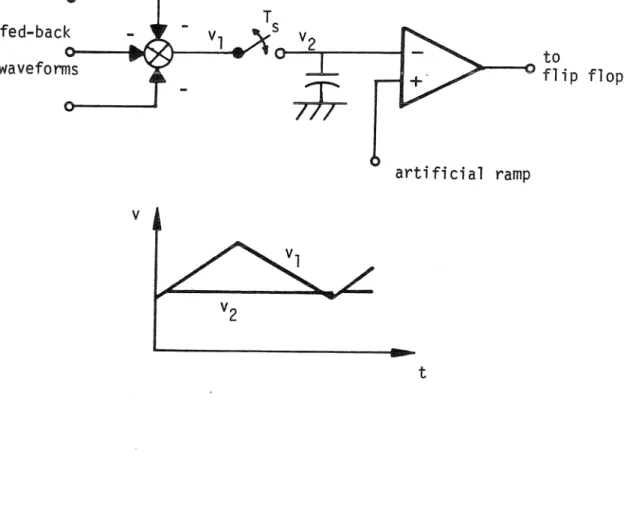
The state-space averaging method, which models switching regulators in a linear, time-invariant manner, was then applied to the task of predicting loop gain measurements. An interesting feature of this analysis is that the shape of the loop gain is the same even if the measurement is made with the feedback loop open, although a gain constant may change due to interactions between the modulator's artificial ramp and any switch ripple C ?n the feedback waveform . It was noted that at high frequencies the predictions of state and space averaging may turn out to be inaccurate.
With the feedback loop open, the prediction was determined to be the average gain of the state space loop. Therefore, such a measurement was found to be a poor indicator of robustness in wide-bandwidth systems, as it was shown in Part I that the average state-space loop gain is not accurate in these systems. Here, it was found that, due to the presence of the sampler in the model, the measurement corresponds to a function that includes both the average state space gains and the loop gains of the sampled data.
It has also been shown that the closed-loop poles predicted by this function are the same as those predicted by the sampled-data loop gain, implying that this closed-loop gain is an accurate stability indicator. This new closed-loop gain has been shown to differ only from the state-space-averaged result for wide-bandwidth systems, and even then only at frequencies approaching half the switching frequency. However, this frequency range is precisely the region of loop gain crossover for these systems, and is therefore of great importance.
Closed-loop, sampled measurement resulted in a characteristic that closely matched the theoretical loop gain of the sampled data, although it required that the equivalent crossover frequency of the average gain of the state-space loop used in the data calculation be sampled different from that of the open-loop case, due to the interactions between the artificial ramp and the switching ripple in the reversible waveform. Although the magnitude characteristic of this measurement was similar to that of the open-loop case, the additional approximately 30° lag between the open- and closed-phase characteristics emphasized the danger involved in any reliance on open-loop measurements or the Average condition. of space in: design of wide bandwidth switching regulators.
ADAPTIVE CONTROL OF SWITCHING REGULATORS
With the help of the straight line approximation, the loop gain of this system can be calculated. In fact, the quantity h/C appears prominently as a factor of the last two terms of this expression. Indeed, even the origin of this equation was only an approximate form of loop gain.
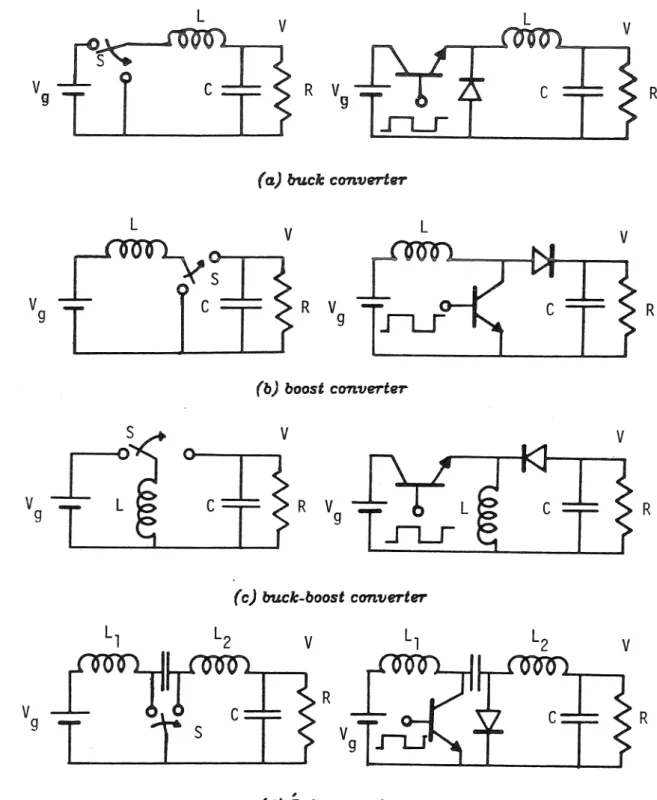
It was seen that many of these effects are due to the appearance in the loop gain expression of a quantity consisting of the ratio of steady-state inductor current. The discussion in the previous chapter about the sensitivity of the boost regulator, combined with the existence of similar phenomena in the second fundamental. In this section, means of remedying this problem will be sought, again using the boost topology as an example.
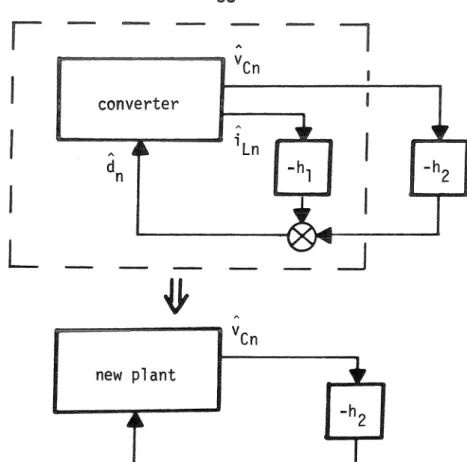
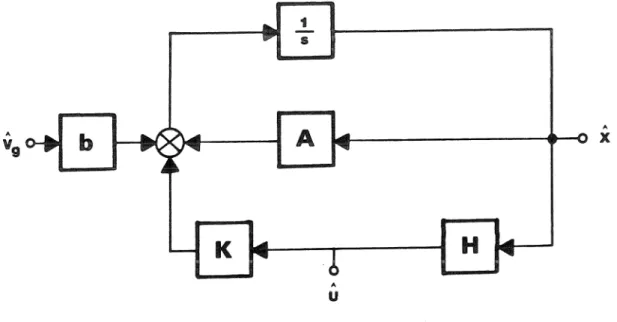
In this figure the feedback variables are as in the boost controller diagram in figure. The result is that the effective values of the feedback gains g2 and g3 vary in the desired manner and therefore remain the same. 16.5), the additional current gain in the small signal feedback expression, Eq. 16.7), can be rewritten in terms of the modulator voltage, the inductor current gain and the inductor current.
In each case, the same uniform sampling modulator used in the boost example is assumed, with VM the size of the modulator's artificial ramp. Calculation of the loop gain for such a buck-boost regulator gives the following approximate form.