Topics are organized for easy understanding of essential material related to a particular topic. The first and most general meaning of the term test given in the dictionary is "a critical examination, observation or assessment". Its closest synonym is trial. The word critical, however, is defined as “relating to. Clarification of each of the major terms in this definition is critical to understanding any future discussion of the tests.
INTRODUCTION TO PSYCHOLOGICAL TESTS AND THEIR USES
Psychological tests are often described as standardized for two reasons, both of which involve the need for objectivity in the testing process. Determinant Explanation Background Psychological tests are characterized by Tests must demonstrate-systematic procedures. Psychological tests are small subsets of behavioral examples are examples of behavior.
DON’T FORGET
Quick Reference 1.3 shows a list of key participants in the testing process and their roles. Quick Reference 1.4 presents information about a fascinating account of the history of admissions testing in higher education in the United States. Thus, in the mind of the general public the terms assessment and testing are often seen as synonymous.
ESSENTIAL STATISTICS FOR TESTING
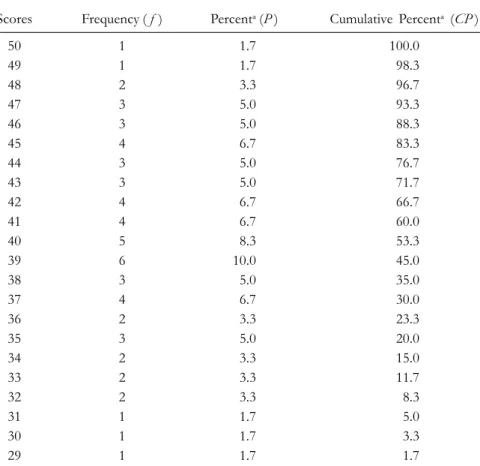
The first quartile (Q1), or 25th percentile, marks the top of the lowest quarter (quartile) of the distribution. The variance is the sum of the squared differences or deviations between each value (X) in a distribution and the mean of that distribution (M), divided by N. Because of the square of the deviation scores, however, the variance is not the same unit as the distribution original.
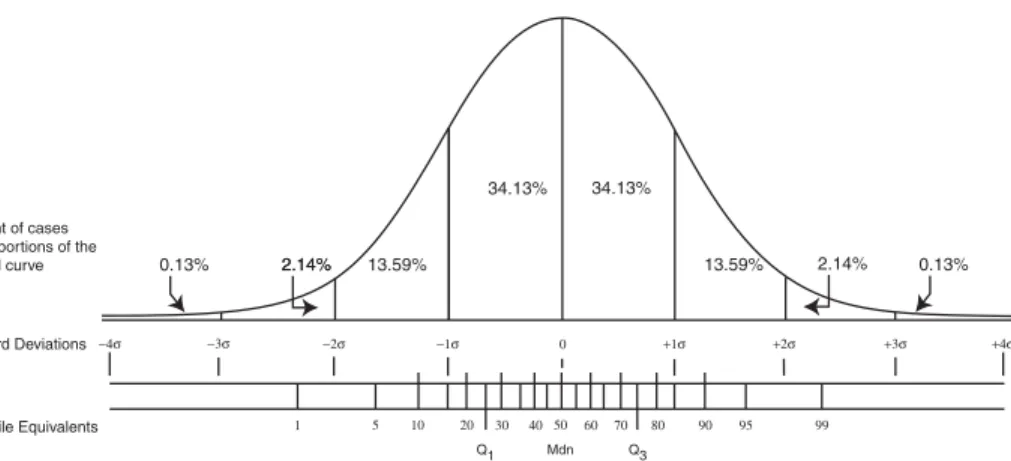
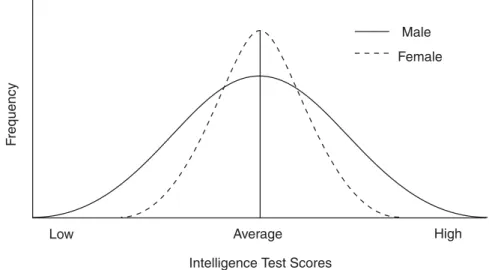
The standard deviation is a measure of the average variability of a set of scores, expressed in the same units as the scores. As we shall see, the utility of the normal curve model derives from its properties, to which we now turn. Many features of the normal curve model are clearly visible on visual inspection (see Figure 2.2).
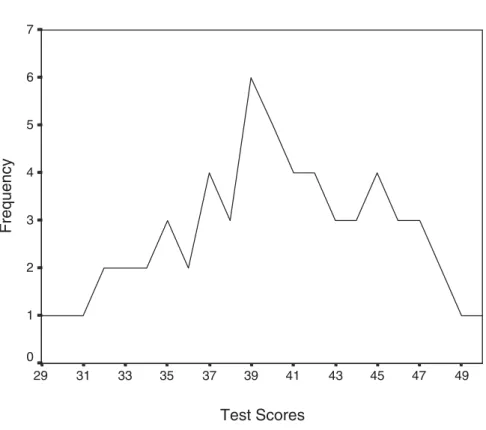
This page has a simple and visually appealing demonstration of the process that results in the bell curve. In testing, this particular application of the normal distribution is used repeatedly in generating the benchmark results described in the next chapter. Creating graphical representations of the obtained distributions allows a comparison of the obtained frequency distributions with the normal distribution.
However, the most widely used index of the amount of correlation between two variables is debatable. Simply put, the effect of a restriction in the range of one of the variables is to reduce the size of afr. Which of the following measurement scales is the only one that has a meaningful zero point.

ESSENTIALS OF TEST SCORE INTERPRETATION
These grade equivalent scores are derived by locating candidates' performance within the standards of the students at each grade level - and fractions of grade levels - in the standardization sample. Relevant factors to consider when constructing the normative sample vary depending on the purpose of the test and the population on which it will be used. Rapid Reference 3.2 lists some of the most common questions test users should ask about normative sampling when evaluating the suitability of a test for their purposes.
In cases like these, the nature of the normative test should be made clear to potential users of the test. However, in relation to the larger population that the normative sample represents, the interpretation of such scores is problematic. The WAIS-III manual (Wechsler, 1997) shows the performance of the standardization tests in tables for different age groups.
These proportions are then located in a table of normal curve areas to obtain z-scores corresponding to these areas (see Appendix C). This is usually achieved by giving both versions of the test to the same group of people. Major revisions to norm-referenced tests, on the other hand, require re-standardization of the test with a new normative sample.
A relevant example of longitudinal changes in personality test performance was seen in the renormation of the MMPI (originally published in the 1940s), which was developed in the 1980s as part of the development of the MMPI-2 (Butcher, Dahlstrom, Graham, Tellegen , & Kaemmer, 1989). In such cases, the validity of inferences made on the basis of scores must be established through empirical associations between test scores and criterion performance. Which of the two objectives is the primary one is determined by the specific purpose of the test user.

ESSENTIALS OF RELIABILITY
Error variance is composed of the differences between test scores that reflect factors irrelevant to what the test assesses. Quick Reference 4.2 lists some of the possible sources of error that can make test results inconsistent. This refers to variations in scores that arise from differences in the subjective judgment of the scorers.
In the example, the teacher's selection of items results in insufficient coverage of the content knowledge that the test is supposed to evaluate. In this particular case, the error in the scores would lower not only the reliability of the scores, but also their validity. of the variance can be attributed to the combined influence of time and content sampling error.
Inspection of the formula in Rapid Reference 4.9 shows that the SEMi is a function of the confidence coefficient. T′= the individual's estimated actual score rxx= estimated reliability of test scores Xo= the individual's achieved score M= the average of the test score distribution. The statistic used for this purpose is the standard error of the difference between scores or SEdiff.
The standard error of the difference for comparing scores from the two tests will be

ESSENTIALS OF VALIDITY
A corollary to this idea, stated explicitly in the Testing Standards (AERA, APA, NCME, 1999), is that “validation is the joint responsibility of the test developer [providing evidence and rationale for the intended use of the test] and the test user [who evaluates the available evidence within the context in which the test will be used]” (p. 11). Rapid Reference 5.1 lists some of the most important contributions to the topic of validity from the 1950s to the 1990s. An important signpost in the development of the concept of validity was the publication of the Technical Recommendations for Psychological Tests and Diagnostic Techniques (APA , 1954), the first in the series of retitled test standards, were revised and updated in and most recently, in 1999 (AERA, APA, NCME).
Test score validity evidence derived from test content can be built into a new instrument from the outset by selecting the items or tasks that are included in the test. In professional settings, the specification of skill or knowledge areas to be selected by the test is based on job analyses. Numerous examples of these tests can be found in the Vocations section of the Classified Test Subject Index in Print VI (Murphy et al., 2002).
One of the most basic examples of this type of process occurs when tests are revised and redesigned. Nevertheless, simpler versions of the MTMMM scheme are increasingly used in the test validation process, based on test scores that measure both similar and different constructs, albeit with similar methods. In the field of cognitive ability, much controversy has centered on the general factor of mental ability, or g (originally posited by Charles Spearman), particularly questions related to its meaning and heritability (Jensen, 1998).
Quick Reference 5.5 describes some of the benefits that can be derived from FA, as well as its main limitations.
Benefits of Factor Analysis
The increased availability of powerful computers and computer software in recent decades has greatly increased the ease with which factor analytic 178 PSYCHOLOGICAL TESTING BELIEFS.
Limitations of Factor Analysis
Confirmatory factor analysis (CFA), briefly mentioned in a previous section, involves the a priori specification of one or more models of the relationships between test scores and the factors or constructs they are designed to assess. The confirmatory factor analyzes conducted with the standardization sample data of the WAIS-III (Psychological Corporation, 1997, pp. 106-110) are typical of the studies designed to provide validity evidence for the psychological test scores. A more advanced presentation of SEM that includes contributions from many of the leading authorities on this methodology can be found in the following:.
Criteria measures are indexes of the criteria that tests are designed to evaluate or predict and are collected independently of the test in question. Rapid Reference 5.7 provides a list of the types of criteria commonly used in validating test scores. When criterion measures are continuous (eg, performance test scores, grades, ratings, etc.), correlation coefficients are the main tools used to indicate the magnitude of the relationship between test scores and the criterion measure.
The strength or quality of validity evidence regarding a criterion's assessment or prediction is a function of the test characteristics used and the criterion measures used. If the criterion measures are unreliable or arbitrary, the validity indices of the test scores will be weakened, regardless of the quality of the test used to assess or predict the criteria. Concurrent validation evidence is collected when indices of the criteria intended to be assessed by the test results are available at the time the validation studies are conducted.
Additional validation evidence for the WIST includes studies conducted in Mexico and Spain with Spanish translations of the instrument.