255
Operational Planning and Control Systems
9
Chapter
Learning Objectives
쐃Describe how functional systems support managers and workers at the operational level.
Understand the support provided by manufacturing and production/operations systems.
Understand the support provided by marketing and sales systems.
Understand the support provided by accounting and finance systems.
Understand the support provided by human resources systems.
Chapter 9 Link Library Quick Look at Chapter 9
Scandinavian Food Retailer Axfood Integrates Operations
9.1
Management Levels, Functions, and Operational Systems9.2
Manufacturing and Production Systems9.3
Sales and Marketing Systems9.4
Accounting and Finance Systems9.5
Human Resource SystemsBusiness Case:
SunWest Foods Blends Data Silos into Real-Time Business KnowledgeNonprofit Case:
Wireless Inventory Management at Dartmouth-Hitchcock Medical CenterAnalysis Using Spreadsheets:
Calculation of Labor Savings at SunWest FoodsCases on Student Web site
9.1 Dollar General Uses Integrated Software 9.2 Regent Inns: Successful Implementation of E-Procurement
9.3 Musco Food Uses IT to Improve Sales and Operations
References
ACC FIN MKT OM HRM IS
Integrating IT
Part IV Operational and Enterprise Systems
and Processes
256
Data sets, including profit margins data360.org
Web Analytics Association webanalyticsassociation.org/
Piwik, open source Web analytics, and alternative to Google Analytics piwik.org/
Google Analytics google.com/analytics
Yahoo! Web Analytics web.analytics.yahoo.com/
Oracle oracle.com
EOQ Tutorial scm.ncsu.edu/public/inventory/6eoq.html Project Management Institute (PMI) pmi.org
WebEx webex.com
Salesforce software salesforce.com
This section introduces you to the business issues, challenges, and IT solutions in Chapter 9. Topics and issues mentioned in the Quick Look are explained in the chapter.
Operational-level information systems(or simply opera- tional ISs) capture and record all of the company’s data from operations and perform the routine transactions needed to conduct business on an ongoing day-to-day basis. They are planning and control systems. At their best, operational ISs put the right information in the right hands at the right time, giving those on the front-line the ability to respond to customers and suppliers, resolve production issues, and react to changing conditions as
quickly as possible. The support provided by operational ISs can be broken into two components:
• Operational awareness:The ability to see at any given time what’s happening in the department or functional area. The business functions are manufacturing and pro- duction, accounting, finance, sales and marketing, and human resources (HR).
• Operational responsiveness:The ability to respond to unexpected changes in conditions and customer demands as they occur, enabling business units to take advantage of opportunities, to protect against threats, and/or to improve efficiency.
QUICK LOOK at Chapter 9, Operational Planning and Control Systems
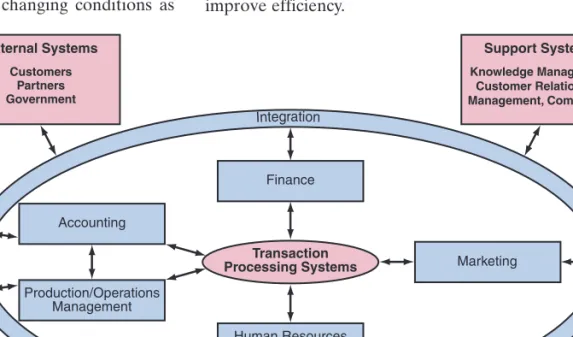
Figure 9.1 Functional areas, TPS, and integration connection. Note the flow of information from the TPS to the functional systems. Flow of information between and among functional systems is done via the integration component.
Accounting External Systems
Customers Partners Government
Support Systems
Finance
Production/Operations Management
teIn
rag
tion
Integration
Integ ratio n Integration
Transaction Processing Systems
Human Resources Management
Marketing
Knowledge Management, Customer Relationship Management, Compliance
In 1999, over 1,300 Scandinavian (Sweden and Finland) food retailers merged, forming Axfood AB. The food retailers had merged to build brand recognition, respond better to increasing customer demands, improve efficiency, and achieve other synergistic effects. In 2006, the company had consoli- dated sales of 28.8 billion SEK (Sweden kronor; approximately 3 billion euros or US$3.7 billion) and over 7,000 employees.
The Axfood Group owns 224 stores in Sweden, with more than 500 additional stores run by independent merchants tied to the company through franchise agreements. In Sweden, its market share is over 15 percent.
Axfood Integrated its Disparate IT to Integrate Operations
Axfood AB is one of the largest food retailers in Scandinavia to unite disparate IT infrastructures and to provide the strate- gic foundation for integrating partners in its delivery chain.
Mats Munkhammar, Axfood’s chief of IT architecture, explained: “As a direct consequence of this consolidation, we were left with a very diverse IT infrastructure with many differ- ent solutions. So we had to go and look for a central integra- tion engine, a platform that would allow us to keep our existing solutions while adding on new components and removing old ones when the time came.” Axfood invested approximately 200 million SEK (20.4 million euros or US$25.6 million) in a common IT platform for the Axfood Group’s core businesses to fully integrate its wholesale and retail operations.
Integrated Scalable and Flexible Architecture
Axfood selected two Progress (progress.com) software prod- ucts: Progress SonicMQ and Progress Sonic ESB (enterprise service bus). Progress Software Corporation is a global software company that enables enterprises to be operationally respon- sive to changing conditions and customer interactions as they occur. (Visit progress.com and click on the tab “What We Offer”
to view their tag cloud,which is discussed in Chapter 8.) These two software apps offer an Internet-ready messag- ing system that integrates disparate applications. Sonic ESB combines messaging, Web services, XML transformation, and intelligent routing—all of which enable managers and workers
to reliably connect and coordinate the interaction of applica- tions across the enterprises.
Axfood’s integrated operational systems enable it to han- dle high-volume POS (point-of-sale) data (see Figure 9.2).
Specifically, the integrated operational systems do the following:
• Coordinate the secure and reliable transmission of POS data from retail locations to a central data warehouse, enabling more efficient inventory management and busi- ness activity monitoring.
• Connect the company’s network of wholesale suppliers and logistics operations, which cut theorder-to-delivery time by 33 percent—from three days to two days. That is, the order- ing process involves not just every department of the com- pany, but also external parties such as suppliers and transportation companies.
• Enable the addition of new solutions for future business processes with minimal incremental investment.
• Help keep shelves stocked with the products consumers want, and that results in increased sales, satisfied cus- tomers, and eventually more stores.
Scandinavian Food Retailer Axfood Integrates Operations
Figure 9.2 Supermarket POS terminal collecting opera- tional data. (Joshua Hodge Photography/iStockphoto)
257 In this chapter, you learn more about functional
information systems that support the operational level of the organization. Functional ISs get much of their data from transaction processing systems, TPSs, which you read about in Chapters 1 and 2. Most applications in busi- ness intelligence, e-commerce, and customer relationship management (CRM) use data from several functional ISs.
As such, getting a complete view of what’s going on
requires integrating the functional systems with the TPS and with external business apps and support systems, as diagrammed in Figure 9.1.
The focus of this chapter is on information systems that support the operational level, or operations, and the benefits and issues of integrating functional ISs shown in Figure 9.1.These systems are critical to the organization’s ability to conduct business and to its performance.
9.1 Management Levels, Functions, and Operational Systems
Three levels of management and decision making are modeled as a pyramid to show their hierarchy. Starting at the bottom of the pyramid shown in Figure 9.3, the lev- els are operational, managerial or administrative, and strategic. Each level of man- agement has its own data needs, decision-making responsibilities, and time horizons.
• At the strategic level,senior or top-level management plan and make decisions that set or impact the long-term direction of the entire organization. These decisions are visionary and future-oriented, defining the mission, objectives, and strategy.
External data about the economy, competitors, and business trends is essential to management’s SWOT (strengths, weaknesses, opportunities, and threats) analysis, planning, and decisions.
• At the managerial or administrative level, middle-level managers make tactical decisions that focus on intermediate-term issues to fulfill the organization’s mission, objectives, and strategy. Control is important at this level. Middle-level managers set goals for their departments or business units that are consistent with organizational goals set by senior management. External and internal data are important for deci- sion making, which often has a one- to three-year time horizon.
• At the operational level, lower-level managers, supervisors, and workers need detailed data, in real time or near real time, and the ability to respond to what they 1. Scenario for Brainstorming and Discussion:Supermarkets,
food retailers, and others in the grocery industry operate on thin (low) profit margins. To maintain profits, they attempt to make up for thin margins with volume. Visit data360.org to compare the profit margins (shown as Data Graphs) of selected industries. The data graph shows that the profit margin of gro- cery sales in 2005 Q4 was .90% (less than 1.00%). In contrast, the profit margins of Internet companies were 21.30% and those of security software were 17.90%. You can see the detailed data by clicking “Generate CSV,” which generates a spreadsheet.
a. Discuss why it makes sense for Axfood to invest approxi- mately 200 million SEK (20.4 million euros or US$25.6 mil- lion) to integrate operations despite its thin profit margin.
investing in the IT to integrate operations? Explain.
2. Debate: Refer to Porter’s five competitive forces that shape strategy model, which you read about in Chapter 1. You can also view Porter discussing that model on YouTube (youtube.com/ ).
a. Debate how and to what extent the increased use of IT to manage operations in the grocery industry and to connect to suppliers, as Axfood has done, impact each of those five forces.
b. Two possible outcomes are that the degree of competition in the grocery industry increases because of required IT investments or it decreases the degree of competition. Select one of those two positions and explain it. You may need to make reasonable assumptions to support your position.
Strategic level
Managerial or administrative level
Operational level
Figure 9.3 Robert Anthony’s model of organizational levels, decision making, planning, and control.
258
learn from functional ISs. Decision making is for the immediate or short-term because decisions are made to control the day-to-day activities or operations. The purpose of control is to identify deviations from objectives and plans as soon as pos- sible in order to take corrective action. Tracking sales, inventory levels, orders, and customer support are examples of control activities. Internal data is most important at this level.
9.1
Management Levels, Functions, and Operational Systems 259Figure 9.4 Preparing factory orders for shipping. (© API/Alamy)
Traditionally, ISs were designed within each functional area to support and increase its effectiveness and efficiency. However, the traditional functional structure may not be the best structure for some organizations, because certain business processes involve activities that are performed in several functional areas. Suppose, for exam- ple, a customer wants to buy a particular product. When the customer’s order arrives at the marketing department, the customer’s credit needs to be approved by finance.
Someone in production/operations (see Figure 9.4) determines whether the product is in the warehouse. If it is there, then picking and shipping departments pack the product, print the mailing label, and arrange for delivery. Accounting prepares a bill for the customer, and finance may arrange for shipping insurance. The flow of work and information between the different departments may not work well, and coordi- nation may be difficult, creating delays or poor customer service.
One solution is to integrate the functional departments via ISs that facilitate com- munication, coordination, and control.
TRADITIONAL
FUNCTIONAL IS DESIGNS
The various operational functions interact, passing data from one to the other. For example, when products are produced and shipped, then production and shipping departments inform the accounting department to process and charge the buyer’s credit card or issue an accounts payable (A/P). In the process, files are generated to record the details of the activity. The data requirements of the operational-level units are extensive and routine, rarely changing because they depend on fixed sources of input and standard operating procedures (SOP).As the term implies, a standard operating procedure, or SOP, is a clearly defined and mandatory procedure to be followed with- out deviation to complete a process or function, such as a quality control process or function. SOPs document the step-by-step ways in which activities are to be performed.
Data in a TPS has a different significance to many other systems. If data is lost, it has financial implications. As such, it is critical that businesses have procedures to ensure that data is secure and accurate and that data integrity is maintained.
• Data security: Data needs to be protected from malicious or unintentional cor- ruption, unauthorized modification, theft, or natural hazards such as fire. Infosec is covered in greater detail in Chapter 5.
• Data accuracy: Every effort is needed to ensure that data is accurate and in stan- dardized format. Data validation is used to detect and correct data entry errors as well as to standardize address data, names, and other data types.
OPERATIONAL SYSTEMS AND DATA QUALITY
• Data integrity: The overall reliability of the data must be ensured. Data integrity with real-time systems involves the ACID test, which is short for atomicity, consis- tency, isolation, and durability:
• Atomicity:If all steps in a transaction are not completed, then the entire trans- action is canceled.
• Consistency:Only operations that meet data validity standards are allowed. For instance, systems that record checking accounts only allow unique check numbers for each transaction. Any operation that repeated a check number would fail to ensure that the data in the database is correct and accurate. Network failures can also cause data consistency problems.
• Isolation: Transactions must be isolated from each other. For example, bank deposits must be isolated from a concurrent transaction involving a withdrawal from the same account. Only when the withdrawal transaction is successfully com- pleted will the new account balance be reported.
• Durability:Backups by themselves do not provide durability. A system crash or other failure must not cause any loss of data in the database. Durability is achieved through separate transaction logs that can be used to re-create all transactions from a known checkpoint. Other ways include database mirrors that replicate the data- base on another server.
Other key characteristics of TPSs are summarized in Table 9.1.
TABLE 9.1 Key Characteristics of a TPS
• Large volumes of data are processed.
• Data sources are mostly internal, and the output is intended mainly for internal users and trading partners.
• Data is processed on a regular basis: hourly, daily, weekly, biweekly, and so on.
• Processing is done at high speed due to the high volume.
• Current or past data is monitored and collected.
• Input and output data are structured. Processed data are fairly stable, so they are for- matted in a standard fashion.
• There is a high level of detailed raw data.
• There is low computation complexity, such as basic math and statistical calculations.
• Accuracy, data integrity, and security are critical. Privacy of personal data is strongly related to TPSs.
• High reliability is required. The TPS is the lifeblood of the organization. Interruptions in the flow of TPS data can disrupt operations and damage the organization.
• Quick search and query processing capacities are a must, often in real time.
Functional systems are composed of subsystems, or modules, that support specific activities performed in the functional area. Examples of subsystems of the key func- tional areas are:
• Manufacturing and production: purchasing, quality control, scheduling, shipping, receiving
• Accounting: accounts receivable, accounts payable, general ledger, budgeting
• Finance: cash management, asset management, credit management, reporting
• Sales and marketing: order tracking, pricing, sales commissions, market research
• HR: payroll, employee benefits, training, compensation, employee relations, staffing, performance appraisal
OPERATIONAL SUBSYSTEMS
Core operations are supported by TPSs that monitor, collect, store, process, and dis- seminate information for all financial and nonfinancial (e.g., hiring) transactions.
Transactions occur when a company produces a product or provides a service.
TRANSACTION
PROCESSING SYSTEMS AND CORE OPERATIONS
For example, to produce cell phones, a manufacturer needs to order materials and parts, pay for labor and electricity, create a shipment order, and bill customers. The bank that maintains the cell phone company’s checking account keeps the account balance up-to-date, disperses funds for the checks written, accepts deposits, and posts statements.
Every transaction generates additional transactions. Purchasing materials changes the inventory level; paying employees reduces cash-on-hand. Because the computations involved in most transactions are simple and the transaction volume is large and repetitive, such transactions are fairly easy to computerize.
Activities and Methods of TPS. Regardless of the specific data processed by a TPS, a fairly standard process occurs, whether in a manufacturer, in a service firm, or in a government organization. First, raw data is collected by people or sensors, and then the data is entered into the computer via input device, as shown in Figure 9.5.
Generally speaking, organizations try to automate the TPS data entry as much as possible to minimize errors and data entry time.
Next, the system processes data in one of two basic ways:batchor online pro- cessing. In batch processing,the firm collects data from transactions as they occur and stores it. The system then prepares and processes the collected data periodically, such as at the end of the workday. Batch processing is useful for operations that require processing for an extended period of time. Once a batch job begins, it con- tinues until it is completed. Examples are payroll and billing.
In online processing,data is processed as soon as the transaction occurs, in real time.
Examples. When a component part is used, an order for a new one is placed. When you place an order online, your credit card authorization is done instantly.
To implement online transaction processing, master transaction files containing data about business entities are stored in an operational database (see Figure 9.6).
In online transaction processing (OLTP),transactions are processed as soon as they occur. Data can be accessed directly from the operational database. The transac- tion files containing data about business activities, such as items ordered, are also stored in online files until they are no longer needed. This series of processes ensures that transaction data is available to all applications and that all data is kept updated.
Data from the TPS can be further processed and stored in a data warehouse.
9.1
Management Levels, Functions, and Operational Systems 261Figure 9.5 Server at a café uses a mobile scanner to process customers’ credit card payment.
(© Chris Cooper-Smith/Alamy)
Figure 9.6 Flow of information
in transaction processing. INPUTS
Transaction Manager
TPS PROGRAMS
• • • UPDATE DATABASE
& PRODUCE TPS REPORTS
Detail Reports, Documents, Other
Outputs
Exception Reports
PROCESSES OUTPUTS
Operational Database with Master Transaction Files
Hard Drive Internal and
External
Downloading and Uploading
Quer and Ans ies
wers User
EVENTS
Data Entry
DETAILS
Exceptions
The flow of data in a TPS is shown in Figure 9.6. An event, such as a customer purchase, is recorded by the TPS program via a barcode reader at a retail checkout.
The processed data (output) can be in the form of a report. Users can query the TPS for information, such as “How many units of item A were sold each month of year 20XX?”The system will provide the appropriate answer by accessing a database con- taining transaction data, as shown with the bidirectional arrows in Figure 9.6.
Web-Based and Online Transaction Processing Systems. With OLTP and Web technologies such as portals and extranets, suppliers can look at the firm’s inventory level or production schedule in real time. Suppliers are then able to assume respon- sibility for inventory management and ordering in what is known as vendor-managed inventory (VMI).Customers, too, can enter data into the TPS to track orders directly.
Other Web-based applications are described in IT at Work9.1.
IT at Work 9.1 w
Here are examples of how TPSs have saved time or money.
Domino’s Pizza. Domino’s uses Microsoft’s Tellme service to route thousands of callers to its nearest outlet. The system is experimenting with automatic order taking. When a customer calls and says “delivery,” the system checks to see if the customer has called before and reads back the address where the delivery is to be made. Voice technologies are popular in other customer serv- ice applications, including wireless ones.
FedEx-Kinko’s. Each time you make a copy at Kinko’s, both a copying transaction and a payment transaction occur. In the past you received a device (a card, the size of a credit card) and inserted it into a control device attached to the copy machine, and it recorded the number of copies that you made. Then you stood in line to pay: The cashier placed the device in a reader to see how many copies were made. Your bill was computed, with tax added.
Kinko’s cost was high with this system, and some customers were unhappy about standing in line to pay for only a few copies. With Kinko’s new system, you insert your credit card into a control device, make the copies, print a receipt, and you’re done.
Carnival Line. Carnival Line, the operator of cruise ships, needs to rapidly process up to 2,500 people leaving the ship at the ports of call and later returning to the ship. The company used
to use printed name lists for manual checkmarks. Today, passen- gers place a smart card into a reader so the company knows who left the ship, when, and who returned. Each smart card reader can process over 1,000 people in 30 minutes. In the past, 10 to 15 employees processed passengers leaving and returning to the ship, which took almost an hour. Now, one person supervises two card readers.
UPS Store. Seconds after you enter an address and a zip code into a terminal at UPS delivery outlets at a UPS Store, a shipping label and a receipt are generated. Your shipping record stays in the database, so if you send another package to the same per- son, you do not need to repeat the address again.
Sprint Inc. Sprint Inc. has improved its order processing for new cell phones. In the past it took a few days for a customer to get a new telephone line. With its new system, Sprint can process an order in a few hours. The order application itself takes less than 10 minutes, experiences fewer errors, and can be executed on electronic forms on a salesperson’s desktop or laptop computer.
Discussion Questions:Could Kinko’s operate completely without employees at its outlets? What effect does Carnival’s smart-card reader have on security? Whose time is being saved at UPS and Sprint?
TPS Cuts Delivery Time and Saves Money
Transaction processing exists in all functional areas. Here we describe in detail one application that crosses several functional areas—order processing.
Order Processing. Orders for goods or services may flow from customers to a com- pany via a smart device, Web site, fax, or other electronic method. Fast and effective order processing is a key to customer satisfaction. Orders can also be internal—from TASKS IN TRANSACTION
PROCESSING
ACC
MKT OM
9.1
Management Levels, Functions, and Operational Systems 263one department to another. Once orders arrive, an order processing system needs to receive, document, route, summarize, and store the orders.
Some companies spend millions of dollars reengineering their order processing as part of their transformation to e-business. IBM, for example, restructured its pro- curement system so its purchasing orders (POs) are generated quickly and inexpen- sively in its e-procurement system.
Web Analytics. Web analyticsis the analysis of data generated by visitors’ behav- ior on a company’s Web site. That data is referred to as clickstream data.Web ana- lytics begins by identifying the data that can be used to assess the effectiveness of the site’s goals and objectives. For example, frequent visits to the site map may indi- cate navigation problems. Abandoning shopping carts repeatedly when the shipping charges are added indicates another problem.
Next, analytics data is collected, such as where site visitors are coming from, what pages they look at and for how long, and how they interact with the site’s informa- tion. For example, the data can reveal the impact of an online advertising campaign, the effectiveness of Web site design and navigation, and, most important, visitor buy- ing behavior. Because the goal of e-commerce sites is to sell a product or service, the most valuable Web analytics are those related to step-by-step conversion of a visi- tor to a customer.
Other typical TPS activities performed by managers in various functional areas are summarized in Table 9.2.
IT at Work 9.2 w
First Choice Ski (firstchoice-ski.co.uk/) holds a 14 percent market share of the online U.K. ski market. TUI Travel, its parent company, is an international leisure travel group that operates in 180 coun- tries and serves more than 30 million customers.
In the highly competitive tour operator industry, margins are tight. As a result, real-time reporting is key to maintaining a prof- itable business. By using Yahoo! Web Analytics (web.analytics.
yahoo.com/ ), First Choice Ski was able to gain enough insight into its customers to respond in near real time to their online behaviors—
by revamping its travel Web site.
First Choice Ski Tracks Customers’ Behaviors. At First Choice Ski, customers spend a lot of time researching and selecting their vacation. Simon Rigglesworth, e-commerce manager, explained:
“We see users return multiple times from multiple sources such as paid search, e-mail, and even social networking as they try to find the vacation that suits them the best. Capturing as much infor- mation as possible allows us to identify the best way to complete the sale and optimize for it.”
After experimenting with fee-based analytics packages, First Choice Ski selected Yahoo! Web Analytics (YWA), which is free. Web analyst Penelope Bellegarde used theSearch Phrases Report in YWA to leverage factors driving visitors to First Choice Ski. She said: “If we notice a specific destination is driving a lot of visits to the site, then it is very likely we will promote that destination on the homepage.”
The Internal Campaign Report is valuable because of the numerous travel promotions on First Choice Ski. Bellegarde mon- itors the number of clicks and number of sales generated by the campaigns; when a low ratio of sales to clicks is noticed, she adjusts the campaign accordingly.
Performance Improvements. Using these different data sets and tools from YWA, TUI redesigned and changed the content of its First Choice Ski homepage. As a result, the homepage experienced an 18 percent decrease in bounce rate and a 13 percent decrease in exit rate—with more than two-thirds of the improvement directly attributed to the changes made. More importantly, the number of sales driven by the homepage increased 266 percent.
“We are now generating quantifiable, actionable, data-driven processes for prioritizing and reviewing website developments,”
says Rigglesworth.
Sources: Compiled from firstchoice-ski.co.uk/ and Yahoo.com/.
Discussion Questions: How is being able to respond quickly to visitors’ clickstream behavior related to the company’s profit mar- gin? Recall the principle: If you can’t measure it, you can’t man- age it. Explain how this case illustrates this principle. Does Web analytics impact barriers to entry and rivalry among incumbents in this industry?
Yahoo! Web Analytics Helps First Choice Ski Triple Sales
IT at Work 9.3 w
TIAA-CREF (tiaa-cref.org/) is a huge company serving the retire- ment, insurance, and other financial needs of teachers and pro- fessors. It is one of the largest financial institutions of its kind.
In September 2005, thousands of TIAA-CREF members were unable to withdraw funds from their pensions. The company assured clients that this was just a small delay due to the IT plat- form upgrade. However, the problems continued for months and expanded to interfere with deposits as well. The cause of the problem was the introduction of the powerful new IT platform, Open Plan Solutions. Open Plan Solutions was to integrate fixed annuities, variable annuities, mutual funds, and homegrown plat- forms onto a single, connected platform with:
• Flexible, state-of-the-art record keeping
• Streamlined enrollment process
• Comprehensive remittance services
• Improved Web-based institutional reporting on accumulations, transactions, and salary reduction agreements
• New and improved participant quarterly statements
The integrated platform did not synchronize the company’s Web-access software and the recordkeeping system during the batch transaction processing. In other words, the new system was not in sync with the old one. By April 2006, the problem had become a disaster because of the inability to solve all of the IT integration problems fast enough. At that time, the company set up a new cross-functional team to catch issues before they escalated.
Sources: Compiled from Boucher-Ferguson (2006a, 2006b) and TIAA-CREF (2007).
Discussion Questions: What factors—technical and managerial—
contributed to TIAA-CREF’s data problems? How could each of these contributing factors be minimized? What lessons does this case teach other companies?
TIAA-CREF Reporting Failure
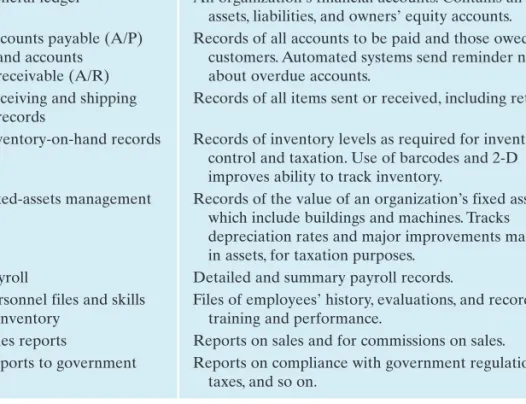
TABLE 9.2 Descriptions of TPS Activities
Activities Description
General ledger An organization’s financial accounts. Contains all of the assets, liabilities, and owners’ equity accounts.
Accounts payable (A/P) Records of all accounts to be paid and those owed by and accounts customers. Automated systems send reminder notes receivable (A/R) about overdue accounts.
Receiving and shipping Records of all items sent or received, including returns.
records
Inventory-on-hand records Records of inventory levels as required for inventory control and taxation. Use of barcodes and 2-D improves ability to track inventory.
Fixed-assets management Records of the value of an organization’s fixed assets, which include buildings and machines. Tracks depreciation rates and major improvements made in assets, for taxation purposes.
Payroll Detailed and summary payroll records.
Personnel files and skills Files of employees’ history, evaluations, and records of
inventory training and performance.
Sales reports Reports on sales and for commissions on sales.
Reports to government Reports on compliance with government regulations, taxes, and so on.
TPS failure can cause a disaster. The U.S. Social Security Administration had some major TPS failures, as did insurance companies, hospitals, and banks. One might think that a large financial institution should be immune from IT failure, but this was not the case with TIAA-CREF, as illustrated in IT at Work9.3.
WHAT IF A TPS FAILS?
FIN
9.2 Manufacturing and Production Systems
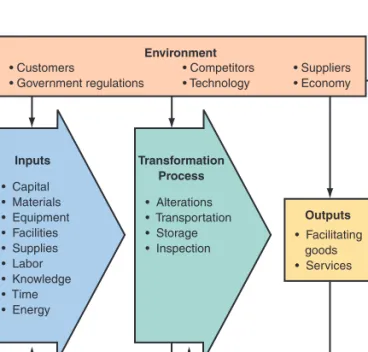
The production and operations management(POM) function in an organization is responsible for the processes that transform inputs into useful outputs, as shown in Figure 9.7. Compared to other functional areas, POM covers diverse activities. It also differs considerably among organizations. For example, manufacturers use completely different processes than service organizations, and a hospital operates much differ- ently than a government agency.
Next, we present two IT-supported POM topics: in-house logistics and materi- als management and computer-integrated manufacturing (CIM).
9.2
Manufacturing and Production Systems 265Logistics management deals with ordering, purchasing, inbound logistics (receiving), and outbound logistics (shipping) activities. In-house logistics activities are processes that cross several functional departments. Both conventional purchasing and e-procurement result in incoming raw materials and parts, which constitute inventory or stock. Materials are tracked from the time they are received until they’re distributed—or disposed of when they become obsolete or their quality becomes unacceptable.
Scanners, RFID, and voice technologies support inspection, and robots can per- form distribution and materials handling.Robotsare programmable machines. Large warehouses use robots to bring materials and parts from storage, when needed. Parts are stored in bins, and the bins are stacked one above the other similar to the way safe deposit boxes are organized in banks. Whenever a part is needed, the stock- keeper keys in the part number. The mobile robot travels to the part’s location, takes the bin out of its location using magnetic force, and brings the bin to the stockkeeper.
Once a part is taken out of the bin, the robot is instructed to return the bin to its permanent location.
IN-HOUSE LOGISTICS, AND INVENTORY CONTROL AND MANAGEMENT
Review Questions
1. Explain Robert Anthony’s management hierarchy (see Figure 9.3).
2. List the major characteristics of TPSs.
3. Describe the importance of high-quality (error-free) data entry.
4. List five typical TPS activities.
5. Describe the importance of Web analytics and show some of its applications.
Data Data Data
Action Action
Environment
• Customers
• Government regulations
• Competitors
• Technology
• Suppliers
• Economy
• Capital
• Materials
• Equipment
• Facilities
• Supplies
• Labor
• Knowledge
• Time
• Energy Inputs
• Alterations
• Transportation
• Storage
• Inspection Transformation
Process
• Facilitating goods
• Services Outputs
Monitoring and control
Figure 9.7 Production operations management (POM) functions transform inputs into useful outputs.
OM
Figure 9.8 is a photo of an industrial robot that’s used to handle and transport inventory from storage. In intelligent buildings in Japan, robots bring files to employ- ees and return them for storage. In some hospitals, robots dispense medications.
Inventory Control. The function of inventory control(also called stock control or inventory management) is to minimize the total cost of inventory. The objective is to maintain optimal inventory levels by reordering the correct quantity at the right time. POM departments may keep safety stockas a hedge against running out of inventory. Safety stock is extra inventory in case of unexpected events, such as spikes in demand or longer delivery times. It is often called buffer stock.The absence of inventory is called a shortage.
Managing inventory is important to profits because there are numerous costs associated with inventory. Inventory control systems minimize the following three categories of cost:
1. Cost of holding inventory: warehousing costs, security costs, insurance, losses due to theft or obsolescence, inventory financing costs based on the interest rate 2. Cost of ordering and shipping: employees’ time ordering and receiving, shipping fees 3. Cost of inventory shortage: production delays and forgone revenues because of stockouts
Because of these costs, the POM department has two decisions to make:
• When to order
• How much to order
One inventory model that is used to answer both questions is the economic order quantity (EOQ)model. The EOQ model takes all of those costs into consideration.
A tutorial on EOQ, including its assumptions and equations, is available at scm.ncsu.edu/public/inventory/6eoq.html.
Dozens of other inventory control models exist because inventory scenarios can be diverse and complex. A large number of commercial inventory software packages to automate the application of these models are available at low cost. Minimizing inventory costs is a major objective of supply chain management.
Just-in-Time Inventory Management and Lean Manufacturing. Just-in-time (JIT) inventory management is an alternative method whose objective is to minimize hold- ing costs by not taking possession of inventory until it is needed in the production process. JIT was developed by Toyota and is used extensively in the auto manufac- turing industry. For example, if parts and subassemblies arrive at a workstation exactly when needed, there is no need to hold inventory. There are no delays in production, and there are no idle production facilities or underutilized workers, provided that parts and subassemblies arrive on schedule and in usable condition. Many JIT systems are supported by software from vendors such as HP, IBM, CA, and Cincom Systems.
Oracle, Siemens, and other vendors offer demand-driven lean manufacturing, which is a derivative of JIT. The objective of lean manufacturing is to remove waste of any kind from production. Waste can be unnecessary labor, material space, energy, or rework due to poor quality control. Like any IS, JIT needs to be justified with a cost-benefit analysis. Also, all of the assumptions that the JIT model is based on must exist. For example, JIT is based on the assumption that inventory will arrive on sched- ule. For companies subject to bad weather or labor strikes, that assumption is not valid.
Quality Control. Manufacturing quality control (QC) systems can be stand-alone systems or can be part of an enterprise-wide total quality management (TQM) effort.
QC systems provide data about the quality of incoming materials and parts, as well as the quality of in-process semifinished and finished products. Such systems record the results of all inspections and compare actual results to expected results.
QC data may be collected by Web-based sensors and interpreted in real time, or it can be stored in a database for future analysis. Also, RFID systems collect data.
Figure 9.8 Industrial robot handles boxes of sugar.
(©David J. Green-industry/Alamy)
Periodic reports are generated, such as percentage of defects or percentage of rework needed, and management can compare performance among departments on a reg- ular basis or as needed. For example, KIA Motors introduced an intelligent QC sys- tem to analyze customer complaints so it could more quickly investigate and make corrections. The analysis was done with data mining tools.
Project Management. Aproject is a collection of tasks to achieve a result, such as implementing a new JIT inventory management system. Projects have a defined beginning and end as well as a scope, resources, and a budget. Projects are approved before they are allocated resources.Projectsdiffer from operations, or business as usual, because of their uniqueness.
Projects have these characteristics:
• Are unique undertakings
• Have a high degree of uncertainty with respect to costs and completion times due to the generally long length
• Involve participation of outsiders, which is difficult to control
• Require extensive interaction among participants
• May compete and conflict with other business activities, making changes in plan- ning and scheduling difficult
• Involve high risk of delay, failure, and costly changes, but also have high profit potential or benefit
The management of projects is enhanced by computerized project management tools such as the program evaluation and review technique(PERT) and the critical path method(CPM). For example, developing a social media campaign can be a major project, and several IT tools are available to support and help manage the tasks.
Other POM Areas. Many other areas of POM are improved by IT. Web-based pro- duction planning optimization tools, product routing and tracking systems, order man- agement, factory layout planning and design, and other tasks can be supported by POM subsystems. For example, a Web-based system at Office Depot matches employee scheduling with store traffic patterns to increase customer satisfaction and reduce costs. Schurman Fine Papers, a manufacturer/retailer of greeting cards and specialty products, uses special warehouse management software to improve demand forecasting and inventory processes. Its two warehouses efficiently distrib- ute products to over 30,000 retail stores.
9.2
Manufacturing and Production Systems 267Computer-integrated manufacturing (CIM)is a concept promoting the integration of various computerized factory systems. CIM has three basic goals: (1) the simpli- ficationof all manufacturing technologies and techniques, (2) automationof as many of the manufacturing processes as possible, and (3) integration and coordinationof all aspects of design, manufacturing, and related functions via computer hardware and software.
The major advantages of CIM are its comprehensiveness and flexibility. These are especially important in business processes that are being completely reengineered or eliminated.Without CIM, it may be necessary to make large investments to change existing ISs to fit the new processes.
COMPUTER-INTEGRATED MANUFACTURING
Review Questions
1. What is the function of POM in an organization? How can it be enhanced with IT?
2. What is a robot? How does it differ from a machine?
3. What are the three categories of inventory costs?
4. Explain the difference between EOQ and JIT inventory models.
5. Explain the difference between a project and operations.
6. What is CIM?
9.3 Sales and Marketing Systems
In Chapters 1, 7, and 8, you read about marketing channels, interoperability, e-commerce, and social media—all are types of sales and marketing ISs. In this section, we describe marketing systems for best-in-class performance.
In general, sales and marketing systems support market research, getting prod- ucts and services to customers, and responding to customers’ needs. Many of these systems and subsystems are shown in Figure 9.9. As you notice, marketing ISs have numerous components—sales, research, intelligence, reporting, procurement, logis- tics, and delivery. Interoperability enhances market power and presence.
Chapters 7, 8, and 10 cover sales and marketing systems and strategies, includ- ing e-commerce and customer relationship management (CRM). This section will focus on data-driven marketing and components of marketing ISs.
SALE
Market Intelligence Systems
Target Marketing Systems
Customer Support Systems Sales Systems
Dealer Systems
Delivery Systems
• Customer Profiling and Segmentation
• Market Tracking
• Competitor Surveillance
• New Product Development
• Decision Support, BI Predictive Analysis
• Trend Monitoring
• Cross-Selling
• ADS for Pricing
• Marketing and Sales Support and Services
• Value-Added Partnerships
• Dealers’
Communications
• Business Management Support Functions
• Database Marketing
• Telemarketing
• Niche/Regional Marketing and Microsegmentation
• Customer Profitability Analysis
• Internet Marketing
• Communications with the Field
• Sales Process/
Account Management
• Selling Aids/Sales Force Support
• Selling Aids/Point of Purchase
• Prospecting
• Wireless Sales Force Automation
• Internet Marketing
• Customer Communications
• Customer Satisfaction
• Service and Support
• Training/User Education
• Usage Enhancement
• Customer Portals
• Social Networking
• EDI
• Demand Forecasting
• Inventory Management
• Order Entry and Fulfillment
• Invoicing
• Sourcing
• Time-to-Market Reduction
• RFID
Channel Systems Channel Systems
Manufacturing R&D/Design
Distribution Accounting/
Finance
The Selling The Selling Company Company
Figure 9.9 Marketing channel systems.
Marketing ISs are more than a system of data collection or a set of information tech- nologies. They consist of people, equipment, and procedures to gather, sort, analyze, evaluate, and distribute relevant, timely, complete, and accurate data for use by mar- keting decision makers to improve their marketing planning, implementation, and control. The focus is on data-driven, fact-based marketing. Data mining, discussed in Chapter 10, is the primary method for data-driven marketing.
DATA-DRIVEN MARKETING
There is no shortage of customer and sales data, but there is a shortage of reli- able, high-quality data and insight about how to use that data for better decisions that improve performance. In the August 2008 benchmark study, “Customer Analytics: Segmentation Beyond Demographics,” all respondents identified that their top two data-related challenges were poor data quality (62 percent) and the inability to collect or access the data needed to calculate key performance metrics (31 percent) (Aberdeen Group, 2008).
9.3
Sales and Marketing Systems 269Here are some representative examples of how marketing management is being done.
Pricing of Products or Services. Sales volumes are largely determined by the prices of products or services. Price is also a major determinant of profit. Pricing is a diffi- cult decision, and prices may need to be changed frequently, as is true for First Choice Ski, which is discussed in IT at Work 9.2. For example, in response to price changes made by competitors, a company may need to adjust its prices quickly or take other actions. Checking competitors’ prices is commonly done by retailers, often using wire- less price checkers, for example, PriceMaster Plus, from SoftwarePlus. These devices make data collection easy.
MARKETING MANAGEMENT
Organizations distribute their products and services through a combination of electronic, mobile, and physical channels. Here are representative topics relating to distribution channels.
• Kiosks at 7-Eleven stores in some countries can be used to place orders on the Internet. In Macy’s, you can check the current price on computerized screens with barcode readers.
• Some stores that have many customers who pay by check have installed check- writers. All you have to do is submit the blank check to the cashier, who runs it through a machine attached to the cash register. The machine prints the name of the store as the payee and the amount, you sign the check, and in seconds the check is validated, your bank account is debited, and you are out of the store with your merchandise.
• The Exxon Mobil Speedpass allows customers to fill their tanks by waving a token, embedded with an RFID device, at a gas-pump sensor. Then the RFID starts an authorization process, and the purchase is charged to your debit or credit card.
Customers no longer need to carry their Mobil corporation credit cards.
• An increasing number of retailers are installing self-checkout machines. For exam- ple, Home Depot has self-checkouts in its stores. Not only does the retailer save the cost of employees’ salaries, but customers are happier for saving time. And some enjoy “playing cashier” briefly. A major vendor is U-Scan, which is used in many supermarkets, shown in Figure 9.10. RFIDs are improving the process even further.
DISTRIBUTION CHANNELS
Figure 9.10 U-Scan kiosk.
(Sonda Dawes/The Image Works)
Salesperson Productivity. Salespeople differ from each other; some excel in sell- ing certain products while others excel in selling to a certain type of customer or in a certain geographic zone. This information, which is usually collected in the sales and marketing TPS, can be analyzed using a comparative performance system in which sales data categorized by salesperson, product, region, and even time of day is evaluated.Actual current sales can be compared to historical data and to standards.
Multidimensional spreadsheet software facilitates this type of analysis. Assignment of salespeople to regions and/or products and the calculation of bonuses can also be supported by this system. Wireless systems are used extensively by salespeople.
In addition, sales productivity can be boosted by Web-based call centers. When a customer calls a sales rep, the rep can look at the customer’s history of purchases, demographics, services available where the customer lives, and more. This informa- tion enables reps to work faster while providing better customer service.
Sales automation software is especially helpful to small businesses, enabling them to rapidly increase sales and growth. A leading software is salesforce.com,which is a CRM application that is offered as a software-as-a-service (SaaS). You will read about Salesforce.com in the CRM section of Chapter 10.
Profitability Analysis. In deciding on advertising and other marketing efforts, man- agers need to know the profit contribution of certain products and services.
Profitability metrics for products and services can be derived from the cost-accounting system. For example, profit performance analysis software available from IBM, Oracle, SAS, and Microstrategy is designed to help managers assess and improve the profit performance of their line of business, products, distribution channels, sales regions, and other dimensions critical to managing the enterprise. Several airlines, for example, use automated decision systems to set prices based on profitability.
New Products, Services, and Market Planning. The introduction of new or improved products and services can be expensive and risky. An important question to ask about a new product or service is, “Will it sell?” An appropriate answer calls for careful analysis, planning, and forecasting. These can best be executed with the aid of IT because of the large number of determining factors and the uncertainties that may be involved; for example, see the discussion of using predictive analysis in Chapter 10. Market research also can be conducted on the Internet.
Marketing activities conclude the primary activities of the value chain. Next we look at the functional systems that are support activities(also called secondary activ- ities) in the value chain: accounting/finance and human resources management.
Review Questions
1. Define data-driven marketing.
2. Identify several distribution channels.
3. How does IT support marketing and sales?
4. What marketing strategies can be enhanced by the Web?
9.4 Accounting and Finance Systems
Accounting and finance control and manage cash flows, assets, liabilities, and net income or profit as well as issue financial statements to regulatory agencies. Another critical responsibility is the prevention, detection, and investigation of fraud.
In companies with lax accounting systems, it is too easy for employees to mis- direct purchase orders and payments, bribe a supplier, or manipulate accounting data.
If senior managers are involved in the fraud, preventing fraud is extremely tough.
Consider Bernie Madoff, who committed record-setting fraud for many years even after the Sarbanes-Oxley Act was passed to prevent financial fraud.
9.4
Accounting and Finance Systems 271Fraud is easy to commit and hard to detect. Just ask any auditor. There are count- less ways to hide fiscal malfeasance.The problem may be exacerbated in government and nonprofit entities, which rarely have adequate accounting and internal control systems.The problem is so bad at the federal level that auditors are unable to express an opinion on the fairness of the consolidated financial statements of the United States. For example, NASA, the space agency, was unable to explain $565 billion in year-end adjustments to its books. It could have been the result of bad accounting, fraud, waste, or abuse. Without adequate records, no one really knows. This amount is astounding, especially when one considers that the combined cost of fraud in the Enron and WorldCom scandals was less than $100 billion in shareholder equity.
Because physical possession of stolen property is no longer required and it’s just as easy to program a computer to misdirect $100,000 as it is $1,000, the size and num- ber of frauds have increased tremendously. See IT at Work 9.4, which describes a real- life case.
AUDITING INFORMATION SYSTEMS
Management of financial assets is a major task in financial planning and budgeting.
Managers must plan for both the acquisition of financial resources and their use.
Financial planning, like any other functional planning, is tied to the overall organi- zational planning and to other functional areas. It is divided into short-, medium-, and long-term horizons, much like activities planning.
Financial and Economic Forecasting and Budgeting. Knowledge about the avail- ability and cost of money is a key ingredient for successful financial planning.
FINANCIAL PLANNING AND BUDGETING
IT at Work 9.4 w
Chris was a compulsive gambler, and she hid it well. Her problem began innocently at work when one day a casino Web site popped up on her computer as she surfed the Internet during lunch. She placed a few bets using the free credits offered by the site to entice first-time players. She won, and that gave her a thrilling feel- ing, she would later explain to fraud investigators.
Two years later, as the payroll manager of a medium-sized manufacturing firm, Chris had defrauded her employer of over
$750,000. Why did she do it? To pay off her gambling losses, an average of $7,000 a week. How did she do it? By taking advan- tage of the lack of proper controls in her company’s payroll and accounting information systems and controls.
Chris’s Employment History and Deception. Chris had worked at the company for a decade. Her performance reviews described her as hardworking, reliable, and loyal but did not mention that she felt underpaid. Chris was bitter, thinking her employer didn’t treat her fairly. When her gambling began to spiral out of control, she turned to fraud. “As far as I was concerned, they owed me,”
she told the forensic accountants.
The company’s HR manager and comptroller were supposed to review Chris’s work. But the HR manager focused on providing her with the correct data for employees’ wages and benefits. The comptroller appeared not to have exercised control over payroll processing, which Chris knew.
Chris’s primary deception was two phony employees she set up on the company’s hourly payroll system as a new and
separate cost center. As she processed and received the records sent to and from an external payroll provider (EPP) without effective oversight, she was able to control the scheme without detection. The phantom employees’ checks were drawn up manually by EPP, sent to Chris, and deposited into an account she had in a bank near her home. Near the end of the year, she also had EPP make adjustments to the payroll register to elim- inate the amounts paid to the phony employees. When she went on vacation, she deactivated the two phony names from the payroll.
Fraud Scheme. Chris started paying herself for unauthorized overtime. At first, this plan proved to be a great success—she paid herself for 1,500 hours of overtime over two years as opposed to the actual 50 she did work. Chris falsified records and increased the size of her theft until the HR manager finally noticed. When she was confronted with the evidence, she confessed that she had spent all the money on gambling and could not repay.
Discussion Questions:What role did trust play in Chris’s ability to commit fraud for so long (that is, the employer’s trust in Chris)?
What role did weak accounting ISs play in her ability to commit fraud? In your opinion, if Chris knew that strong accounting ISs were in place, would that have deterred her from trying to steal from her company?
Lax Accounting Systems Enable Employee Fraud
ACC FINEspecially important is the projection of cash flows, which tells organizations what funds they need and when as well as how they will acquire them. In today’s tough economic conditions with tight credit and limited availability of funds, this function has become critical to the company’s survival.
Inaccurate cash flow projection is the number-one reason why many small busi- nesses go bankrupt. The inability to access credit led to the demise of the investment bank Lehman Brothers in September 2008.
The best-known part of financial planning is the annual budget, which allocates the financial resources of an organization among participants, activities, and projects.
The budget is the financial expression of the organization’s plans. It allows manage- ment to allocate resources in the way that best supports the organization’s mission and goals. IT enables the introduction of financial logic and efficiency into the budg- eting process.
Several software packages, many of which are Web-based, are available to sup- port budget preparation and control. Examples are budgeting modules from Oracle (oracle.com) and Capterra.com, which facilitate communication among participants in budget preparation. Software support for budgeting and forecasting is available from Prophix (prophix.com).The key benefits of the package are a familiar Windows Explorer interface, customizable flexibility that supports a variety of budgeting tem- plates, a controlled database that secures data and allows for multiple user accessi- bility, and data manipulation tools for complex budgeting.
The major benefits of using budgeting software are that it can reduce the time and effort involved in the budget process, explore and analyze the implications of organizational and environmental changes, facilitate the integration of the corporate strategic objectives with operational plans, make planning an ongoing continuous process, and automatically monitor exceptions for patterns and trends.
Capital Budgeting. Capital budgeting is the process of identifying the financing of assets, including software, that need to be acquired or developed. It includes com- paring alternatives or evaluating buy-versus-lease options.
Bill of Materials
Work Order Processing
Job Cost
Point of Sale Investor
Manage- ment
E-commerce
MRP
Executive Information
Systems Barcoding
Web Services
Work Orders
ASP
Time and Billing
Financial Reporting Business SFA
Intelligence
Data Migrator
E-inquiry
Wireless
Report Writer Accounts
Receivable
Accounting Modules Functional
Applications and Integration
Communications Modules
Payroll
Bank Reconcilia-
tion
Purchase Order Processing Fixed
Assets Manage-
ment Sales Order
Processing
Accounts Payable General
Ledger
Figure 9.11 Integrated accounting/business software.
9.4
Accounting and Finance Systems 273 Capital budgeting analysis uses standard financial models, such as net present value (NPV), internal rate of return (IRR), and payback period to evaluate alterna- tive investment decisions. Excel and other spreadsheet packages include built-in func- tions of these models.Accounting/finance ISs are also responsible for gathering the raw data neces- sary for the accounting/finance TPS, transforming the data into information, and mak- ing the information available to users, whether aggregate information about payroll, the organization’s internal reports, or external reports to stockholders or government agencies, which is illustrated in Figure 9.11.
The accounting/finance TPS also provides a complete, reliable audit trail of all routine transactions transmitted through the network.This feature is vital to account- ants and auditors.
XBRL: eXtensible Business Reporting Language. As you read in Chapter 8, XBRL is a programming language and an international standard for electronic transmission of business and financial information. As of September 2005, it can be used to file financial reports electronically with the SEC and FDIC. With XBRL, all of the company’s financial data is collected, consolidated, published, and con- sumed without the need to use Excel spreadsheets. Figure 9.12 illustrates how XBRL works. Such submission allows government analysts to validate information
Figure 9.12 How XBRL works.
submitted in hours instead of two to three weeks. XBRL helps financial institutes do the fol