Accurate optical measurement of corneal thickness is based on accurate knowledge of the corneal refractive index at the wavelength of measurement. The cells in the basal periphery are columnar, and the cells of the central surface are squamous. Biomechanical models of the cornea are used to predict the safety factor of a given surgical change.
Optical measurement of the geometric thickness of the cornea requires the multiplication of the assumed refractive index and the measured optical thickness. The refractive index of the cornea is known to change with hydration, and the refractive index is also a function of wavelength. Another key difference between these disc formats is the required NA of the objective lens.
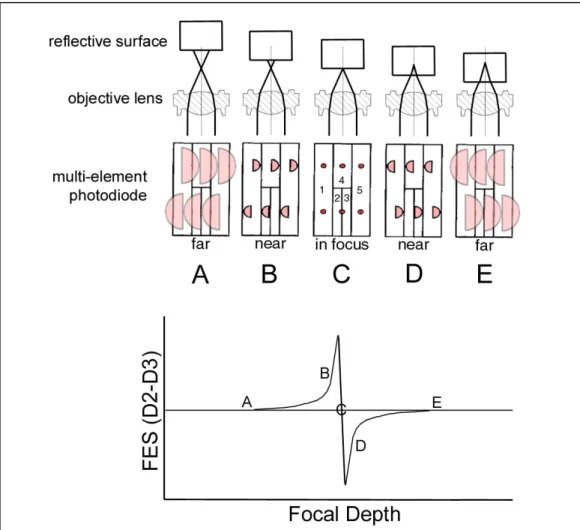
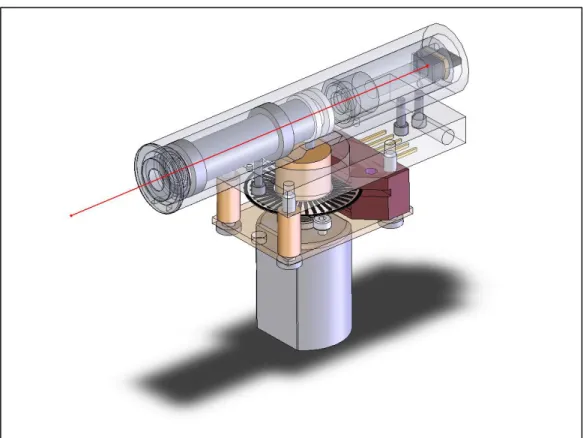
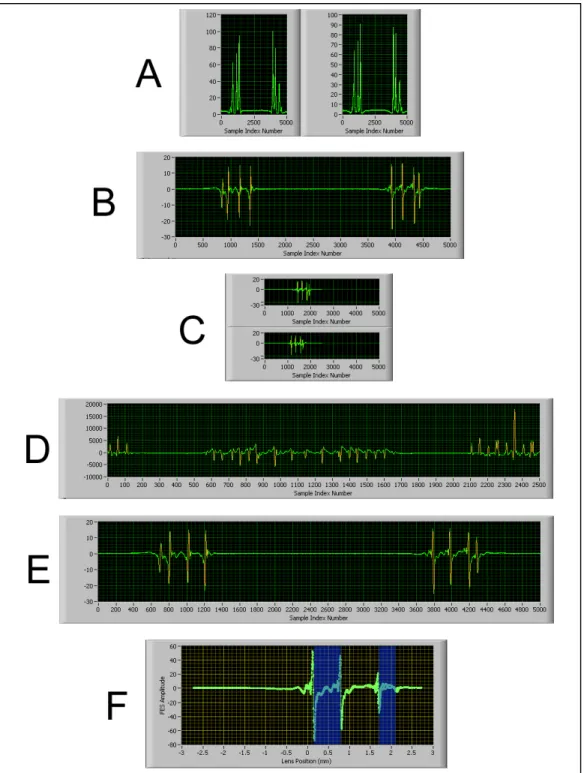
The system must simultaneously measure the optical signals from the hologram laser photodiode elements and the position of the objective lens. The cross-correlation of these two blocks is calculated as a function of the fold point (D). In particular, accurate optical measurements of corneal thickness require knowledge of the corneal refractive index.
The equation for the refractive index of the extrafibrillar material can be rewritten in terms of the dry collagen fibril/stroma volume fraction (fc/s) and the hydrated fibril/stroma volume fraction (ff/s).
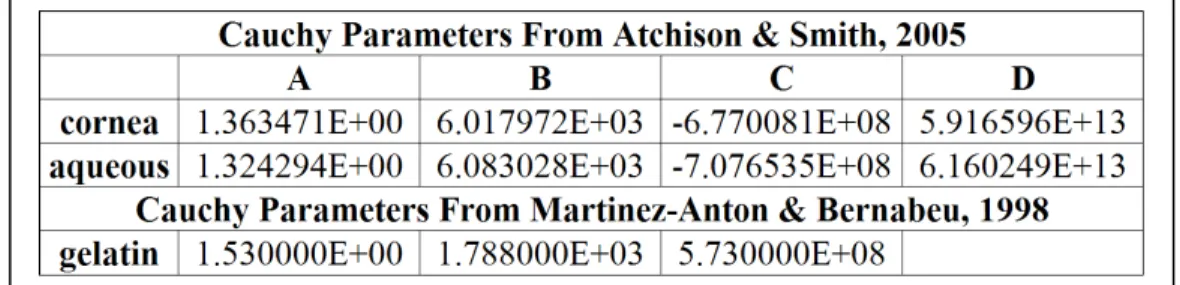
A Bn Cauchy
15 – Geometric thickness, optical thickness and mass of corneal buttons were measured during slow dehydration. The shape of the drying curve is similar to previously published data and models (Meek, Dennis, & Khan, 2003). 16 – The refractive index of the cornea at 780 nm as a function of hydration is calculated by dividing the measured geometric thickness by the measured optical thickness.
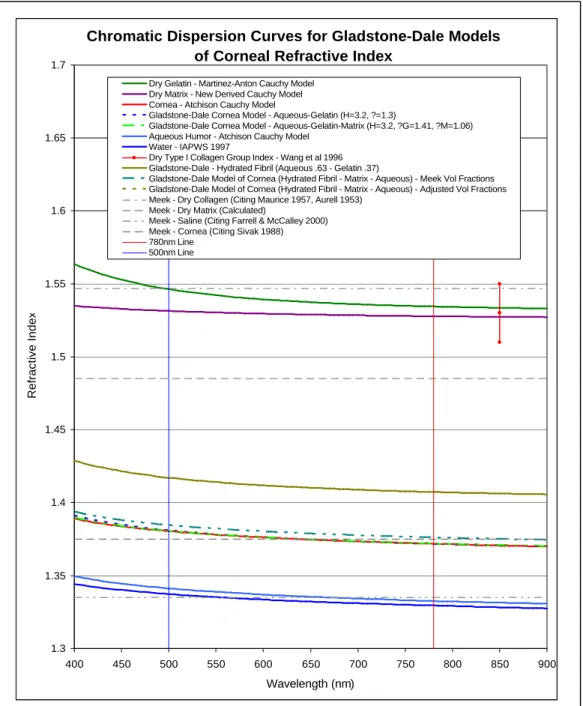
Applying the new wavelength-dependent model requires a guess at the effective wavelength from the original refractive index measurements. 17 – The model given by Meek, Dennis and Khan predicted values for refractive index lower than the indicated measurements. A new Gladstone-Dale model, which includes component indices (aqueous humor, dry gelatin and dry matrix) at 500nm, gives a line closer to the center of the measured data.
The actual effective wavelength of the Abbe refractometer used to measure these data is unknown. In the original Gladstone-Dale model for the stromal refractive index (Maurice, 1957), the solvent refractive index value. In summary, a new formulation of the Gladstone-Dale model for corneal refractive index as a function of hydration was developed.
Optical pachymeters must multiply the measured optical thickness by an assumed refractive index to give the geometric thickness of the cornea. The ratio between the Stokes and anti-Stokes spectra can also be used to measure the absolute temperature. However, the magnitude of the wavelength shift depends on both the excitation wavelength and the magnitude of the energy shift.
Spectral responsivity is the ratio of output current (A) to input optical power (W) at a given wavelength. The diffusion time for carriers generated outside the depletion layer can be The speed of electron emission is proportional to the intensity of the incident light (Donati, 2000).
The intrinsic response rate can be increased by increasing the size of the depletion volume. In this case, the intensity of the water band (OH) is measured relative to the intensity of the collagen band (CH).
System Noise Floor vs Measurement Time
This system has a dynamic range of 8 orders of magnitude, determined by the 7.2V battery power rails of the transimpedance amplifier. The synthetic chopper is a very simple modification of the traditional light chopper, but it is significant because it straightens. This is because the effective bandwidth of the phase-locked loop is greatly increased in the synthetic chopper method, reducing the aperture uncertainty to the inevitable aperture jitter of the ADC.
Depending on the physical origin, the spectral distribution of the measured power may exhibit a white or 1/f distribution, which is added to give a fundamental noise floor for a system. Crosstalk is a subset of interference, which refers to interference that originates within one part of the measurement system itself and feeds back into another part. Shot noise is a type of white noise that originates in signals carried by uncorrelated discrete (quantized) events.
The Schottky formula states that a constant current of I amps will show inoise fluctuations equal to the square root of twice the product of the current, the elementary charge q, and the observation bandwidth B. In a signal with full shock noise and a no. large number of quanta, the RMS magnitude of the fluctuation is equal to the square root of the average number of quanta observed in The Poisson distribution, published in 1838 as part of a mathematical analysis of the criminal justice system, describes the probability of occurrence of a given number of discrete events with a known mean rate of occurrence in a given time interval.
In most experiments, shot noise will set the absolute theoretical limit for the signal to noise ratio. Other important shot noise sources include the shot noise of the dark current in the photodiode, and the shot noise of the bias current in an amplifier. The measured SNR, compared to the SNR due to the photocurrent shot noise limit, is therefore a measure of the optimality of a photodetection system.
However, current through a barrier, such as a p-n junction, Schottky diode, or tunnel diode, will show full pulse noise. The theoretical explanation for Johnson noise, given by Nyquist, is a direct consequence of the equivalence theory of thermodynamics, which assigns a total energy per degree of freedom equal to Boltzmann's constant multiplied by the absolute. At low photocurrent values, it is very difficult to achieve the shot noise limit using photodiode detectors, as other noise sources, such as dark current shot noise or input bias current, begin to dominate.
RTBk
Ultimately, the important property for a lock-in system is not absolute stability, but rather the ability of the phase-locked loop to follow the phase and frequency of the signal. Interference is effectively removed by shielding sensitive parts of the system from the environment (Ott, 1988). However, crosstalk from another part of the system can, and will, connect coherently in the signal path.
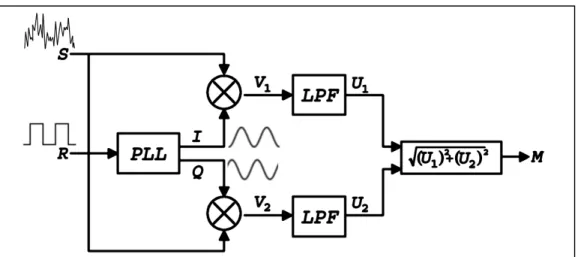
30 - A typical two-channel lock-in amplifier uses a signal S and an external reference R to derive the magnitude of a single Fourier component of the signal. These outputs provide the amplitude and phase of the signal, relative to the external reference. Lock-in amplifiers are usually classified by the implementation of mixing and low-pass filter stages.
The fourth rule given is to sample at more than twice the effective bandwidth of the signal and the noise. First, the fundamental frequency of the signal of interest should be placed at an integer of the frequency resolution. Deterministic errors are deviations from the desired modulation characteristic mainly due to the limited precision of the chopper manufacturing technology.
The signal waveform must be measured directly to account for deterministic non-uniformities in the helicopter, reference disk or beam intensity profile. The bandwidth and phase delay characteristics of the detector and amplifier must also be measured. Other areas of the matrix reflect the characteristics of broadband noise, such as the presence of white noise in the measurement bandwidth.
To perform optimal phase-sensitive detection, the waveform of the measured signal must be measured. After obtaining the signal waveform and removing coherent interference by subtraction, a noise correlation matrix must be calculated from a measurement of many cycles of the noise. Measurement of the refractive index of distilled water from the near-infrared region to the ultraviolet region.
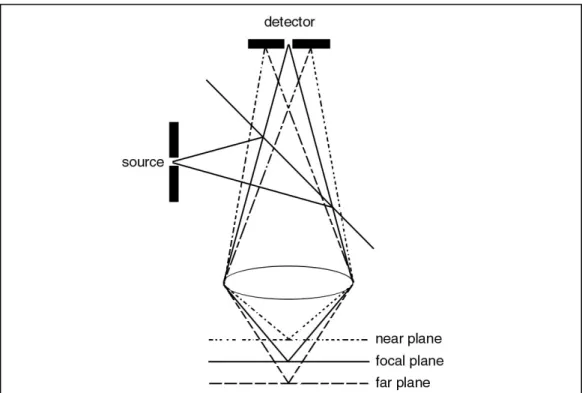
A simple optical apparatus for measuring the thickness of the cornea and the average thickness of the human cornea. Changes in the refractive index of the stroma and its extrafibrillar matrix when the cornea is swollen.