JEMA: Jurnal Ilmiah Bidang Akuntansi dan Manajemen is licensed under a Creative Commons Attribution 4.0 International License
60
Optimal Portfolio Construction: Application of Sharpe's Single-Index Model on Dhaka Stock Exchange
Imroz Mahmud *) ABSTRACT
This study aims to find whether Sharpe's single-index model of portfolio construction offers better investment alternatives to the investors of the Dhaka Stock Exchange (DSE). For this purpose, month-ended closing price data of 178 companies listed on the DSE, the prime bourse of Bangladesh, and the month-ended index value of DSEX have been used for the period starting from January 2013 to February 2018. The stocks selected for this study belong to 16 industrial sectors, and purposive sampling technique has been used to select these sectors. Sharpe's model formulates a unique cut-off rate and selects the stocks having an excess return-to-beta ratio above that rate. In this study, 54 stocks qualified to be a part of the optimal portfolio. Hence, the proportion of investment to be made on each of the stock is calculated according to the model. The study reveals that three industries occupy a hefty chunk (65.78%) of the proposed investment portfolio. The constructed portfolio offers a monthly return of 2.1489% and carries 1.9516% risk as measured by standard deviation. The beta of the optimal portfolio is only 0.124003. The constructed portfolio outperforms every individual stock as well as the market index in terms of offering the optimal risk- return combinations. Therefore, this five-and-a-half-decade-old model offers a great opportunity for Bangladeshi investors to optimize return and diversify risk in an efficient manner.
Keywords: Single-Index Model; Sharpe; Optimal Portfolio; Dhaka Stock Exchange 1. INTRODUCTION
1.1 Research Background
The ground-breaking article published by Markowitz in 1952 marked the beginning of modern portfolio theory. His model is concerned with creating an optimal portfolio of assets by risk-averse investors. According to Markowitz (1952), a risk-averse investor should choose efficient portfolios. An efficient portfolio is one that maximizes return for a given level of risk or minimizes risk for a given level of return. Markowitz's pioneering article, named Portfolio Selection, and his subsequent studies have been a source of inspiration for many researchers and scholars. His model was intended to be pragmatic and implementable. However, it is ironic that the volume of work required to construct an optimal portfolio was staggering, and thus the model was rarely used in practice (Elton, Gruber, & Padberg, 1976). To form a portfolio using Markowitz's model we will need N×(N-1)/2 correlation coefficients, where "N" stands for the number of stocks a firm or an investor follows (Elton, Gruber, Brown, & Goetzmann, 2009). Consequently, the implementation of the model is also quite time consuming and expensive. Recognition of these problems has motivated researchers to develop and simplify the portfolio construction process. In quest of a solution, William F. Sharpe came up with a simplified alternative to the Markowitz's model that significantly reduces the data input and computational requirements.
The model developed by Sharpe, known as Sharpe single-index model, is based on the assumption that co-movement between stocks' return is due to movement in return of a broad market index (Sharpe, 1963). Such a return on a broad market index is taken as a valid substitution for the common macroeconomic factor (Bodie, Kane, & Marcus, 2009). According to Sharpe's model, a single value, known as the cut-off rate, measures the desirability of including security in
JEMA: Jurnal Ilmiah Bidang Akuntansi dan Manajemen is licensed under a Creative Commons Attribution 4.0 International License
61
the optimal portfolio. The portfolio construction process is simplified if the cut-off rate can dictate which securities to include in our optimal portfolio, and which ones to exclude. This simplified model not only allows an investor to pick securities for his/her optimal portfolio but also helps determine how much to invest in each of those securities (Elton, Gruber, & Padberg, 1976). Hence, this five-and-a-half-decade-old model is still considered as one of the simplest and most widely used models for portfolio construction.
Dhaka Stock Exchange (DSE), formerly known as East Pakistan Stock Exchange Association Ltd. (1954-1962) and East Pakistan Stock Exchange Ltd. (1962-1964), began its journey long before the independence of Bangladesh with a paid-up capital of about BDT 4 billion (Dhaka Stock Exchange, 2017). The introduction of DSE has opened the door to many investors and businesses in fulfilling their investment and financing needs. However, DSE evolved slowly and could not properly fulfill these needs due to various political unrest, corruption, military coups and other massive anomalies (Rahaman, Hasan, & Ahsan, 2013). These evils have always haunted the capital market of Bangladesh that resulted in some turmoils in 1990, 1996, 2011 and 2012 for instance. As a result, investors’ trust and confidence in DSE have plummeted. Unless we make the necessary changes to this situation, the capital market can’t contribute in a desirable way to the economic growth of Bangladesh. These present a great challenge for the rational investors of Bangladesh in picking a good investment, which necessitates the adoption of a systematic approach in the investment decision. A sound and in-depth knowledge of portfolio analysis can help them to diversify the investment risk without unfavorably affecting the return.
The present study has been carried out with a view to evaluating how well the portfolio constructed using Sharpe's single-index model performs in the Bangladeshi capital market. Besides, the study aims to assist both domestic and foreign investors of DSE in simplifying the construction of an optimal portfolio of equity securities. Although there have been extensive studies on this regard in the developed economies, empirical work on simplifying the portfolio construction and evaluation of its performance is comparatively scarce in the developing economies. Specifically, in Bangladesh, there is a significant lacuna of research in this context. Besides, none of the studies carried out in the developing economies consisted of a wide-ranging collection of stocks representing various industrial sectors. As a result, these studies cannot completely reveal the portfolio optimization potential of Sharpe's model.
1.2 Research Problem
a) Does Sharpe’s model of portfolio construction offer better risk-return combination to the investors of DSE?
b) Does the portfolio construction model propounded by Sharpe simplify the investment decision for the investors of DSE?
1.3 Research Purpose
The primary objective of this study is to find whether Sharpe’s single-index model of portfolio construction offers better investment options to the investors of DSE.
2. THEORETICAL FRAMEWORK
Before Markowitz's monumental work on portfolio selection, investors concentrated on evaluating the risk and return characteristics of individual stocks in constructing their portfolios.
The rule of thumb was to pick a stock that offered the best opportunity of earning reward with the least amount of risk (Paudel & Koirala, 2007). Markowitz revolutionized the investment criteria by
JEMA: Jurnal Ilmiah Bidang Akuntansi dan Manajemen is licensed under a Creative Commons Attribution 4.0 International License
62
suggesting three statistics: mean, standard deviation, and correlation with other stocks for selecting the best portfolio at any given level of risk.
The theoretically sophisticated and conceptually comprehensive model of Markowitz has a severe drawback: the volume of work required to form a portfolio using this model is staggering and beyond the capacity of all but a few specialists. A lot of researchers tried to simplify the portfolio construction process and finally, William F. Sharpe came up with a solution in 1963 that is known as Sharpe's single-index model.
Skarica & Zrinka (2012) stated that the classical Markowitz’s model often been criticized because of useless and impractical as they are not structured to apply a mean-variance optimization approach. Elton, Gruber, & Padberg (1976, 1977, 1978) applied a variety of models, such as single- index, multi-index, and constant correlation models, to establish simple criteria for optimal portfolio selection. According to their findings, they have suggested using the single-index model for its simplicity and efficiency. The model was also recommended to apply to a large population of securities as it serves as a simplified alternative to the classical mean-variance approach of portfolio optimization (Haugen, 1993). Paudel & Koirala (2007) conducted a study on the application and comparison of Markowitz and Sharpe’s model and advised using either of the models for optimizing portfolio performance. However, the findings of Briec & Kerstens (2009) portrays a contrasting picture. They suggested using Markowitz’s model for long-term investments and argued that a single-index model is not suitable for investment portfolios having multi-period durations. To form efficient portfolios using the Markowitz model, clustering of high dimensional stock data was found to be more effectual (Nanda, Mahanty, & Tiwari, 2010). By clustering stocks, the problem of efficient frontier can be solved more efficiently, which results in enhanced diversification.
According to Frankfurter, Phillips, & Seagle (1976), the single-index model is just a simplified variation to the Markowitz's model, and it is based on the assumption that co-movement between stocks' return is due to movement in market return, or return of a broad market index to be specific. As per their study, both models produced identical results under conditions of certainty.
However, in conditions of uncertainty, the single-index model produced superior results than Markowitz's model. Nevertheless, when a short span of historical data is used, the single-index model performed worse than Markowitz's model. The findings of Omet (1995) is also consistent with the previous studies. He stated that both models yield similar outcomes, but emphasized using the single-index model, as it is more pragmatic in generating the efficient frontier.
Rani & Bahl (2012) used Sharpe’s model for portfolio construction with and without the procedure of short sales on 30 stocks selected from BSE (Bombay Stock Exchange). Both of their portfolios were efficient as they offered the best risk-return combinations possible. But the portfolio prohibiting short sales performed a tad bit better than the one allowing it. Sen & Fattawat (2014) also attempted to construct portfolios from 30 stocks, listed on BSE, using both Markowitz and Sharpe’s model. Their study revealed that Sharpe’s model outperformed its predecessor in risk reduction. In another study, Singh & Gautam (2014) and Ahuja (2017) formed an optimal portfolio of stocks selected from the banking sector of NSE (National Stock Exchange, Mumbai) and BSE (Bombay Stock Exchange). They also suggested Sharpe’s model for its simplicity and efficacy.
From the literature reviewed, we could easily conclude that most of the studies were conducted in the developed economies. Only a few studies were carried out in the developing ones.
Specifically, in Bangladesh, there exists a lacuna of research regarding this context. Besides, none of the studies conducted in developing economies were extensive.
JEMA: Jurnal Ilmiah Bidang Akuntansi dan Manajemen is licensed under a Creative Commons Attribution 4.0 International License
63 2.1 Sharpe’s Single-Index Model
William Sharpe (1963) simplified variant of the Markowitz Model, universally known as the Sharpe’s single-index model, assumes that the co-movement between stocks’ return is due to movement in return of a broad market index, which is DSEX in our case. Hence, the primary equation underlying the single-index model is:
𝑅𝑖 = 𝛼𝑖+ 𝛽𝑖𝑅𝑚+ 𝜀𝑖 (1)
Where, 𝑅𝑖= Expected return on security i, 𝛼𝑖 =Intercept of the straight line or alpha coefficient (Constant), 𝛽𝑖 = Slope of a straight line or beta coefficient, 𝑅𝑚 = The rate of return on market index, and 𝜀𝑖 = Error term.
Alpha co-efficient (𝛼𝑖) and error term (𝜀𝑖) are two components of a random variable denoted by 𝑎𝑖. Since the error term (𝜀𝑖) has an expected value of zero, therefore the mean return on security can be expressed as:
𝑅̅𝑖 = 𝛼𝑖+ 𝛽𝑖𝑅𝑚 (2)
To perform the portfolio optimization, the measurement of spread and co-movement of return statistics is also required. The mathematical equations required regarding this respect are:
𝜎𝑖2 = 𝛽𝑖2𝜎𝑚2 + 𝜎𝑒𝑖2 (3)
Where, 𝜎𝑖2 = Total variance of a security’s return, 𝛽𝑖2𝜎𝑚2 = Market-related variance, 𝜎𝑒𝑖2 = Variance of a stock's movement that is not associated with the movement of the market index, i.e.
the stock's unsystematic risk.
𝜎𝑖𝑗 = 𝛽𝑖𝛽𝑗𝜎𝑚2 (4)
Where, 𝜎𝑖𝑗 =The covariance of returns between securities i and j, 𝛽𝑖 = Beta of security i, 𝛽𝑗 = Beta of security j, and 𝜎𝑚2 = Variance of market return.
The monthly return of the selected securities is calculated using the following equation.
𝑅𝑖𝑡 = 𝑃𝑖𝑡
𝑃𝑖𝑡−1− 1 (5)
Where, Rit = Monthly return on stock i at time t, Pit = Monthly closing price of the stock i at time t, and Pit−1 = Monthly closing price of the stock i at time t-1.
In the same manner, the return characteristics of the benchmark market index (DSEX) is calculated using the following equation.
𝑅𝑚𝑡 = 𝐼𝑖𝑡
𝐼𝑖𝑡−1− 1 (6)
Where, Rmt = Monthly return on the market index at time t, Iit = Monthly closing market index value at time t, and Iit−1= Monthly closing market index value at time t-1.
The excess return yielded by risky security is calculated by subtracting the risk-free rate of return, which is 0.4784 percent per month (or 5.74 percent per annum) in our case, from the expected return of that risky security. The sensitivity of security's return to the movement in the market's return, popularly known as systematic risk or beta coefficient, is required for analyzing the risk of a security. The beta coefficient can be calculated as follows:
𝛽𝑖 =𝜎𝑖𝑚
𝜎𝑚2 (7)
JEMA: Jurnal Ilmiah Bidang Akuntansi dan Manajemen is licensed under a Creative Commons Attribution 4.0 International License
64
Where, 𝜎𝑖𝑚 = Covariance of the stock i return with the market return, and 𝜎𝑚2 = Variance of the market return.
Based on the equations depicted above, it is just a matter of a few steps to reach our optimal portfolio. Sharpe's single-index model greatly simplifies the portfolio construction process by taking a single number to quantify the desirability of a stock’s inclusion in the optimal portfolio. If one is ready to accept the standard form the single-index model as describing the co-movement between securities, such a number exists. In this instance, the desirability of any stock is directly related to the excess return to the Beta ratio (Elton, Gruber, Brown, & Goetzmann, 2009):
𝑅𝑖−𝑅𝑓
𝛽𝑖 (8)
Where, 𝑅𝑖 = Expected return on stock i, 𝑅𝑓 = Return on a riskless asset, and 𝛽𝑖 = Expected change in the rate of return on stock i associated with a 1% change in the market return. The excess return to Beta ratio measures the additional return on security for each unit of systematic risk or non-diversifiable risk. In a colloquial manner, this ratio expresses the relationship between the potential risk and reward.
Once we have the excess return to the Beta ratio for each of the stocks under consideration, the following step is to rank those stocks in descending order of their respective ratios. Since we are assuming that short selling is prohibited, any stock with a negative excess return to Beta ratio has been excluded from further analyses.
The stocks to be included in the optimal portfolio depend on an unprecedented cutoff rate such that all stocks with higher ratios of (𝑅𝑖− 𝑅𝑓)/𝛽𝑖 are included and all stocks with lower ratios are excluded. This cut-off point is indicated by C*, and is computed from the characteristics of all the stocks that belong to the optimal portfolio. To determine C*, it is required to estimate its value as if there were different numbers of stocks in the optimal portfolio. If we nominate 𝐶𝑖 as a candidate for C*. The value of 𝐶𝑖 is calculated when i securities are assumed to belong to the optimal portfolio. For a portfolio of i stocks, 𝐶𝑖 is given by:
𝐶𝑖 =
𝜎𝑚2 ∑ (𝑅𝑗−𝑅𝑓)𝛽𝑗 𝜎𝑒𝑗2 𝑖𝑗=1
1+𝜎𝑚2 ∑ 𝛽𝑗 2 𝜎𝑒𝑗2 𝑖𝑗=1
(9)
Where, 𝜎𝑚2 = The variance in the market index, and 𝜎𝑒𝑗2 = The variance of a stock’s movement that is not associated with the movement of the market index. This is commonly referred to as a stock’s unsystematic risk. After estimating the 𝐶𝑖 of all the stocks, the highest 𝐶𝑖 value is selected as the cut-off point (C*), which is then compared with the excess return to the Beta ratio of each stock. All stocks used in the calculation of 𝐶𝑖 have an excess return to Beta above 𝐶𝑖 and all stocks not used to calculate 𝐶𝑖 have an excess return to Beta below 𝐶𝑖. There will always be one and only one 𝐶𝑖 with this property and it is the cut-off point, C*.
After determining which stocks to be included in the optimal portfolio, the investors must find out the optimum percentage of capital to be invested in each of them. The percentage invested in each stock is:
𝑋𝑖 = 𝑍𝑖
∑𝑁𝑗=1𝑍𝑗 (10)
Where 𝑍𝑖 = 𝛽𝑖
𝜎𝑒𝑖2 (𝑅𝑖−𝑅𝑓
𝛽𝑖 − 𝐶∗) (11)
JEMA: Jurnal Ilmiah Bidang Akuntansi dan Manajemen is licensed under a Creative Commons Attribution 4.0 International License
65
The former expression indicates the weights on each stock, and they sum up to one. The latter expression determines the relative investment in each stock. The residual variance on each security 𝜎𝑒𝑖2 plays a vital role in determining the amount to be invested in each security.
After determining the weights on each security, beta and alpha on a portfolio are estimated to find out the portfolio risk and return. Beta on a portfolio, 𝛽𝑝, is a weighted average of the individual 𝛽𝑖 on each stock in the portfolio and is denoted by:
𝛽𝑝 = ∑𝑛𝑖=1𝑋𝑖𝛽𝑖 (12)
Similarly, the Alpha on the portfolio, 𝛼𝑝, is calculated as:
𝛼𝑝 = ∑𝑛𝑖=1𝑋𝑖𝛼𝑖 (13)
The return on the investor's portfolio can be expressed as:
𝑅𝑝 = 𝛼𝑝+ 𝛽𝑝𝑅𝑚 (14)
Finally the risk of the investor’s portfolio, 𝜎𝑝, as:
𝜎𝑝 = √(𝛽𝑝2𝜎𝑚2 + ∑𝑁𝑖=1𝑋𝑖2𝜎𝑒𝑖2) (15) All the equations (eq. 1-15) cited above are sourced from the book of Elton, Gruber, Brown, &
Goetzmann (2009).
3. RESEARCH METHOD 3.1 Research Design
In the pursuit of constructing an optimal portfolio of equity securities traded on DSE, monthly closing price and benchmark market index (DSEX) data have been used for the period starting from January 2013 to February 2018. The secondary data used in this study are collected from DSE Library.
3.2 Population and Sample
The study was initially aimed at all, 228 to be specific, the "A" category companies offering equity securities that belong to sixteen industrial sectors. The industries covered in this study are listed in Table 1. Purposive sampling technique has been applied to select these industrial sectors.
The companies which are regular at holding annual general meetings and have declared a dividend at the rate of ten percent or above in the last calendar year are classified as “A” category companies (Dhaka Stock Exchange, 2018). Due to the unavailability of data during the aboved study period, 50 companies have been excluded from the portfolio construction, which leads to a final sample size of 178 companies. The average monthly cutoff yield of 91-day Treasury Bill has been used as a proxy for the risk-free rate of return (Bangladesh Bank, n.d.).
The 178 sample companies selected following the above-mentioned criteria constitutes 61.59 percent of all the equity securities (289) from the sixteen industrial sectors (refer to Table 1). A number of statistical techniques have been applied to analyze the risk-return characteristics and to construct the optimal portfolio of equity securities using Microsoft Excel 2016. In addition to substantial data coverage, the study covers a period of five years and two months, which reduces the possibility of sampling error and the influence of temporary fluctuations to distort the study outcome. Hence, the sample size can be assumed as adequate to represent the population and make smart investment decisions.
JEMA: Jurnal Ilmiah Bidang Akuntansi dan Manajemen is licensed under a Creative Commons Attribution 4.0 International License
66 Table 1 Sector-wise Representation of Sample Stocks
Name of the Industry/Sector
Total Number of Companies
Number of Category-A Companies
Sample Companies
Data Coverage
(%)
Banks 30 29 29 96.67%
Financial Institutions 20 12 12 60.00%
Engineering 36 29 17 47.22%
Food & Allied 18 9 8 44.44%
Fuel & Power 19 16 13 68.42%
Jute 3 2 2 66.67%
Textile 49 35 18 36.73%
Pharmaceuticals & Chemicals 28 24 16 57.14%
Service & Real Estate 7 6 3 42.86%
Cement 7 6 5 71.43%
IT Sector 8 7 5 62.50%
Tannery Industries 6 5 4 66.67%
Ceramics Sector 5 3 3 60.00%
Insurance 47 42 41 87.23%
Telecommunication 2 2 1 50.00%
Travel & Leisure 4 1 1 25.00%
Total 289 228 178 61.59%
Source: Secondary Data Processed, 2018 3.3 Research Framework
Picture 1 Research Framework
4. RESEARCH RESULT AND ANALYSIS 4.1 Descriptive Analysis
Risk and return have always been the decisive factors in any investment model, and Sharpe's single-index model is of no exception. To apply this model, expected return and risk of each instrument are required. Thus, the month-ended closing price data of the 178 sample stocks as well as the month-ended index value of DSEX, for the period ranging from January 2013 to February 2018, have been used to estimate various risk and return characteristics. The mean monthly return and risk in terms of standard deviation, variance, covariance with market return, and the beta coefficient for each of the selected stocks have been calculated and depicted in Appendix-A.
The risk-return combinations offered by each of the 178 selected stocks have been portrayed in Picture-1. Analysis of the return data on the vertical axis reveals that most of the stocks yielded a monthly return from -0.27 percent to 1.3 percent. However, the average risk carried by the stocks is about 11.5 percent (Picture 1). Although Picture 1 paints an overall picture of the risk and returns
Dhaka Stock Exchange Sharpe’s Single-Index Model
Optimal Portfolio Investment
JEMA: Jurnal Ilmiah Bidang Akuntansi dan Manajemen is licensed under a Creative Commons Attribution 4.0 International License
67
composition offered by the stocks, we cannot pinpoint any precise information from it. An in-depth examination of the data in Appendix-A can be quite useful in this regard.
As revealed by Appendix A, the stock of Northern Jute Manufacturing Co. Ltd. yields the highest monthly return (8.227 percent) followed by Desh Garments Ltd. (5.439 percent) and Renwick Jajneswar & Co (Bd) Ltd. (4.892 percent). In terms of risk, the stock of Legacy Footwear Ltd. has the highest standard deviation (29.845 percent) followed by Grameenphone Ltd. (27.499 percent) and Northern Jute Manufacturing Co. Ltd. (26.969 percent). It is also found that 114 stocks offered a return below the market rate, which is 0.681 percent in our study, and surprisingly none of the stocks in this study had a beta value above the market.
Picture 2 Risk-Return Combination of Each Stock (Secondary Data Processed, 2018)
According to Sharpe’s single-index model, the expected return (𝑅̅𝑖) has two components: a unique or firm-specific part (𝛼𝑖) and a market-related part (𝛽𝑖𝑅𝑚). Likewise, a security’s variance (𝜎𝑖2) has the same two components: a unique risk (𝜎𝑒𝑖2) and a market-related risk (𝛽𝑖2𝜎𝑚2). The stocks having larger beta value also have a greater part of return that is dependent on the market’s performance. Breakdowns of risk & return will guide us to glean some idea about how much this model is going to benefit the investors in their quest for optimizing risk and return. Besides, these variables will be used in further calculations related to portfolio construction and performance evaluation. Hence, the decomposition of each firm's return and risk into unique and market-related parts are presented in Appendix-B.
By analyzing the decomposition of return, we can infer that the contribution of a stocks independent component is the dominant factor than its market-related component. Similarly, the breakdown of risk leads us to the identical conclusion: the contribution of a security’s unsystematic variance in its total variance is the dominant factor than its systematic variance. The result suggests that the stocks selected for this study offer a significant opportunity for reduction of unsystematic risk, which we will be able to verify when we construct the optimal portfolio and measure its performance.
Sharpe’s model provided a simple criterion, called the excess return-to-beta ratio, to quantify the desirability of a stock’s inclusion in the optimal portfolio. Therefore, the excess return-to-beta
-0,04 -0,02 0,00 0,02 0,04 0,06 0,08 0,10
0,00 0,05 0,10 0,15 0,20 0,25 0,30 0,35
Mean Return
Standard Deviation
JEMA: Jurnal Ilmiah Bidang Akuntansi dan Manajemen is licensed under a Creative Commons Attribution 4.0 International License
68
ratio for each stock has been calculated and the stocks are ranked in descending order according to their respective ratios (Appendix-C). The mean monthly cutoff yield of 91-day Treasury Bill, which is 0.4784 percent, has been used as a proxy for the risk-free rate of return. Of the 178 stocks studied, only 70 stocks have a positive excess return-to-beta ratio. Since short selling is assumed to be prohibited, the rest of the stocks have been excluded from further analysis.
Among the stocks studied, Renwick Jajneswar & Co (Bd) Ltd. secured the top spot with an excess return-to-beta ratio of 6.18333. Legacy Footwear Ltd. and Grameenphone Ltd. were in the second and third spot with the respective ratio of 4.21675 and 1.12589 (Appendix-C). Among the top scorers, only Renwick Jajneswar & Co (Bd) Ltd. secured the third position in terms of highest return generation. These outcomes suggest that the significantly lower beta value of Legacy Footwear Ltd. and Grameenphone Ltd. is the reason why these companies made their way to the top of the chart in terms of the excess return-to-beta ratio.
4.2 Validity and Reliability
This study only used secondary data from DSEX to defined the optimal investment portfolio proposed model, therefore, the validity and reliability test is not needed in this study.
4.3 Research Analysis
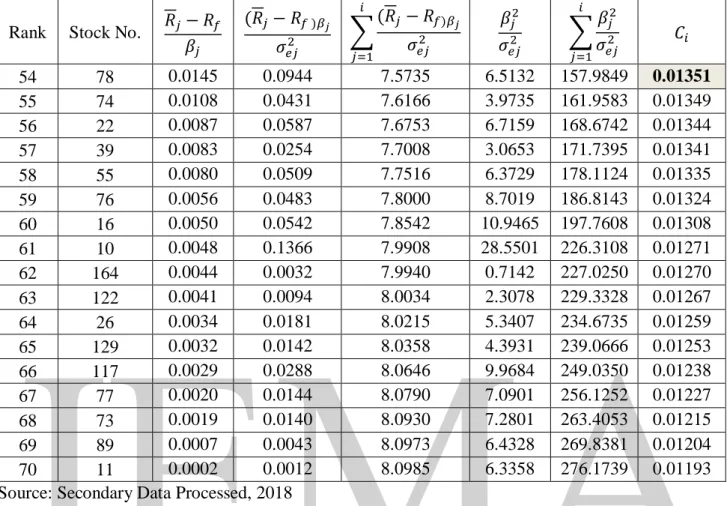
According to the single-index model, the selection of stock in the optimal portfolio depends on a unique cut-off rate (𝐶∗) and its comparison with the excess return-to-beta ratio of each stock studied. All stocks used for the estimation of 𝐶∗have an excess return-to-beta ratio above the cut-off rate and the stocks excluded from the estimation have an excess return-to-beta ratio below that rate.
The detailed calculation of the cut-off rate is portrayed in Table 2.
Table 2 Calculation of The Cut-Off Rate Rank Stock No. 𝑅𝑗− 𝑅𝑓
𝛽𝑗
(𝑅𝑗− 𝑅𝑓 )𝛽𝑗
𝜎𝑒𝑗2 ∑(𝑅𝑗− 𝑅𝑓)𝛽𝑗 𝜎𝑒𝑗2
𝑖
𝑗=1
𝛽𝑗2
𝜎𝑒𝑗2 ∑𝛽𝑗2 𝜎𝑒𝑗2
𝑖
𝑗=1
𝐶𝑖
1 49 6.1833 0.0073 0.0073 0.0012 0.0012 0.00002
2 134 4.2167 0.0039 0.0111 0.0009 0.0021 0.00003
3 130 1.1259 0.0148 0.0260 0.0132 0.0153 0.00006
4 107 1.0012 0.0135 0.0395 0.0135 0.0288 0.00010
5 109 0.8374 0.0276 0.0671 0.0329 0.0617 0.00017
6 135 0.6287 0.0516 0.1187 0.0821 0.1438 0.00029
7 82 0.5761 0.0203 0.1390 0.0353 0.1791 0.00035
8 106 0.4258 0.1135 0.2525 0.2666 0.4457 0.00063
9 44 0.3861 0.1156 0.3682 0.2995 0.7452 0.00091
10 61 0.3066 0.2533 0.6214 0.8262 1.5713 0.00154
11 100 0.2588 0.0416 0.6631 0.1609 1.7322 0.00164
12 114 0.2069 0.1415 0.8046 0.6838 2.4161 0.00199
13 50 0.2031 0.1291 0.9337 0.6356 3.0517 0.00230
14 84 0.1954 0.0619 0.9956 0.3169 3.3686 0.00245
15 108 0.1947 0.1225 1.1181 0.6291 3.9976 0.00275
16 81 0.1537 0.0786 1.1967 0.5114 4.5090 0.00294
JEMA: Jurnal Ilmiah Bidang Akuntansi dan Manajemen is licensed under a Creative Commons Attribution 4.0 International License
69 Rank Stock No. 𝑅𝑗− 𝑅𝑓
𝛽𝑗
(𝑅𝑗− 𝑅𝑓 )𝛽𝑗
𝜎𝑒𝑗2 ∑(𝑅𝑗− 𝑅𝑓)𝛽𝑗 𝜎𝑒𝑗2
𝑖
𝑗=1
𝛽𝑗2
𝜎𝑒𝑗2 ∑𝛽𝑗2 𝜎𝑒𝑗2
𝑖
𝑗=1
𝐶𝑖
17 60 0.1528 0.1357 1.3324 0.8883 5.3973 0.00327
18 128 0.1359 0.0945 1.4269 0.6959 6.0933 0.00349
19 59 0.1270 0.2025 1.6295 1.5950 7.6883 0.00397
20 102 0.1211 0.2675 1.8970 2.2082 9.8965 0.00460
21 125 0.1186 0.0325 1.9295 0.2738 10.1703 0.00468
22 103 0.1176 0.2264 2.1559 1.9256 12.0959 0.00520
23 90 0.1047 0.0410 2.1969 0.3919 12.4878 0.00529
24 113 0.1010 0.1387 2.3356 1.3734 13.8611 0.00561
25 104 0.0992 0.0801 2.4158 0.8079 14.6690 0.00579
26 105 0.0936 0.1938 2.6096 2.0704 16.7394 0.00622
27 64 0.0896 0.0943 2.7038 1.0528 17.7922 0.00643
28 48 0.0868 0.1199 2.8237 1.3806 19.1728 0.00670
29 87 0.0819 0.1334 2.9571 1.6285 20.8013 0.00699
30 25 0.0722 0.3478 3.3050 4.8185 25.6198 0.00772
31 123 0.0647 0.1242 3.4291 1.9183 27.5381 0.00797
32 36 0.0631 0.2517 3.6809 3.9896 31.5277 0.00848
33 67 0.0618 0.3244 4.0052 5.2473 36.7750 0.00912
34 54 0.0613 0.2144 4.2197 3.4989 40.2739 0.00953
35 52 0.0565 0.3183 4.5379 5.6297 45.9035 0.01012
36 43 0.0513 0.1049 4.6428 2.0452 47.9487 0.01031
37 131 0.0511 0.1841 4.8269 3.6000 51.5487 0.01063
38 118 0.0508 0.0415 4.8684 0.8164 52.3652 0.01070
39 132 0.0496 0.4443 5.3127 8.9565 61.3217 0.01145
40 28 0.0426 0.1613 5.4740 3.7847 65.1064 0.01171
41 133 0.0290 0.1108 5.5848 3.8159 68.9222 0.01185
42 116 0.0285 0.0541 5.6388 1.8946 70.8169 0.01191
43 101 0.0280 0.3158 5.9546 11.2757 82.0925 0.01229
44 68 0.0267 0.0759 6.0305 2.8452 84.9377 0.01237
45 120 0.0254 0.1475 6.1780 5.8076 90.7453 0.01253
46 18 0.0240 0.2192 6.3972 9.1414 99.8867 0.01273
47 2 0.0223 0.1510 6.5481 6.7828 106.6695 0.01286
48 110 0.0222 0.0598 6.6079 2.6927 109.3622 0.01291
49 111 0.0219 0.5929 7.2008 27.0920 136.4542 0.01336
50 121 0.0195 0.1831 7.3839 9.4061 145.8602 0.01347
51 119 0.0193 0.0034 7.3873 0.1762 146.0365 0.01347
52 46 0.0172 0.0635 7.4508 3.6943 149.7308 0.01349
53 91 0.0162 0.0283 7.4791 1.7408 151.4716 0.01350
JEMA: Jurnal Ilmiah Bidang Akuntansi dan Manajemen is licensed under a Creative Commons Attribution 4.0 International License
70 Rank Stock No. 𝑅𝑗− 𝑅𝑓
𝛽𝑗
(𝑅𝑗− 𝑅𝑓 )𝛽𝑗
𝜎𝑒𝑗2 ∑(𝑅𝑗− 𝑅𝑓)𝛽𝑗 𝜎𝑒𝑗2
𝑖
𝑗=1
𝛽𝑗2
𝜎𝑒𝑗2 ∑𝛽𝑗2 𝜎𝑒𝑗2
𝑖
𝑗=1
𝐶𝑖
54 78 0.0145 0.0944 7.5735 6.5132 157.9849 0.01351
55 74 0.0108 0.0431 7.6166 3.9735 161.9583 0.01349
56 22 0.0087 0.0587 7.6753 6.7159 168.6742 0.01344
57 39 0.0083 0.0254 7.7008 3.0653 171.7395 0.01341
58 55 0.0080 0.0509 7.7516 6.3729 178.1124 0.01335
59 76 0.0056 0.0483 7.8000 8.7019 186.8143 0.01324
60 16 0.0050 0.0542 7.8542 10.9465 197.7608 0.01308
61 10 0.0048 0.1366 7.9908 28.5501 226.3108 0.01271
62 164 0.0044 0.0032 7.9940 0.7142 227.0250 0.01270
63 122 0.0041 0.0094 8.0034 2.3078 229.3328 0.01267
64 26 0.0034 0.0181 8.0215 5.3407 234.6735 0.01259
65 129 0.0032 0.0142 8.0358 4.3931 239.0666 0.01253
66 117 0.0029 0.0288 8.0646 9.9684 249.0350 0.01238
67 77 0.0020 0.0144 8.0790 7.0901 256.1252 0.01227
68 73 0.0019 0.0140 8.0930 7.2801 263.4053 0.01215
69 89 0.0007 0.0043 8.0973 6.4328 269.8381 0.01204
70 11 0.0002 0.0012 8.0985 6.3358 276.1739 0.01193
Source: Secondary Data Processed, 2018
From Table 2, it is apparent that the highest 𝐶𝑖 value is 0.01351 for stock number 78, i.e. MJL Bangladesh Limited; hence, the cutoff rate (𝐶∗) is 0.01351. Sixteen stocks have an excess return-to- beta ratio below the 𝐶∗, therefore are excluded from the optimal portfolio. So according to Sharpe’s single-index model, the remaining fifty-four stocks, having an excess return-to-beta ratio above the 𝐶∗, qualify to be a part of the optimal portfolio.
4.4 Research Discussion
4.4.1 Constructing the Optimal Portfolio
Sharpe’s single-index model not only identifies the stocks to be included in the optimal portfolio but also recommends the proportion of fund to be invested in each of them. Thus, the investors can reduce the unsystematic risk and construct a highly diversified portfolio. The following chart (Table 3) depicts the proportion of investment to be made on the fifty-four stocks qualified for the optimal portfolio.
Table 3 Weight of Stocks in the Optimal Portfolio
Rank Stock No. Name 𝑍𝑖 Weight (𝑋𝑖)
1 49 Renwick Jajneswar & Co (Bd) Ltd. 1.01938 2.3242%
2 134 Legacy Footwear Ltd. 0.42581 0.9709%
3 130 Grameenphone Ltd. 0.46446 1.0590%
4 107 Kohinoor Chemicals Company (Bangladesh) Ltd. 1.04414 2.3806%
5 109 Libra Infusions Limited 1.03220 2.3534%
6 135 Monno Ceramic Industries Ltd. 1.03242 2.3539%
JEMA: Jurnal Ilmiah Bidang Akuntansi dan Manajemen is licensed under a Creative Commons Attribution 4.0 International License
71
Rank Stock No. Name 𝑍𝑖 Weight (𝑋𝑖)
7 82 Al-Haj Textile Mills Limited 0.62054 1.4148%
8 106 Pharma Aids Ltd. 2.19126 4.9961%
9 44 Eastern Cables Ltd. 1.60392 3.6570%
10 61 British American Tobacco Bangladesh Company Ltd. 3.57568 8.1526%
11 100 Ambee Pharma Ltd. 0.92550 2.1102%
12 114 Marico Bangladesh Ltd. 1.64882 3.7593%
13 50 National tubes Ltd. 0.94147 2.1466%
14 84 Rahim Textile Mills Ltd. 0.59819 1.3639%
15 108 The IBN SINA Pharmaceutical Industry Ltd. 1.21949 2.7805%
16 81 Sonali Aansh Industries Limited 0.88817 2.0250%
17 60 Apex Foods Limited 1.03144 2.3517%
18 128 Daffodil Computers Ltd. 0.86783 1.9787%
19 59 Olympic Industries Limited 1.33037 3.0332%
20 102 GlaxoSmithKline(GSK) Bangladesh Limited 1.74671 3.9825%
21 125 BDCOM Online Ltd. 0.35259 0.8039%
22 103 ACI Limited. 1.30947 2.9856%
23 90 Anlima Yarn Dyeing Ltd. 0.45627 1.0403%
24 113 ACI Formulations Ltd. 0.70168 1.5998%
25 104 Renata Ltd. 0.82110 1.8721%
26 105 Reckitt Benckiser (Bd.)Ltd. 1.18977 2.7127%
27 64 Agricultural Marketing Company Ltd. (Pran) 0.76257 1.7387%
28 48 Quasem Drycells Ltd. 0.61289 1.3974%
29 87 Apex Spinning & Knitting Mills Limited 0.79501 1.8126%
30 25 BRAC Bank Ltd. 1.31509 2.9984%
31 123 Lafarge Surma Cement Ltd. 0.55550 1.2665%
32 36 IPDC Finance Limited 0.87316 1.9908%
33 67 Linde Bangladesh Limited 1.23684 2.8200%
34 54 National Polymer Industries Ltd 0.90478 2.0629%
35 52 Rangpur Foundry Ltd. 1.30733 2.9807%
36 43 Bangladesh Lamps Limited 0.47902 1.0922%
37 131 Apex Tannery Limited 0.59892 1.3655%
38 118 Summit Alliance Port Limited 0.19958 0.4550%
39 132 Bata Shoe Company (Bangladesh) Limited 1.46201 3.3334%
40 28 Trust Bank Ltd. 0.47989 1.0942%
41 133 Apex Footwear Limited 0.28786 0.6563%
42 116 Samorita Hospital Ltd. 0.21311 0.4859%
43 101 Beximco Pharmaceuticals Ltd. 0.53449 1.2187%
44 68 Padma Oil Co.Ltd. 0.18160 0.4141%
45 120 Heidelberg Cement Bangladesh Ltd. 0.30133 0.6870%
46 18 Mutual Trust Bank Ltd. 0.35594 0.8116%
47 2 The City Bank Ltd. 0.20815 0.4746%
48 110 Orion Infusion Ltd. 0.13563 0.3092%
49 111 Square Pharmaceuticals Ltd. 0.72062 1.6430%
50 121 Confidence Cement Ltd. 0.17536 0.3998%
JEMA: Jurnal Ilmiah Bidang Akuntansi dan Manajemen is licensed under a Creative Commons Attribution 4.0 International License
72
Rank Stock No. Name 𝑍𝑖 Weight (𝑋𝑖)
51 119 Unique Hotel & Resorts Limited 0.01107 0.0252%
52 46 Singer Bangladesh Ltd. 0.05939 0.1354%
53 91 H.R. Textile Ltd. 0.02716 0.0619%
54 78 MJL Bangladesh Limited 0.02648 0.0604%
∑ 𝑍𝑖 = 43.85946 100.00%
Source: Secondary Data Processed, 2018
As shown in Table 3, the largest chunk of investment (8.1526%) should be made in British American Tobacco Bangladesh Company Ltd., followed by Pharma Aids Ltd. and GlaxoSmithKline (GSK) Bangladesh Limited with an investment proportion of 4.9961% and 3.9825%, respectively. A sector-wise study on the fifty-four stocks in our optimal portfolio, shown in Picture 2, reveals that most of them belong to three industries: Pharmaceuticals & Chemicals, Engineering, and Food & Allied. These three industrial sectors account for 65.78 percent of the total investment to be made in the optimal portfolio, while the rest of the twelve sectors represent only 34.22 percent of the total investment.
Picture 3 Sector-Wise Proportion of Investment (Secondary Data Processed, 2018)
From the above pie chart (Picture 2), it is evident that Pharmaceuticals & Chemicals sector occupies the highest proportion of fund to be invested in the optimal portfolio, followed by Engineering and Food & Allied industry. Among the sixteen industrial sectors selected for this study, all but Insurance sector have at least one representative stock in the final portfolio. Hence, the final portfolio has stocks from fifteen industrial sectors that react differently to the changes in economic forces.
Banks, 5,38%
Financial Institutions, 1,99%
Engineering, 15,80%
Fuel & Power, 3,29%
Jute, 2,03%
Textile, 5,69%
Pharmaceuticals &
Chemicals, 34,70%
Service
& Real Estate, 0,94%
Cement, 2,35%
IT Sector, 2,78%
Tannery Industries, 6,33%
Ceramics
Sector, 2,35% Travel & Leisure,
0,03%
JEMA: Jurnal Ilmiah Bidang Akuntansi dan Manajemen is licensed under a Creative Commons Attribution 4.0 International License
73 4.4.2 Performance of Optimal Portfolio
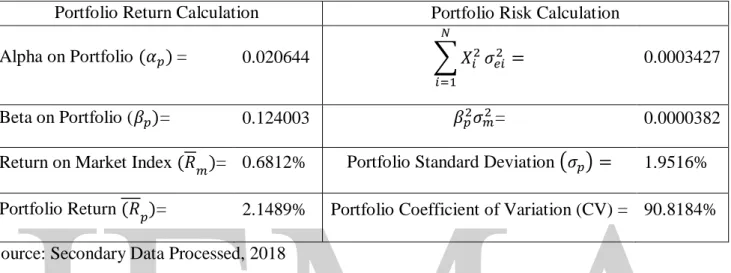
Once we have decided about the stocks along with their respective weights in the optimal portfolio, the final task is to evaluate its overall performance. Therefore, the performance of the constructed portfolio in terms of risk and return is calculated, and the key results are summarized in Table 4. For detailed calculations, refer to Appendix-D.
Table 4 Evaluation of Portfolio Performance
Portfolio Return Calculation Portfolio Risk Calculation Alpha on Portfolio (𝛼𝑝) = 0.020644 ∑ 𝑋𝑖2
𝑁
𝑖=1
𝜎𝑒𝑖2 = 0.0003427
Beta on Portfolio (𝛽𝑝)= 0.124003 𝛽𝑝2𝜎𝑚2= 0.0000382
Return on Market Index (𝑅𝑚)= 0.6812% Portfolio Standard Deviation (𝜎𝑝) = 1.9516%
Portfolio Return (𝑅𝑝)= 2.1489% Portfolio Coefficient of Variation (CV) = 90.8184%
Source: Secondary Data Processed, 2018
As apparent from the above table (Table 4), the constructed portfolio offers a generous monthly return of 2.1489 percent. However, the portfolio risk, measured by the standard deviation, is only 1.9516 percent. The portfolio has a CV of 90.8184 percent, a rate that is considerably lower than any individual stock in the optimal portfolio. The portfolio beta, expressing the systematic risk, also leads us to the identical conclusion. A comparison of the portfolio beta with that of the market indicates a substantial absence of systematic risk in the constructed one. The results of this study conform to the earlier researches conducted on portfolio optimization. Since the portfolio formed using Sharpe’s single-index model offers the best risk-return combinations possible in the given context, the portfolio can be termed as the optimal portfolio and the stocks consisting this portfolio as the efficient stocks.
5. RESEARCH CONCLUSION AND LIMITATION 5.1 Conclusion
In addition to simplifying the portfolio construction process, Sharpe’s single-index model reduces the number of inputs required to form the optimal portfolio. If we were to form a portfolio using the same number of stocks, Markowitz’s model would require 16,109 inputs. Whereas, Sharpe’s model required only 536 inputs, which is about 2,905 percent less than that of its predecessor. The findings of the study reveal a huge possibility of risk reduction through diversification while achieving a substantial return for Bangladeshi investors. The constructed portfolio outperforms every individual stock as well as the market index in terms of offering the optimal risk-return combinations. Therefore, this five-and-a-half-decade-old model offers a great opportunity for Bangladeshi investors to optimize return and diversify risk in an efficient manner.
Nevertheless, investors should not slack off at this point. They need to evaluate the performance of each stock and make necessary amendments in the optimal portfolio at regular intervals. Otherwise, the risk may go up and return may go down, evaporating the benefits of portfolio optimization.
JEMA: Jurnal Ilmiah Bidang Akuntansi dan Manajemen is licensed under a Creative Commons Attribution 4.0 International License
74 5.2 Limitation
This study certainly has some limitations. The stocks selected for this study belong to only
“A” category companies traded on DSE. Future studies may consider the stocks from other categories and from Chittagong Stock Exchange (CSE), the second bourse of Bangladesh. In addition, the study has excluded fifty “A” category stocks for lack of data. Although the monthly closing price data of five years and two months was adequate to form an optimal portfolio, daily closing price data and longer time horizon may result in better optimization of risk & return. As the study focused on simplifying the Markowitz’s model of portfolio optimization using Sharpe’s model, a side-by-side comparison of portfolios formed using both techniques can enhance or diminish the credibility of our hypothesis. Lastly, allowing short sales may change the nature of the optimal solution, as stocks having opposite characteristics will be a part of the optimal portfolio.
REFERENCES
Ahuja, R. (2017). Sharpe Single Index Model: Evidence From Bombay Stock Exchange (BSE) in India. Research Bulletin, 43(1).
Bodie, Z., Kane, A., & Marcus, A. J. (2009). Investments, Eight Edition. International Edition. New York: McGraw-Hill/Irwin.
Briec, W., & Kerstens, K. (2009). Multi-Horizon Markowitz Portfolio Performance Appraisals: A General Approach. Omega, 37(1): 50-62. https://hal.archives-ouvertes.fr/hal-00288174.
Dhaka Stock Exchange. (2017). Annual Report 2016-17. Dhaka: Dhaka Stock Exchange Ltd.
Retrieved from http://www.dsebd.org/download/Annual_Report.zip
Dhaka Stock Exchange. (2018). DSE Clearing and Settlement System. Retrieved from www.dsebd.org/settle.php.
Elton, E. J., Gruber, M. J., & Padberg, M. W. (1976). Simple Criteria For Optimal Portfolio Selection. The Journal of Finance, 31(5), 1341-1357. https://doi.org/10.1111/j.1540- 6261.1976.tb03217.x.
Elton, E. J., Gruber, M. J., & Padberg, M. W. (1977). Simple Rules For Optimal Portfolio Selection: The Multi Group Case. Journal of Financial and Quantitative Analysis, 12(3), 329-345. https://doi.org/10.2307/2330538.
Elton, E. J., Gruber, M. J., & Padberg, M. W. (1978). Simple Criteria For Optimal Portfolio Selection: Tracing Out The Efficient Frontier. The Journal of Finance, 33(1), 296-302.
https://doi.org/10.2307/2326368.
Elton, E. J., Gruber, M. J., Brown, S. J., & Goetzmann, W. N. (2009). Modern Portfolio Theory And Investment Analysis. New York: Wiley.
Frankfurter, G. M., Phillips, H. E., & Seagle, J. P. (1976). Performance Of The Sharpe Portfolio Selection Model: A Comparison. Journal of Financial and Quantitative Analysis, 11(2), 195- 204. https://doi.org/10.2307/2979049.
Haugen, R. (1993). Modern Investment Theory, Third Edition. New Jersey: Prentice-Hall.
Markowitz, H. (1952). Portfolio Selection. The journal of finance, 7(1), 77-91.
https://doi.org/10.1111/j.1540-6261.1952.tb01525.x.
JEMA: Jurnal Ilmiah Bidang Akuntansi dan Manajemen is licensed under a Creative Commons Attribution 4.0 International License
75
Nanda, S. R., Mahanty, B., & Tiwari, M. K. (2010). Clustering Indian Stock Market Data For Portfolio Management. Expert Systems with Applications, 37(12), 8793-8798.
https://doi.org/10.1016/j.eswa.2010.06.026.
Omet, G. (1995). On The Performance Of Alternative Portfolio Selection Models. Dirasat (The Humanities), 22(3), 125-135.
Paudel, R. B., & Koirala, S. (2007). Application of Markowitz and Sharpe Models in Nepalese Stock. Journal of Nepalese Business Studies, 3(1), 18-35.
Rahaman, M. A., Hasan, M. B., & Ahsan, A. M. (2013). Stock Market Performance Under Different Government Periods: Evidence from Bangladesh. Universal Journal of Accounting and Finance, 1(2), 42-50. https://doi.org/10.13189/ujaf.2013.010202.
Rani, M., & Bahl, S. (2012). Optimal Portfolio Selection With Or Without The Procedure Of Short Sales. Asian Journal of Research in Business Economics and Management, 2(7), 220-234.
Sen, K., & Fattawat, C. D. (2014). Sharpe’s Single Index Model and its Application Portfolio Construction: An Empirical Study. Global Journal of Finance and Management, 6(6), 511- 516.
Sharpe, W. F. (1963). A Simplified Model For Portfolio Analysis. Management Science, 9(2), 277- 293. https://dx.doi.org/10.1287/mnsc.9.2.277.
Singh, S., & Gautam, J. (2014). The Single Index Model & The Construction Of Optimal Portfolio:
A Case Of Banks Listed On NSE India. Risk governance & control: financial markets &
institutions, 4(2), 110-115. https://doi.org/10.22495/rgcv4i2c1art3.
Skarica, B., & Zrinka, L. (2012). A Comparison of Basic and Extended Markowitz Model on Croatian Capital Market. Croatian Operational Research (CRORR), 3(1), 236-244. Retrieved from https://hrcak.srce.hr/96823.
*) Imroz Mahmud, Department of Business Administration, University of Asia Pacific, Dhaka, Bangladesh (Email: [email protected])
JEMA: Jurnal Ilmiah Bidang Akuntansi dan Manajemen is licensed under a Creative Commons Attribution 4.0 International License
76 Appendix-A:
Risk and return characteristics of 178 sample stocks and the benchmark market index (DSEX) with Code A as Stock Number Code E as Standard Deviation
Code B as Name Code F as Covariance
Code C as Mean Return Code G as Beta Code D as Variance
A B C D E F G
1 AB Bank Limited -0.00260 0.01528 0.12360 0.00339 0.22182
2 The City Bank Ltd. 0.01113 0.01217 0.11032 0.00347 0.28493
3 IFIC Bank Ltd. -0.00070 0.02645 0.16264 0.00326 0.12338
4 Islami Bank Bd Ltd 0.00209 0.01626 0.12751 0.00250 0.15359
5 National Bank Ltd. -0.00479 0.01138 0.10666 0.00262 0.23006
6 Pubali Bank Ltd. -0.00084 0.00694 0.08332 0.00188 0.27022
7 Rupali Bank Ltd. 0.00042 0.01736 0.13175 0.00322 0.18556
8 United Commercial Bank Ltd. 0.00287 0.01029 0.10145 0.00288 0.28005
9 Uttara Bank Ltd. 0.00001 0.00809 0.08996 0.00265 0.32736
10 Eastern Bank Ltd. 0.00650 0.00485 0.06963 0.00174 0.35953
11 Al-Arafah Islami Bank Ltd. 0.00484 0.01143 0.10692 0.00305 0.26704
12 Prime Bank Ltd. -0.00472 0.00863 0.09288 0.00168 0.19448
13 Southeast Bank Ltd. 0.00426 0.00812 0.09009 0.00259 0.31930
14 Dhaka Bank Ltd. -0.00096 0.01042 0.10209 0.00341 0.32680
15 National Credit and Commerce Bank Ltd. 0.00091 0.00520 0.07214 0.00208 0.39944 16 Social Islami Bank Ltd. 0.00599 0.00553 0.07434 0.00134 0.24267 17 Dutch-Bangla Bank Ltd. 0.00311 0.00657 0.08106 0.00215 0.32799 18 Mutual Trust Bank Ltd. 0.01123 0.00808 0.08991 0.00217 0.26881
19 Standard Bank Ltd. -0.00235 0.00887 0.09419 0.00288 0.32447
20 One Bank Limited 0.00212 0.00805 0.08971 0.00296 0.36771
21 Bank Asia Ltd. 0.00429 0.00826 0.09086 0.00196 0.23776
22 Mercantile Bank Ltd. 0.00689 0.00882 0.09391 0.00213 0.24136 23 Export Import (Exim) Bank of Bangladesh Ltd. -0.00260 0.00646 0.08035 0.00203 0.31399
24 Jamuna Bank Ltd. 0.00131 0.00565 0.07516 0.00160 0.28406
25 BRAC Bank Ltd. 0.02030 0.00971 0.09852 0.00209 0.21499
26 Shahjalal Islami Bank Ltd. 0.00553 0.00910 0.09539 0.00199 0.21899
27 Premier Bank Ltd. 0.00008 0.00854 0.09241 0.00235 0.27575
28 Trust Bank Ltd. 0.01457 0.01406 0.11857 0.00323 0.22960
29 First Security Islami Bank Ltd. -0.00085 0.00919 0.09588 0.00268 0.29198 30 IDLC Finance Limited 0.00461 0.01739 0.13186 0.00480 0.27608 31 United Finance Limited -0.00221 0.01157 0.10756 0.00361 0.31180 32 Uttara Finance and Investments Limited. -0.00008 0.00815 0.09029 0.00328 0.40203 33 Premier Leasing & Finance Limited. 0.00417 0.01478 0.12157 0.00337 0.22791 34 Islamic Finance & Investment Ltd. 0.00183 0.01323 0.11500 0.00361 0.27282 35 LankaBangla Finance Ltd. 0.00469 0.02970 0.17233 0.00560 0.18862
JEMA: Jurnal Ilmiah Bidang Akuntansi dan Manajemen is licensed under a Creative Commons Attribution 4.0 International License
77
A B C D E F G
36 IPDC Finance Limited 0.01908 0.01299 0.11399 0.00294 0.22657
37 Union Capital Ltd. 0.00067 0.02101 0.14493 0.00406 0.19313
38 Bangladesh Finance and Investment Co. Ltd. 0.00371 0.02006 0.14165 0.00466 0.23210 39 Phoenix Finance and Investments Ltd. 0.00683 0.02006 0.14162 0.00495 0.24701 40 Bay Leasing & Investment Ltd. 0.00281 0.01693 0.13011 0.00360 0.21247 41 GSP Finance Company (Bangladesh) Limited 0.00478 0.02556 0.15987 0.00384 0.15041 42 Aftab Automobiles Limited 0.00066 0.01322 0.11499 0.00374 0.28280 43 Bangladesh Lamps Limited 0.01305 0.01277 0.11302 0.00206 0.16122
44 Eastern Cables Ltd. 0.03165 0.01617 0.12718 0.00113 0.06957
45 Monno Jute Stafflers Ltd. 0.03474 0.01998 0.14137 -0.00091 -0.04531 46 Singer Bangladesh Ltd. 0.00873 0.01435 0.11977 0.00329 0.22916 47 Atlas Bangladesh Ltd. 0.00279 0.01168 0.10808 0.00238 0.20380 48 Quasem Drycells Ltd. 0.01912 0.01982 0.14077 0.00327 0.16512 49 Renwick Jajneswar & Co (Bd) Ltd. 0.04892 0.04320 0.20785 0.00031 0.00714
50 National tubes Ltd. 0.03079 0.02582 0.16070 0.00331 0.12802
51 Anwar Galvanizing Ltd. 0.03342 0.02169 0.14729 -0.00049 -0.02251
52 Rangpur Foundry Ltd. 0.01526 0.00618 0.07862 0.00115 0.18526
53 S. Alam Cold Rolled Steels Ltd. -0.00368 0.00830 0.09110 0.00276 0.33294 54 National Polymer Industries Ltd 0.01611 0.00984 0.09920 0.00182 0.18475
55 BSRM Steels Limited 0.00718 0.01438 0.11994 0.00432 0.30040
56 Navana CNG Limited 0.00088 0.01116 0.10566 0.00378 0.33858
57 Deshbandhu Polymer Limited 0.00194 0.01373 0.11719 0.00221 0.16092
58 GPH Ispat Ltd. 0.00326 0.01568 0.12520 0.00425 0.27131
59 Olympic Industries Limited 0.02206 0.01165 0.10793 0.00158 0.13604
60 Apex Foods Limited 0.02311 0.01623 0.12740 0.00195 0.11994
61 British American Tobacco Bangladesh Company Ltd. 0.02554 0.00556 0.07457 0.00038 0.06771 62 Gemini Sea Food Ltd. 0.03379 0.04662 0.21592 -0.00223 -0.04778 63 National Tea Company Limited -0.00264 0.00489 0.06994 0.00031 0.06378 64 Agricultural Marketing Company Ltd. (Pran) 0.01419 0.01050 0.10245 0.00110 0.10499
65 Fu Wang Food Ltd. 0.00218 0.01547 0.12438 0.00316 0.20425
66 Rangpur Dairy & Food Products Limited -0.00021 0.01674 0.12937 0.00325 0.19446 67 Linde Bangladesh Limited 0.01745 0.00811 0.09004 0.00166 0.20492
68 Padma Oil Co.Ltd. 0.01029 0.01505 0.12269 0.00310 0.20622
69 Eastern Lubricants Ltd. 0.04159 0.05485 0.23421 -0.00094 -0.01710
70 Summit Power Ltd. -0.00089 0.01099 0.10482 0.00401 0.36483
71 Dhaka Electric Supply Company Ltd. -0.00548 0.00734 0.08568 0.00206 0.28067 72 Power Grid Company of Bangladesh Ltd. 0.00283 0.00827 0.09094 0.00220 0.26586
73 Jamuna Oil Com. Ltd. 0.00520 0.00647 0.08042 0.00139 0.21505
74 Meghna Petroleum Ltd. 0.00688 0.00945 0.09721 0.00182 0.19282 75 Titas Gas Trans. & Dist. Co. Ltd. -0.00547 0.00374 0.06117 0.00154 0.41024 76 Khulna Power Company Ltd. 0.00630 0.00871 0.09334 0.00237 0.27241
77 Baraka Power Limited 0.00537 0.01206 0.10981 0.00349 0.28984
78 MJL Bangladesh Limited 0.00831 0.00921 0.09598 0.00224 0.24299
79 GBB Power Limited -0.00711 0.00969 0.09845 0.00354 0.36546
JEMA: Jurnal Ilmiah Bidang Akuntansi dan Manajemen is licensed under a Creative Commons Attribution 4.0 International License
78
A B C D E F G
80 Northern Jute Manufacturing Co. Ltd. 0.08227 0.07274 0.26969 -0.00044 -0.00611 81 Sonali Aansh Industries Limited 0.01719 0.01276 0.11296 0.00103 0.08073 82 Al-Haj Textile Mills Limited 0.02320 0.02898 0.17023 0.00093 0.03196
83 Stylecraft Limited 0.02568 0.03174 0.17815 -0.00033 -0.01040
84 Rahim Textile Mills Ltd. 0.02361 0.02932 0.17122 0.00282 0.09635 85 Saiham Textile Mills Ltd. -0.00421 0.00634 0.07964 0.00218 0.34376 86 Desh Garments Ltd. 0.05439 0.05976 0.24447 -0.00093 -0.01552 87 Apex Spinning & Knitting Mills Limited 0.01626 0.01211 0.11003 0.00170 0.14013 88 Delta Spinners Ltd. -0.01595 0.01623 0.12739 0.00230 0.14202 89 Prime Textile Spinning Mills Ltd. 0.00495 0.00908 0.09530 0.00218 0.23979 90 Anlima Yarn Dyeing Ltd. 0.01299 0.01568 0.12523 0.00123 0.07836
91 H.R. Textile Ltd. 0.00762 0.01759 0.13263 0.00307 0.17462
92 Alif Manufacturing Company Ltd. -0.00579 0.02221 0.14902 0.00299 0.13463 93 Square Textiles Limited -0.00935 0.00297 0.05449 0.00106 0.35771 94 R.N. Spinning Mills Ltd. -0.00971 0.01274 0.11287 0.00128 0.10019 95 Malek Spinning Mills Ltd. 0.00250 0.00885 0.09409 0.00184 0.20731 96 Zahintex Industries Limited -0.00638 0.01283 0.11327 0.00170 0.13270 97 Saiham Cotton Mills Limited -0.00905 0.00538 0.07334 0.00163 0.30217 98 Generation Next Fashions Limited -0.01481 0.01303 0.11415 0.00250 0.19177 99 Envoy Textiles Limited -0.00498 0.00458 0.06767 0.00098 0.21435
100 Ambee Pharma Ltd. 0.01582 0.01131 0.10635 0.00048 0.04265
101 Beximco Pharmaceuticals Ltd. 0.01334 0.00852 0.09230 0.00260 0.30569 102 GlaxoSmithKline(GSK) Bangladesh Limited 0.02127 0.00843 0.09181 0.00115 0.13605
103 ACI Limited. 0.02278 0.01222 0.11054 0.00187 0.15302
104 Renata Ltd. 0.01314 0.00881 0.09385 0.00074 0.08427
105 Reckitt Benckiser (Bd.)Ltd. 0.01783 0.00943 0.09711 0.00131 0.13937
106 Pharma Aids Ltd. 0.02614 0.00944 0.09717 0.00047 0.05015
107 Kohinoor Chemicals Company (Bangladesh) Ltd. 0.01758 0.01209 0.10994 0.00015 0.01278 108 The IBN SINA Pharmaceutical Industry Ltd. 0.02298 0.01390 0.11791 0.00130 0.09345 109 Libra Infusions Limited 0.02678 0.02097 0.14481 0.00055 0.02627 110 Orion Infusion Ltd. 0.00861 0.01110 0.10535 0.00191 0.17229 111 Square Pharmaceuticals Ltd. 0.01167 0.00390 0.06247 0.00123 0.31474 112 Keya Cosmetics Ltd. -0.01192 0.01373 0.11718 0.00288 0.20939 113 ACI Formulations Ltd. 0.02209 0.02144 0.14641 0.00367 0.17129 114 Marico Bangladesh Ltd. 0.02138 0.00943 0.09709 0.00076 0.08022 115 Active Fine Chemicals Ltd. -0.00861 0.00926 0.09624 0.00240 0.25872 116 Samorita Hospital Ltd. 0.00859 0.00945 0.09722 0.00126 0.13350 117 Eastern Housing Limited 0.00561 0.00847 0.09202 0.00243 0.28701 118 Summit Alliance Port Limited 0.01253 0.02854 0.16893 0.00435 0.15249 119 Unique Hotel & Resorts Limited 0.00657 0.04854 0.22033 0.00449 0.09248 120 Heidelberg Cement Bangladesh Ltd. 0.01060 0.00916 0.09571 0.00210 0.22901 121 Confidence Cement Ltd. 0.01100 0.01109 0.10533 0.00354 0.31933 122 Meghna Cement Mills Ltd 0.00562 0.01827 0.13515 0.00374 0.20473 123 Lafarge Surma Cement Ltd. 0.01623 0.01639 0.12801 0.00290 0.17688
JEMA: Jurnal Ilmiah Bidang Akuntansi dan Manajemen is licensed under a Creative Commons Attribution 4.0 International License
79
A B C D E F G
124 M.I. Cement Factory Limited 0.00162 0.00526 0.07252 0.00198 0.37557
125 BDCOM Online Ltd. 0.01447 0.02435 0.15606 0.00199 0.08163
126 Intech Limited 0.00470 0.01326 0.11514 0.00288 0.21731
127 Agni Systems Ltd. 0.00136 0.00948 0.09736 0.00324 0.34223
128 Daffodil Computers Ltd. 0.01811 0.01386 0.11771 0.00136 0.09811 129 aamra technologies limited 0.00559 0.01429 0.11955 0.00356 0.24921
130 Grameenphone Ltd. 0.04033 0.07562 0.27499 0.00239 0.03157
131 Apex Tannery Limited 0.01635 0.01434 0.11976 0.00324 0.22622 132 Bata Shoe Company (Bangladesh) Limited 0.01575 0.00558 0.07470 0.00123 0.22110 133 Apex Footwear Limited 0.01076 0.01119 0.10579 0.00230 0.20568 134 Legacy Footwear Ltd. 0.04283 0.08907 0.29845 0.00080 0.00902 135 Monno Ceramic Industries Ltd. 0.03555 0.02916 0.17078 0.00143 0.04893 136 Fu-Wang Ceramic Industries Ltd. 0.00094 0.01036 0.10179 0.00260 0.25127 137 RAK Ceramics (BD) Ltd. 0.00204 0.01278 0.11303 0.00364 0.28468 138 Bangladesh General Insurance Company Ltd. -0.00183 0.01372 0.11712 0.00375 0.27374 139 Green Delta Insurance Company Ltd. 0.00062 0.00888 0.09422 0.00200 0.22480 140 United Insurance Company Ltd. -0.00136 0.01537 0.12399 0.00408 0.26563 141 Peoples Insurance Company Ltd. -0.00215 0.00622 0.07889 0.00222 0.35636 142 Eastern Insurance Co. Ltd. -0.00274 0.00632 0.07948 0.00251 0.39755 143 Phoenix Insurance Company Ltd. -0.00962 0.01097 0.10474 0.00263 0.23969 144 Eastland Insurance Company Limited -0.01261 0.00995 0.09975 0.00310 0.31146 145 Central Insurance Company Limited -0.00573 0.00663 0.08143 0.00139 0.20969 146 Karnaphuli Insurance Co. Ltd. -0.00853 0.00577 0.07593 0.00191 0.33039 147 Rupali Insurance Company Ltd. -0.01092 0.01173 0.10832 0.00342 0.29158 148 National Life Insurance Co Ltd -0.00689 0.00952 0.09757 0.00178 0.18738 149 Reliance Insurance Ltd. -0.00418 0.00596 0.07720 0.00198 0.33274 150 Purabi Gen. Insurance Company Ltd. -0.01711 0.01308 0.11436 0.00300 0.22962 151 Delta Life Insurance Co. Ltd -0.01578 0.03089 0.17576 0.00374 0.12120 152 Pragati Insurance Ltd. -0.00832 0.00944 0.09715 0.00264 0.27977 153 Sandhani Life Insurance Ltd -0.01503 0.01121 0.10589 0.00278 0.24798 154 Prime Insurance Company Limited -0.00360 0.01679 0.12958 0.00356 0.21221 155 Pioneer Insurance company Ltd. -0.01376 0.00623 0.07894 0.00125 0.20022 156 Mercantile Insurance Co. Ltd. -0.00224 0.00992 0.09959 0.00261 0.26278 157 Agrani Insurance Co Ltd. -0.00354 0.01143 0.10689 0.00241 0.21098 158 Popular Life Insurance Company Ltd. -0.00241 0.01622 0.12737 0.00269 0.16608 159 Fareast Islami Life Insurance Co. Ltd. -0.00355 0.00784 0.08855 0.00287 0.36616 160 Meghna Life Insurance Co. Ltd. -0.00709 0.01119 0.10580 0.00343 0.30623 161 Nitol Insurance Co. Ltd. 0.00132 0.01083 0.10405 0.00310 0.28661 162 Asia Pacific General Insurance Co. Ltd. -0.00219 0.01044 0.10216 0.00330 0.31658 163 Sonar Bangla Insurance Ltd. -0.00769 0.00722 0.08494 0.00213 0.29561 164 Pragati Life Insurance Ltd. 0.00530 0.01903 0.13796 0.00222 0.11649 165 Prime Islami life Insurance Ltd. -0.00410 0.01936 0.13915 0.00296 0.15289 166 Paramount Insurance Co. Ltd. -0.00236 0.01021 0.10104 0.00148 0.14503 167 City General Insurance Co. Ltd. -0.00785 0.01200 0.10953 0.00324 0.26965