To the past and present ladies associated with offices 261 and 262, thank you for being my friends and support system. Trey and Ashley, thank you for supporting me and for always helping to turn my tears into laughter.
INTRODUCTION
Motivation
The data available through asset management information systems can be used to develop decision support systems (DSS) for MR&R activities. There are few case studies available that address how to fully utilize error prediction models to make asset management decisions.
Research Goals
Utility decision makers need case studies of easy-to-implement optimization routines that demonstrate how to integrate analysis of error probability and consequences into MR&R planning. Objective 1: Calibrate and validate a Weibull Hazard Rate Model (WHRM) that accounts for uncertainty in pipeline properties using binary variables and reduces the amount of explanatory variables needed by introducing a cluster variable for spatial failures.
Organization of Dissertation
Objective 3-Calibrate and validate the WHRMS for medium and small enterprises and recalibrate the parameters using model transfer techniques that explore the information input from large enterprises. Recommendations for developing models to prioritize MR&R activities for medium and small enterprises are presented.
BACKGROUND
Introduction
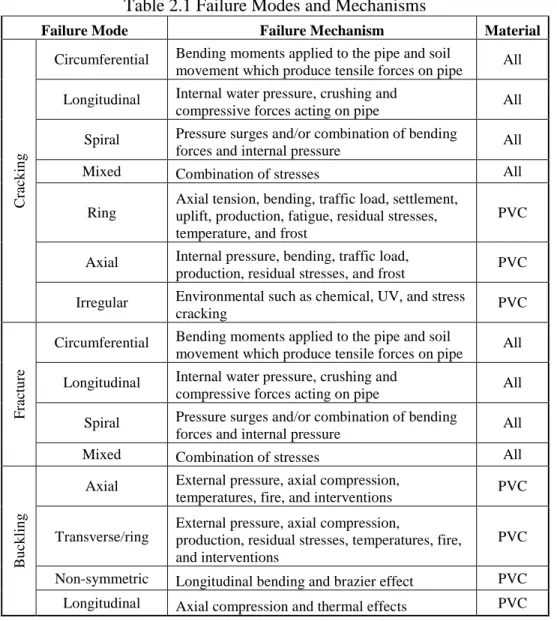
Pipe Materials and Failure Modes .1 Ductile Pipe
In relation to installation practices, pipes left in the sun for too long before laying are subject to chemical degradation, degrading the structural integrity of the pipe. An additional cause of pipe failure due to PVC pipe installation is excessive insertion at the pipe joint, where the pipe joint is inserted too far into the bell, causing breakage [29].
Pipe Repair
The crew gathers information about the pipe, including material, size, upstream valve location, and downstream valve location. The pipe is then pressure tested and the water is sampled for chlorine and bacteria.
Pipe Maintenance
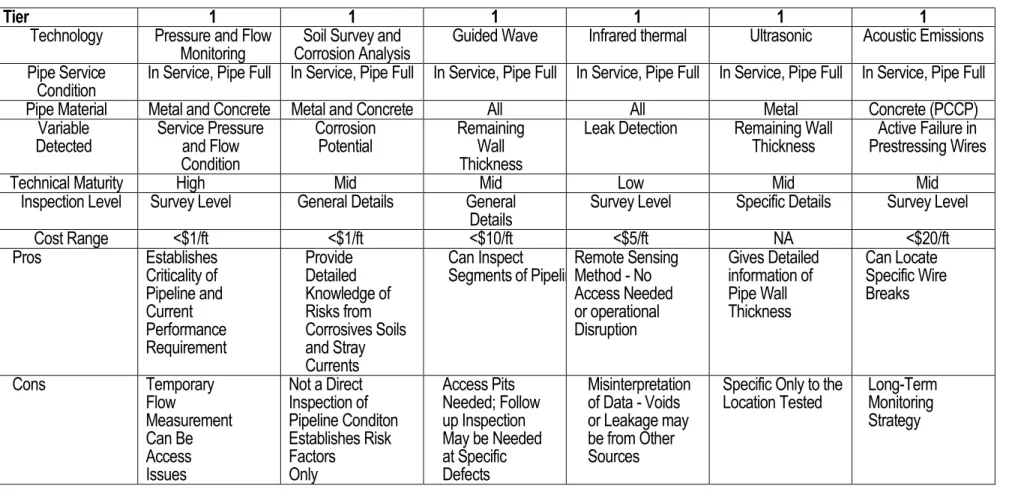
Condition in service, pipe full in service, pipe full in service, pipe full in service, pipe full in service, pipe full in service, pipe full. With the options to replace or inspect assets, and the varying value of information obtained from condition assessment technologies, a resource allocation problem is presented.
Water Pipeline Failure Prediction Models
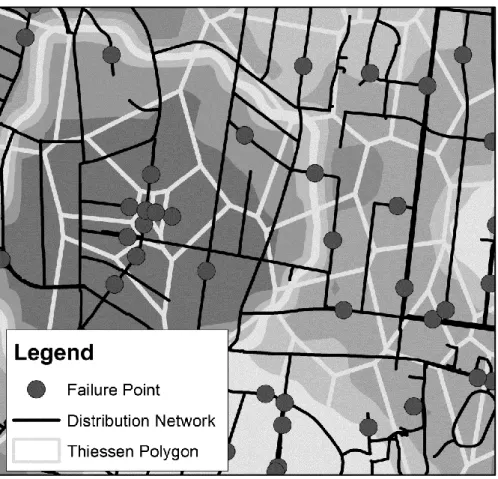
A spatial search algorithm is used to find subsets of the network where the breakage rate is higher. Failure rates were assigned to centroid points of the cells and Moren's I statistic was calculated for the failure rate points.
Optimization of MR&R Activities
The updated model is used to develop a rehabilitation framework, but validation metrics of pipe rupture prediction performance for the small utility are not included. In a previous work [81], the authors demonstrate the use of a multi-objective genetic algorithm (OPTIMOGA) to identify pipes for replacement and/or expansion, thereby minimizing the financial impact of pipe failures.
Utility Practice
The definition of pipe length used in most statistical and machine learning models is vague. The cost of the algorithm is directly related to the number of objectives and the number of decision variables.
Contribution to Literature
Second, an optimization routine is demonstrated that uses the WHRM results to prioritize pipe replacement and minimize the consequences of failure, while taking into account the spatial dependence of pipe replacement projects. An investigation into the use of binning methods to prioritize pipe replacement in specific regions is being conducted.
UTILITY INFORMATION 3.1 Introduction 3.1 Introduction
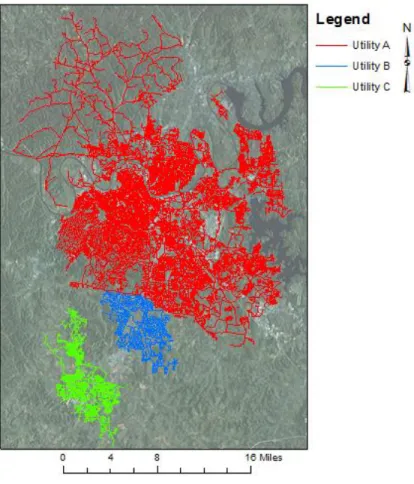
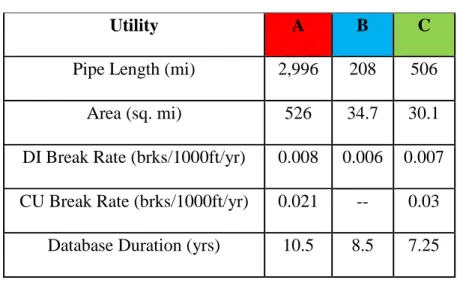
Utility A
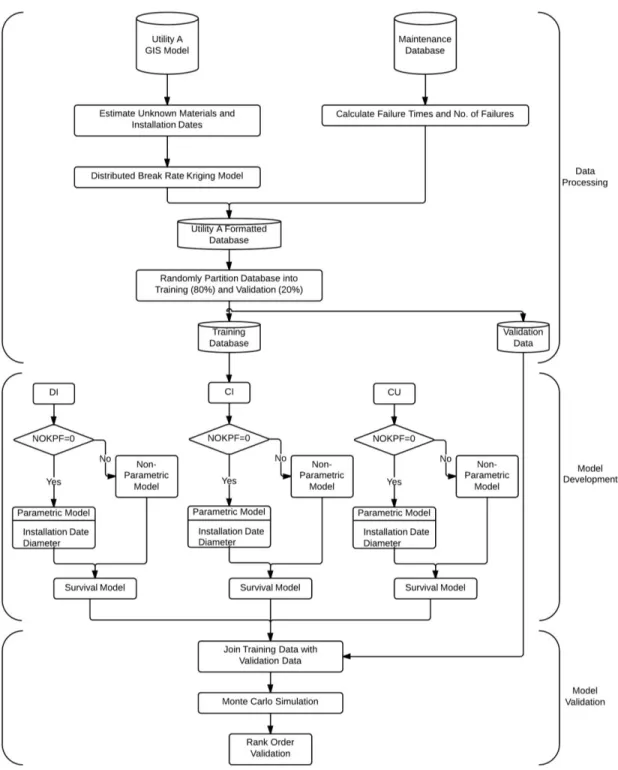
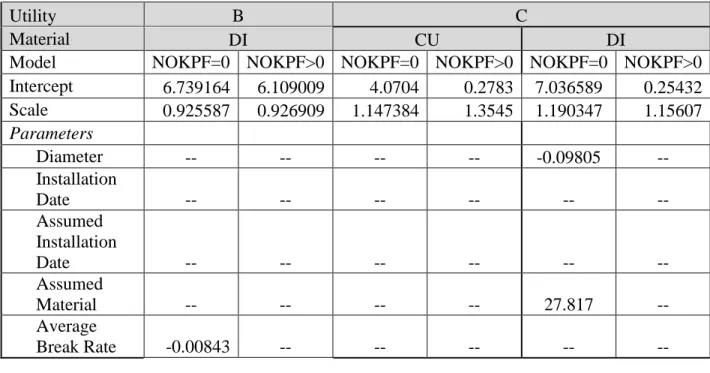
The work orders related to breaks were extracted from the CMMS database and failure times with respect to the start of the asset management database were calculated. Using expert knowledge of the network, missing materials and installation dates were imputed, and binary categorical parameters were introduced to account for the assumed materials and installation dates.
Utility B
Using a process similar to Utility A, expert elicitation was used to fill data gaps related to missing materials and installation dates, and categorical variables were used to account for these assumptions. To identify defective pipes, the failure locations were geocoded and a shapefile of failure points was created.
Conclusions
Defect records included intersection addresses or locations, and many records did not describe pipe material. Using the same process described for Tool B, a buffer was created around the failure points and the pipe segment closest to the failure point was identified.
Introduction
Tools may not have data or the means to collect data needed in many presented models. Examining the rupture rate within clusters of faults could lead to a surrogate parameter for data such as ground conditions and traffic levels that are difficult to collect and have inherent uncertainty.
Objectives
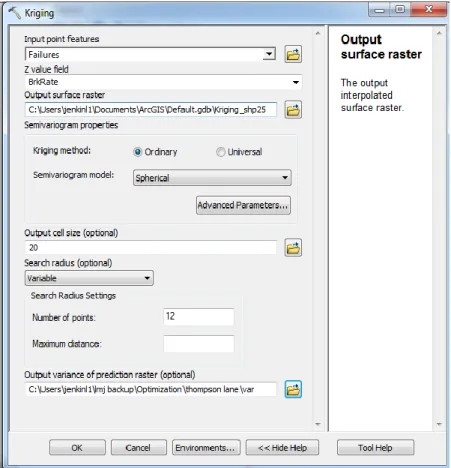
The second improvement builds on the first and adds a localized distributed fracture velocity as a covariate. The failure rate is obtained by developing a kriging model for failure rate at fault areas in the network.
Literature Review
Bogárdi [56] investigates the spatial homogeneity of pipe defects by calculating the rupture rate to be used as an intensity term in a Poisson distribution. Bogárdi's model is one of the first to use the current break rate to estimate the future state of the network.
Utility Data
An improvement to the model recommended in this paper is the inclusion of localized fracture rate as a covariate in WPHM, which is not calculated using arbitrary mesh sizes. Although tube length is used as a covariate or explanatory variable in many statistical models, the uncertainty associated with attempting to correct for segment lengths makes it impractical to include length in the model.
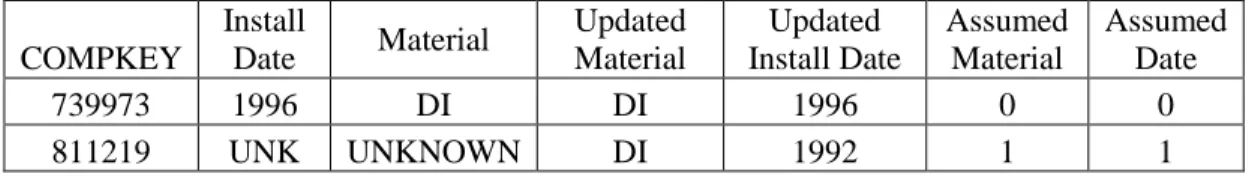
Addressing Unknown Material and Installation Dates
Therefore, pipe segments estimated to be ductile iron pipe were assigned an installation date of 1992. Pipe segments known to be ductile iron (DI) but lacking only an installation date were also assigned an assumed installation date of 1992.
Spatial Variation of Break Rates
Regarding the evaluation of the comparative performance of the presented models, the survival model is solved for the time shown in equation 4.9. The described routine will be used to simulate the number of expected annual failures over the duration of the observation period for the asset management database for utility A.
Results
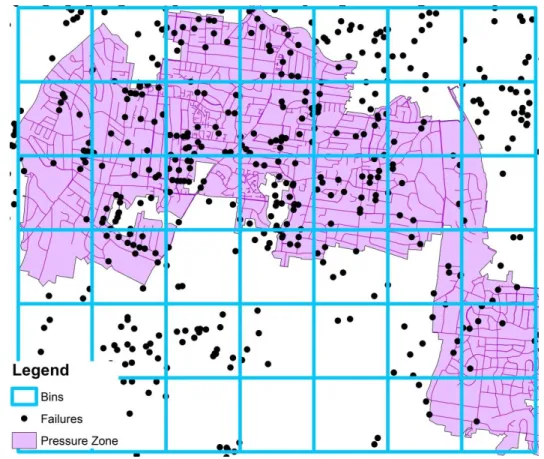
Using the model calibration results obtained above, Monte Carlo simulation routines were used to simulate failures in the duration of the asset management database. Pipes are grouped by quantile and the sum of the predicted breaks for each quantile is compared to the sum of observed breaks for each group.
RISK-BASED OPTIMIZATION OF MR&R ACTIVITIES
Introduction
As an alternative to using an algorithm to make binary decisions about which individual assets to replace, a new method is introduced that is used to decide which part of the network to perform work. Repair versus replacement cost ratio analysis is used to determine which areas of the network to work on and how much to invest in those areas to mitigate the impacts of failure.
Background
In estimating the total cost of a failure, the researchers also introduce an equation to calculate the cost of lost water assuming an average fracture diameter and velocity. Water loss due to interruptions also results in increased energy costs due to increased pressure requirements due to water losses.
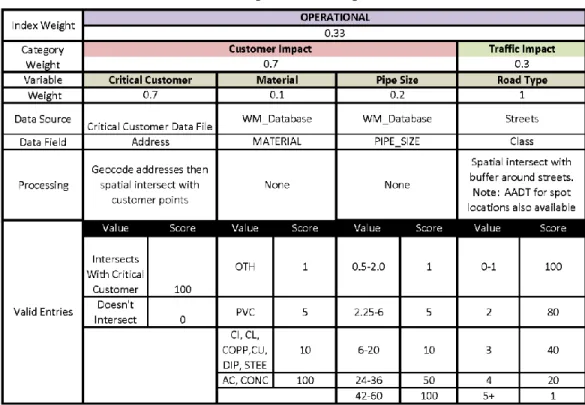
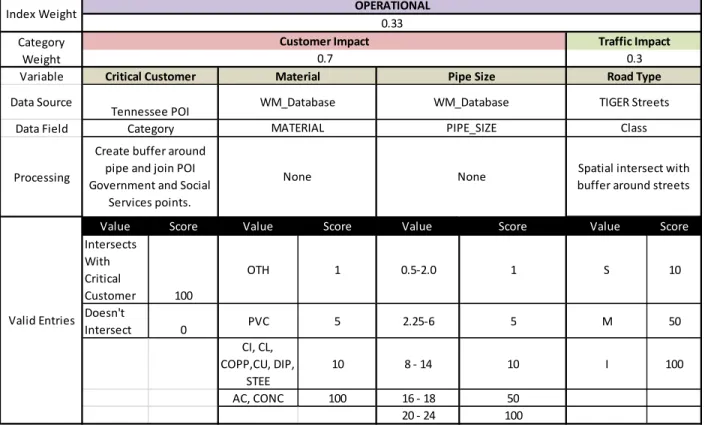
Consequence Analysis
Specifically, one must compare case studies of previous pipe failures within the network and the associated social costs with the results of the consequence analysis multiplier used in the optimization methodology. Where 𝑃𝑓(𝑥) is the probability of pipe failure, 𝑆(𝑥) is the survival function and 𝑥 is the time after the end of the asset management database duration defined in Equation 5.2.
Case Study and Analysis
The areas selected for priority efforts based on the best solution and the percentage of the annual budget allocated to each area are shown in Figure 5.3, which includes the areas and pipes overlaid on the outage rate distribution map. To demonstrate how this method can be used to prioritize street-level assets, Figure 5.4 shows the pipelines with the highest CR values for the right two southwest zones.
Conclusions
Although there is correspondence between the high priority pipes selected from the alternative framework and the work zones, it can be seen that there is still a large percentage of pipes outside these zones, making project selection difficult.
INVESTIGATION OF TRANSFER TECHNIQUES FOR WATER PIPE FAILURE PREDICTION MODELS FOR MEDIUM AND SMALL UTILITIES
Introduction
Investigating the potential spatial transferability of models may lead to a solution to the problems associated with training survival models for medium and small utilities with limited data sets. The paper is organized as follows: An overview of prioritization models and the development of models for medium and small utilities is introduced.
Background
Model transfer has been proposed as a possible solution for training valuable models for small enterprises. Although model transfer techniques have been theorized and demonstrated in a limited capacity, they should be tested in more medium and small enterprises.
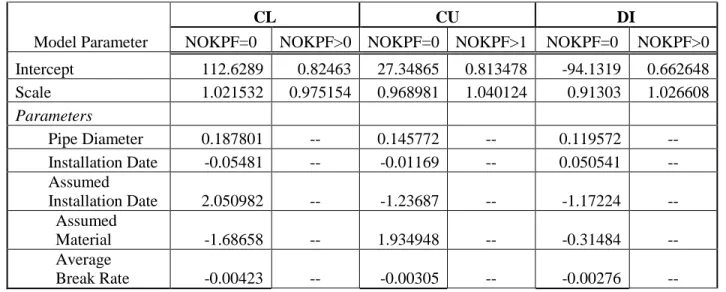
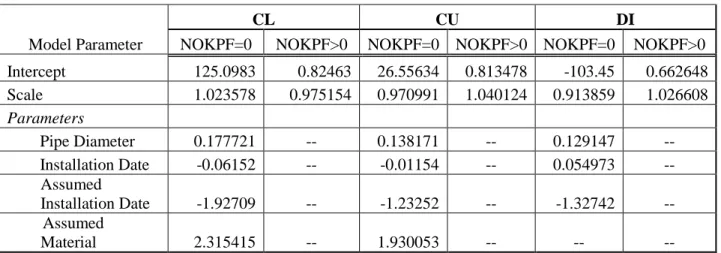
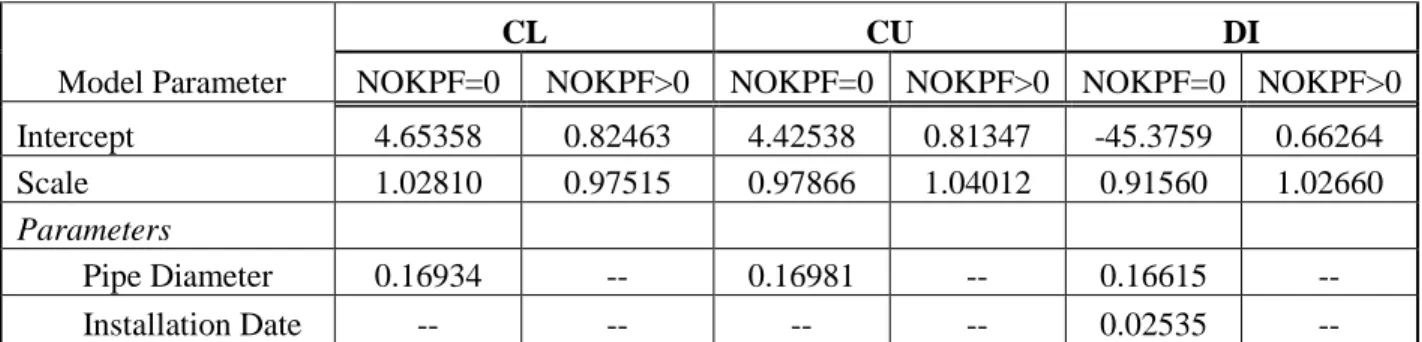
Model Parameters
In addition, the potential improvements in model transfer obtained by the CTE method should be investigated. Finally, more thorough validation techniques should be used to understand forecast performance at the asset level.
Methodology
The CTE method introduced by Benakiva and Bolduc [113] examines the variance or transfer bias between parameter estimates for the application region and the transfer region by evaluating the Mean Square Error of the combined estimator. 𝚺𝑖 is the covariance matrix of the regression parameters for the estimation region 𝚺𝑗 is the covariance matrix of the regression parameters for the application region Δ is the transfer bias, (𝜽𝑖− 𝜽𝑗).
Results
In contrast, Figure 6.2a to Figure 6.5a show the validation plots for models calibrated to utilities B and C. The jagged error bars that correlate with the disagreement between predicted and observed deciles show that the survival models are not valid. Potential reasons for the lack of direct transferability of the models could be explained by differences in the data sets.
RISK-BASED OPTIMIZATION OF MR&R ACTIVITIES FOR MEDIUM AND SMALL UTILITIES
- Introduction
- Background
- Methodology
- Case Study
- Conclusion
The results of the histogram analysis shown in Figure 7.6 indicate that 6 inch pipes are more likely to fail than pipes of other sizes. These pressure differences are indicative of the water hammer effect caused by the rapid changes in water velocity [118].
CONCLUSIONS
Summary of Accomplishments
None of the models examined consider the cost-effectiveness of using condition assessment technologies before making replacement and renewal decisions. This work can be extended to evaluate business cases, considering the value of condition assessment information before making rehabilitation and replacement decisions.
Methodology
Because lag vectors near the edges of bins can cause problems in determining the semivariogram, kernel functions are used to weight the semivariogram. When examining semivariogram plots, there is a tendency for the semivariogram values to flatten as distances increase.
![Figure A.1: Depiction of Semivariogram Range and Sill [130]](https://thumb-ap.123doks.com/thumbv2/123dok/10732197.0/168.918.268.628.113.393/figure-1-depiction-semivariogram-range-sill-130.webp)
Running a Kriging Model in ArcGIS 10.0
To assign values from a raster image to pipe segments, the raster image must be converted to a geostatistical surface. Once the geostatistical surface is constructed, the average fracture rate along each pipe segment is added to the pipe asset table using a spatial geoprocessing tool.
Improvements in Kriging
Savic, "Assessment of Pipe Failure Rate and Mechanical Reliability of Water Distribution Networks Using Data-Driven Modeling," J. Kranioti, "Urban Water Distribution Network Asset Management Using Spatio-Temporal Analysis of Pipe-Failure Data," in International Conference on Computing in Civil and building.