Developing technologies for real-time whole- organism imaging via FTIR spectromicroscopy
Thesis by
Elizabeth Anne Holman
In Partial Fulfillment of the Requirements for the Degree of
Doctor of Philosophy
CALIFORNIA INSTITUTE OF TECHNOLOGY Pasadena, California
2022
(Defended July 6, 2021)
2022
Elizabeth Anne Holman ORCID: 0000-0002-5158-4689
ACKNOWLEDGEMENTS
Thank you for the positive and constructive support from the Caltech, Advanced Light Source, BSISB imaging program, CAMERA, Kavli Nanosciences Institute, and Molecular Foundry communities, all of which were wonderful environments for learning and troubleshooting project challenges on the fly.
Specifically, thank you to my friends, family, collaborators, and labmates who were very understanding about the travel schedule involved with these projects. Thank you to Bert and Nathan from KNI who were willing to go above and beyond for exploring aspects of my research prior to the need to focus on peptoid technologies. Thank you to Barbara who was willing to watch over my plants at Caltech during experiments away from Los Angeles.
Thank you to Ron for his mentorship while at the Molecular Foundry, and to Isaac, who willingly taught me the nuances of Langmuir trough experiments. Thank you for the support from the graduate office and registration (Tess, Angelica, Felicia, Natalie, Doug), which minimized the complications that may have arisen. Thank you to Corie and other LBNL staff who facilitated my access to LBNL for ongoing peptoid-related experiments at the Molecular Foundry during COVID-19. Thank you to my thesis committee members for their patience, wisdom, and constructive and honest advice.
Without funding support from the NSF GRFP and the DOE SCGSR, these projects would not have been possible. Without the mentorship of and support from Doug (co-advisor), who urged that I approach Paul (advisor) for a project discussion, and Paul, who told me that my job as a graduate student was to become the best scientist that I could possibly be, I would never have been able to freely pursue my research interests in an unfettered manner.
I am thankful and grateful for the opportunities that I have had over the course of my time as a graduate student. Notably, although I am not certain about the identity of reviewer number two, thank you for your candid commentary during COVID-19 quarantine which made me remember (and subsequently follow through with) the importance of divulging the complete truth behind my initial enthusiasm of investigating scientific phenomena.
Lastly, I am thankful for my life-changing yet brief interaction with the late Professor John H. Richards, who heavily influenced my approach to graduate research. Accessible, personable, and scientifically versatile with perpetual excitement for intellectual discussions even during our last meeting as his TA, he taught me that if I strongly believe in the importance of a specific scientific pursuit, then that “is the science worth doing” even if it requires learning aspects of scientific fields outside of my expertise. I still feel extremely guilty about the extensive wisdom and insights that were either inaccurately documented or undocumented due to his sudden and unexpected passing. I sincerely wish that I had more time to learn from him and still miss his guidance even now.
ABSTRACT
FTIR spectromicroscopy heavily resides in the domain of cell-based and tissue- based studies when focusing on its direct application to biological systems. The goal of the reported graduate research is to extend FTIR spectromicroscopy to multicellular whole- organism imaging, ideally for non-invasive, non-destructive, and label-free spatiochemical imaging of biological model Caenorhabditis elegans (C. elegans). With modern optics, detector, and light source technologies implemented at synchrotron facilities, this thesis focuses on exploring the feasibility of multicellular whole-organism imaging while
identifying challenges and presenting working solutions for them. A brief introduction and explanation of infrared spectroscopy and the instrumentation enabling the experimental technique’s development into one of spatiochemical imaging capabilities (Chapter 1) precedes the performed graduate research. The selection and preliminary assessment of C.
elegans as our biological multicellular whole-organism model (Chapter 2), a solution for performing efficient scanning hyperspectral imaging of complex biological organisms (Chapter 3), and the design and synthesis of biomimetic nanomaterials for IR imaging applications (Chapter 4) are described in subsequent chapters.
PUBLISHED CONTENT AND CONTRIBUTIONS
Holman, E.A., Fang, YS., Chen, L. et al. Autonomous adaptive data acquisition for scanning hyperspectral imaging. Commun Biol 3, 684 (2020).
https://doi.org/10.1038/s42003-020-01385-3
E.A.H. participated in implementing the algorithm at ALS Beamline 1.4.3. and in designing and testing the IR processing module. E.A.H. designed and performed proof- of-principle experiments. L.C. and E.A.H. performed IR data processing. E.A.H.
performed IR spectral analysis, gathered materials from all authors, and wrote the manuscript.
TABLE OF CONTENTS
Acknowledgements ... iii
Abstract ... iv
Published Content and Contributions ... v
Table of Contents ... vi
Nomenclature ... vii
Chapter 1: Introduction ... 1
Brief history of mid-infrared spectroscopy ... 1
Instrumentation for FTIR spectromicroscopy ... 3
Toward applications for whole-organism spatiochemical imaging ... 8
References ... 10
Chapter 2: Whole-organism FTIR spectromicroscopy: a feasibility study in Caenorhabditis elegans ... 11
Abstract ... 11
Introduction ... 11
Results and discussion ... 13
Conclusion ... 24
Methods ... 25
References ... 26
Chapter 3: Autonomous adaptive data acquisition for scanning hyperspectral imaging ... 28
Abstract ... 28
Introduction ... 29
Results ... 30
Discussion ... 42
Methods ... 44
References ... 52
Chapter 4: Designing optically transparent photocrosslinked peptoid nanosheets for imaging applications ... 54
Abstract ... 54
Introduction ... 54
Results and discussion ... 58
Conclusion ... 66
Methods ... 66
References ... 70
Appendix A ... 71
Appendix B ... 72
Appendix C ... 75
NOMENCLATURE
IR. Infrared region of the electromagnetic spectrum.
MIR. Mid-infrared region of the electromagnetic spectrum.
Absorption band. A range of energies, often described in the form of frequency or wavelength for spectroscopy, that are characteristic of a specific transition from an initial to final state of a sample.
Thermopile. A device using the thermoelectric effect to convert thermal energy into electrical energy through the use of connected thermocouples.
Wheatstone bridge. The resistance bridge circuit that calculates an unknown resistance by balancing two arms of a bridge circuit. It consists of three known resistors and one unknown resistor and is used to precisely measure low resistances.
Wavenumber. A unit of spatial frequency that is defined as number of wavelengths per unit distance, typically centimeters for applications in spectroscopy.
FTIR. Fourier-transform infrared spectroscopy, a technique used to obtain a high-resolution infrared spectrum of absorption or emission of a sample.
NMR spectroscopy. Nuclear magnetic resonance spectroscopy.
NEP. Noise equivalent power.
BLIP. Background-limited infrared photodetector.
MCT. Mercury cadmium telluride (usually used in the case of detector identification).
SIR. Synchrotron infrared radiation.
SR-FTIR. Synchrotron radiation Fourier transform infrared (usually used with spectromicroscopy).
PCA. Principal component analysis.
MCR-ALS. Multivariate curve resolution alternating least square analysis.
VIS. Visible light region of the electromagnetic spectrum.
C h a p t e r 1
INTRODUCTION
“Who sees farther, a dwarf or a giant? Surely a giant for his eyes are situated at a higher level than those of a dwarf. But if the dwarf is placed on the shoulders of the giant, who sees further? Surely the dwarf, for now the eyes of the dwarf are situated at a higher level than those of the giant. So too, we are dwarfs, astride the shoulders of giants. We master their wisdom and move beyond it. Due to their wisdom we grow wise and are able to say all that we say, but not because we are greater than they.”
Isaiah di Trani (c. 1180–1250)
Brief history of mid-infrared spectroscopy[1]
The infrared (IR) region of the electromagnetic spectrum was first discovered by Sir William Herschel in 1800 and emerged from his observation that heat along with light was generated on the lenses that he used for his solar observations. Through the early 1800s, sensitive temperature-measurement methods and alternative sources of solar heat radiation were developed and discovered respectively. This lay the foundation for experiments of the 1840s and 1850s, which supported John Tyndall’s speculation that the origins of IR absorption are vibrations within molecules.
Macedonio Melloni performed the first measurements of the mid-infrared (MIR) absorption bands using a rocksalt crystal for dispersion experiments. By 1850, he completed his slit-containing spectrometer design that incorporated a lens to image the slit and a method by which the slit-shaped thermopile could sample across the spectrum created by a fixed prism. This became the instrument for MIR radiation study for several decades, and its spectral resolution was limited by the amount of radiation needed to fill the detector.
Samuel P. Langley addressed the resolution issue by implementing three concepts into the form of a smaller detector, termed a bolometer. By constructing the detector with low heat capacity materials, he created a chamber in which temperature changes would be greatly increased in comparison to previous devices; by utilizing narrow slits, he reduced the heat lost by the device prior to assessing the device’s change in temperature. Incorporating A. F. Svanberg’s methodology of heat detection from 1851, Langley used a blackened platinum wire as a material of unknown electrical resistance in a Wheatstone bridge—the platinum wire was blackened to better absorb the infrared radiation, and its resistance would change as a function of temperature. The bolometer would be used to lay the foundation for further developments in the IR detector field until the application of electronic amplification methods and semiconductor technology during World War II.
Although Langley also was responsible from the first calibration of IR spectra in terms of wavelength, Willem Henri Julius recorded the MIR spectra of 20 organic liquids in 1892 and found that certain compounds with the same functional group always had a conserved absorption band at the same wavenumber[2]. His work highlighted multiple instances of spectral regularity among the 20 compounds and drew attention to the strengths of the fundamental region of infrared, namely the amount of detail present in the spectra when systematically measuring across the MIR region. Years later and inspired by W. H.
Julius’ results, William Coblentz obtained spectra of 112 organic compounds up to the transmission limit of his rocksalt prism of 667 cm-1 (15 µm) in comparison to the transmission limit of Julius’ at 1000 cm-1 (10 µm). In the 1920s, Jean Lecomte introduced the concept of viewing an IR spectrum as an overall pattern of absorption bands that could serve as a molecular fingerprint when studied with the compound’s distinguishable
isomers[3]. By the 1930s, Reinhard Mecke developed a notation for approximately describing vibrational motions of group characteristic vibrational modes, namely the bond- stretching (ν), angle-bending (δ), and out-of-plane (γ) modes. The cumulative results of the scientists around the world during this time and were applied during World War II, showing the usefulness of IR spectroscopy for molecular structure analysis via group frequencies by 1947[1].
With advancements in electronic amplification methods and double beam spectrometers, the level of automation and ability to correct the data for light-source behavior respectively greatly increased the accessibility and ease of IR spectroscopy during and after World War II. The introduction of computers to spectrometers in the 1970s enabled exploitation of interferometry and subsequent development of Fourier transform infrared (FTIR) spectrometers[1]. The advantages obtained in higher sensitivity coupled with digital processing of IR data drastically increased the opportunities of IR spectroscopic applications, setting the stage for modern-day FTIR imaging and its use in agriculture, polymer science, and biomedicine[4, 5].
Instrumentation for FTIR spectromicroscopy
New experiments that could be performed after 1945 due to technological advancements in instrumentation broadened our understanding of spectroscopic phenomena via IR spectroscopy until NMR spectroscopy of the 1950s and mass spectrometry of the 1960s were able to serve as physical methods for determining structural information of compounds. However, this only led IR spectroscopy to be explored for further applications towards areas such as microscopy. IR spectromicroscopy combines infrared spectral analysis with the spatial resolution of a microscope. Three major technologies emerged that supported
the potential of FTIR to be used as a spatiochemical imaging technique: the sensitive infrared detectors, brighter light sources and optics, and increased computational power of computers used with the spectral microscopes.
Well-designed infrared detectors try to achieve generally reasonable responsivity and noise equivalent power (NEP) while minimizing all noise sources to the point where thermal background shot noise is the dominant noise component for the detector. IR detectors that operate in this regime successfully are called background limited infrared photodetectors (BLIPs). Where an ideal IR detector generates no noise, and hence, the only other noise component detectable by the detector should emerge from the shot noise due to photons reaching the detector from objects at ambient temperatures that are within the detector’s field to view, a detector operating in the background limited regime or BLIP is the best practical form of a detector in the real-world experimental space. In the case of infrared detectors, responsivity is determined by the ratio of electrical output divided by the incident infrared power in order to quantitatively determine the detector’s ability to convert infrared radiation into electrical signal. Importantly, this parameter neither determines the repeatability of the detector’s measurement nor the minimum magnitude of signal that the detector can resolve.
To address this, NEP is used to quantitatively assess the detector’s ability to resolve small signals and is the ratio of noise power density at the detector’s output divided by the its responsivity[6]. NEP is incorporated into specific detectivity (D*), which corrects for NEP’s dependency on the detector’s active area as
𝐷𝐷∗ = (𝐴𝐴𝑑𝑑𝑑𝑑𝑑𝑑)0.5 𝑁𝑁𝑁𝑁𝑁𝑁 ,
where Adet is the area of the detector, and D* also represents the signal-to-noise ratio of a detector of unit area in a unit bandwidth when a radiant power of 1 W is hitting the detector.
With the emergence of the photon detectors and cryogenic cooling options, detection capabilities increased for IR spectroscopy in the MIR region for two reasons: (1) photon detectors respond over a narrow section of the spectrum in comparison to thermal detectors to reduce thermal background noise and reach operational BLIP conditions with appropriate cooling, and (2) photon detectors operate on a much faster time scale than thermal detectors, the response time being on the order of microseconds instead of milliseconds respectively[6].
Specifically, the introduction single-element photoconductive mercury cadmium telluride (MCT) detectors greatly enabled MIR spectroscopy to enter its era of time-resolved spectroscopy when paired with an interferometer.
As a direct result of computational abilities and the MCT detector’s response time, co-addition of frames or mirror scans could easily be performed per spectrum as well as background subtraction per spectrum in order to increase the signal-to-noise ratio (S/N); the higher sensitivity of the photoconductive single-element MCT detectors also contributed to the overall increase of signal with minimal noise[7]. To further sample visualization with FTIR spectroscopy, the commercial development of multichannel IR detectors became possible through a hybrid detector approach, in which one layer performs the photon detection and the second layer executes signal collection, multiplexing, and amplification.
This permitted the development of single-element detector arrays to increase the spatial coverage per sampling event—64 x 64 pixel MCT detectors (3500 cm-1 to 900 cm-1) and 256 x 256 MCT arrays (4000 cm-1 to 900 cm-1) became commercially available in FTIR instruments[4]. Today, IR detectors can effectively cover the MIR region of 4000 cm-1 to 650
cm-1 while spatially resolving scientific phenomena. The main detection limitation occurs in the temporal domain, where the speed of photon-to-signal conversion in MCT detectors occurs on the millisecond timescale. It should be noted that in 2021, single-photon detection was successful achieved in the MIR region for wavelengths between 3 to 10 microns using tungsten silicide superconducting nanowire detectors, suggesting that developments in nanotechnology may enable future detector developments for FTIR spectromicroscopy[8].
In a similar manner to detector technology limiting the broad application of FTIR spectroscopy, light sources and their associated brightness became increasingly important when aiming for high spectral as well as spatial resolution for FTIR spectromicroscopy. Light of a specific wavelength is often characterized by its brightness, bandwidth, and power.
Brightness is defined as the following
𝐵𝐵(𝜈𝜈) = 𝑝𝑝𝑝𝑝𝑝𝑝𝑝𝑝𝑝𝑝
𝑎𝑎𝑝𝑝𝑝𝑝𝑎𝑎×𝑠𝑠𝑝𝑝𝑠𝑠𝑠𝑠𝑠𝑠 𝑎𝑎𝑎𝑎𝑎𝑎𝑠𝑠𝑝𝑝 ,
and its relationship to the S/N in an IR region where an FTIR instrument is limited by detector noise is
𝑆𝑆
𝑁𝑁= 𝐵𝐵(𝜈𝜈) × (𝛿𝛿𝜐𝜐) ×𝐷𝐷∗×𝐶𝐶 (∆𝑓𝑓)0.5 ×𝐴𝐴0.5 ,
where 𝐵𝐵(𝜈𝜈) is source brightness, 𝛿𝛿𝜐𝜐 is resolution, D* is detectivity, C is optical efficiency multiplied by the limiting étendue of the experiment, ∆𝑓𝑓 is the electronic bandwidth, and A is detector area. Since brightness cannot be well-controlled for IR thermal sources outside of either altering emissivity or changing temperature, brightness maximization was typically ignored until photodetectors and alternative light sources became available and accessible.
Government-funded electron particle accelerators enabled the generation and use of synchrotron radiation as a high-brightness and broadband IR light source for diffraction-
limited FTIR spectromicroscopy. The Advanced Light Source at Lawrence Berkeley National Laboratory is the nearest government synchrotron IR (SIR) radiation source to Pasadena, CA. At this synchrotron, electrons are accelerated close to the speed of light and are circulating in a storage ring. Since the electron is traveling relativistically in a magnetic field with a motion that describes a circle, the light energy emitted from the electron generates a sharp pulse (in time), its resulting Fourier transform yielding a broadband spectrum[9].
Specifically, SIR can be up to 1000 times brighter than conventional thermal IR sources in the molecular fingerprint region of the MIR region[10]. When paired with custom beamline optics, this brightness can approach a diffraction-limited spot size of 2 to 10 µm, which directly contrasts with the globar IR source spot size of greater than 100 µm aperture in order to obtain similar S/N values[11].
Although more developments in materials science and engineering allowed scientists to harness SIR as an alternative light source in FTIR spectromicroscopy, advancements in computer hardware and software catalyzed the technique’s application to complex biological systems. Automation of the Michelson interferometer in FTIR spectrometers permitted rapid acquisition of IR spectra, and utilizing broadband light sources increased the detector’s S/N by obtaining multiplexed measurements—as described by Fellgett’s advantage[1]. By increasing the speed with which IR spectra could be gathered from a hardware standpoint, it became possible to not only observe biological systems in a non-invasive and label-free manner but also to observe their phenomena and how these organisms may change under perturbative effects, such as introducing environmental stimuli. An initial primary concern emerged from the intensity of the MIR photons generated from the synchrotron when applying SR-FTIR spectromicroscopy to living biological systems, though the energy of the
MIR photons theoretically was too low in energy to cause bond breakage. This question was addressed by assessing temperature heating of a fully hydrated lipid layer. The mechanism of heating emerges from infrared heating of water, which then causes the hydrated lipid layer to undergo a phase change at 315 K during heating. This experiment showed that negligible sample heating at 0.5 ± 0.2 K occurred over the course of a 30-minute acquisition timeframe at a single point[12]. With these findings along with experiments monitoring E. coli biofilm response to antibiotics, SR-FTIR spectromicroscopy became widely accepted as a non- invasive, label-free spatiochemical imaging technique that could potentially track in situ biochemical phenomena in real-time[13].
Toward applications for whole-organism spatiochemical imaging
SR-FTIR spectromicroscopy is a non-destructive, label-free, highly sensitive spatiochemical technique that can perform real-time monitoring of biological systems ranging from single cells to biofilms and tissues. Over the last decade, MIR-tunable quantum cascade lasers were developed further to serve as a more accessible broadband light source alternative to a synchrotron[14, 15]. With broadband MIR light sources to be implemented in the near future for FTIR spectromicroscopy, interest in actively applying this technique in the biomedical field for precision theranostics and disease research has renewed and grown.
Currently, FTIR spectromicroscopy heavily resides in the domain of cell-based and tissue-based studies when focusing on its direct application to biological systems. The goal of this reported graduate research is to extend FTIR spectromicroscopy to multicellular whole-organism imaging via the biological model Caenorhabditis elegans (C. elegans).
With modern optics, detector, and light-source technologies implemented at synchrotron facilities, this thesis focuses on exploring the feasibility of multicellular whole-organism
imaging while identifying challenges and presenting working solutions for them. The selection and preliminary assessment of C. elegans as our biological multicellular whole- organism model (Chapter 2), a solution for performing efficient scanning hyperspectral imaging of complex biological organisms (Chapter 3), and the design and synthesis of biomimetic nanomaterials for IR imaging applications (Chapter 4) are described in subsequent chapters.
References
1. Sheppard, N., The Historical Development of Experimental Techniques in
Vibrational Spectroscopy, in Handbook of vibrational spectroscopy, J.M. Chalmers and P.R. Griffiths, Editors. 2002, J. Wiley: New York.
2. Brand, J.C.D., Lines of light : the sources of dispersive spectroscopy, 1800—1930.
1995, Australia: Gordon and Breach. xiv, 266 p.
3. J. Lecomte, Father of French Spectroscopy, Pioneer of Infrared, French Scientific Ambassador. European Spectroscopy News, 1977. 10.
4. Kidder, L.H., A.S. Haka, and E.N. Lewis, Instrumentation for FT-IR Imaging, in Handbook of vibrational spectroscopy, J.M. Chalmers and P.R. Griffiths, Editors.
2002, J. Wiley: New York.
5. Wetzel, D.L., J.A. Sweat, and D.D. Panzer, Synchrotron powered FT-IR
microspectroscopy enhances spatial resolution for probing and mapping of plant materials. AIP Conference Proceedings, 1998. 430(1).
6. Theocharous, E. and J.R. Birch, Detectors for Mid- and Far-infrared Spectrometry:
Selection and Use, in Handbook of vibrational spectroscopy, J.M. Chalmers and P.R. Griffiths, Editors. 2002, J. Wiley: New York.
7. Smith, G.D. and R.A. Palmer, Fast Time-resolved Mid-infrared Spectroscopy Using an Interferometer, in Handbook of vibrational spectroscopy, J.M. Chalmers and P.R. Griffiths, Editors. 2002, J. Wiley: New York.
8. Verma, V.B., et al., Single-photon detection in the mid-infrared up to 10 mu m wavelength using tungsten silicide superconducting nanowire detectors. Apl Photonics, 2021. 6(5).
9. WIlliams, G.P., Synchrotron and Free Electron Laser Sources of Infrared Radiation, in Handbook of vibrational spectroscopy, J.M. Chalmers and P.R.
Griffiths, Editors. 2002, J. Wiley: New York.
10. Duncan, W.D. and G.P. Williams, Infrared Synchrotron Radiation from Electron Storage-Rings. Applied Optics, 1983. 22(18): p. 2914-2923.
11. Carr, G.L., J.A. Reffner, and G.P. Williams, Performance of an Infrared
Microspectrometer at the Nsls. Review of Scientific Instruments, 1995. 66(2): p.
1490-1492.
12. Martin, M.C., et al., Negligible sample heating from synchrotron infrared beam.
Applied Spectroscopy, 2001. 55(2): p. 111-113.
13. Holman, H.Y., et al., Synchrotron IR spectromicroscopy: chemistry of living cells.
Anal Chem, 2010. 82(21): p. 8757-65.
14. Du, Z.H., et al., Mid-Infrared Tunable Laser-Based Broadband Fingerprint Absorption Spectroscopy for Trace Gas Sensing: A Review. Applied Sciences- Basel, 2019. 9(2).
15. Bandyopadhyay, N., et al., Ultra-broadband quantum cascade laser, tunable over 760 cm(-1), with balanced gain. Opt Express, 2015. 23(16): p. 21159-64.
C h a p t e r 2
TEMPORARILY REDACTED
C h a p t e r 3
AUTONOMOUS ADAPTIVE DATA ACQUISITION FOR SCANNING HYPERSPECTRAL IMAGING
Material from:
Holman, E.A., Fang, YS., Chen, L. et al. Autonomous adaptive data acquisition for scanning hyperspectral imaging. Commun Biol 3, 684 (2020).
https://doi.org/10.1038/s42003-020-01385-3 Published by Springer Nature.
Abstract
Non-invasive and label-free spectral microscopy (spectromicroscopy) techniques can provide quantitative biochemical information complementary to genomic sequencing, transcriptomic profiling, and proteomic analyses. However, spectromicroscopy techniques generate high-dimensional data; acquisition of a single spectral image can range from tens of minutes to hours depending on the desired spatial resolution and the image size. This substantially limits the timescales of observable transient biological processes. To address this challenge and move spectromicroscopy towards efficient real-time spatiochemical imaging, we developed a grid-less autonomous adaptive sampling method. Our method substantially decreases image acquisition time while increasing sampling density in regions of steeper physico-chemical gradients. When implemented with scanning Fourier transform infrared (FTIR) spectromicroscopy experiments, this grid-less adaptive sampling approach outperformed standard uniform grid sampling in a two-component chemical model system and in a complex biological sample of Caenorhabditis elegans (C. elegans). We
quantitatively and qualitatively assess the efficiency of data acquisition using performance metrics and multivariate infrared spectral analysis, respectively.
Introduction
Advancements in optical microscopy, especially fluorescence microscopy, have enabled biologists to observe multiplexed living cellular events with ever higher spatial and temporal resolutions[1]. The use of targeted fluorescent indicators provides spatial and temporal context to omics analyses[2-4], resulting in discoveries of dynamic spatial architecture in disease pathogenesis[5], organogenesis[6], and wound healing[7]. These advances inspired the drive towards high-dimensional image-based profiling[8], which requires high information-content and rapid, robust measurements of as many living cell or tissue phenotypes as possible to capture time-dependent spatial heterogeneities in structure and morphological patterning.
One solution is to introduce another complementary dimension of label-free observation one that focuses on the spatiochemical mapping of biological systems. This information can be used to guide fluorescence microscopy, its real-time imaging capabilities limited to a few features of interest identified a priori, and to improve the interpretation of omics data and information from advanced transmitted light microscopy images. Non- invasive and label-free multiplexed imaging techniques, such as scanning synchrotron radiation-based Fourier transform infrared (SR-FTIR) spectromicroscopy, can identify and monitor spatial heterogeneity in chemical composition that is indistinguishable when using the visible region of the electromagnetic spectrum; however, a major challenge in using these techniques for real-time characterization of time-dependent biochemical processes is the substantial image acquisition time that ranges from minutes to hours. This complication
emerges from the high dimensionality of the generated data set, which contains not only spatial but also spectral information, and the utilization of uniform grid (UG) sampling as the current standard sampling method, which historically is objective and computationally inexpensive.
With advancements in the accessibility of computing technology, we find that grid- less autonomous adaptive data acquisition (AADA) is a viable and more efficient alternative to UG sampling. AADA maintains a systematic and reproducible approach while capturing spectral and spatial heterogeneity with fewer sampled points and shorter experimental time frames. We discuss the significance of this method for studying time-sensitive living systems and its future development toward monitoring time-dependent phenomena in biological systems prior to expanding our discussion towards AADA’s applicability to other fields and workflow processes.
Results
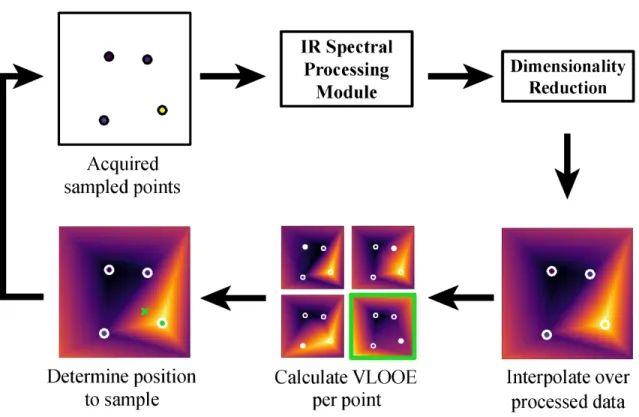
To implement an autonomous adaptive sampling algorithm (Figure 1) for data acquisition, we prioritized optimization of spatiotemporal and spatiochemical sampling efficiency while operating under experimental parameters that nonetheless yield comprehensive and informative spectral map data. We assume that less predictable yet detectable phenomena emerging from spatiochemical heterogeneity are primary regions of interest, informational “hot spots” that should be spatiochemically resolved with subsequent sample points after initial detection. To achieve this, our adaptive sampling is driven by leave-one-out cross-validation (LOOCV)[9] to facilitate rapid and accurate approximations of the experimentally mapped space[10] for predictive error calculations from which the
algorithm can rapidly identify regions for subsequent sample exploitation[11-13]. We build our surrogate models using a hybrid sequential sampling strategy closely related to other established methods[11, 14, 15] by combining two-dimensional (2D) barycentric linear interpolation with Voronoi tessellation (LIV). With LIV, the relative importance of a sampled point is determined by its adjusted Voronoi-weighted leave-one-out error (ϵLOO)[12, 16], which is calculated by normalizing and equally weighing the leave-one-out error with the Voronoi predictive error. Since collected IR spectra often form continuous and multimodal regions in our input space per sampled point[12], we introduced an IR spectral preprocessing module upstream of our surrogate model construction and LOOCV to conserve the spectral resolution while the algorithm determines where to subsequently sample.
Figure 1. Autonomous adaptive sampling workflow.
As our first experimental demonstration, we designed a two-component chemical model system of blue permanent marker and high vacuum grease for spatiochemically
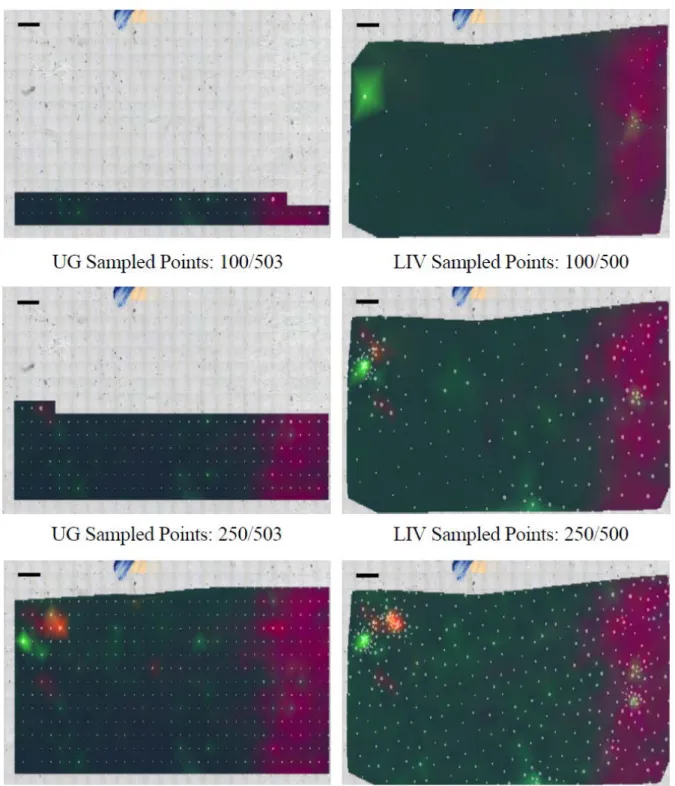
Figure 2. Autonomous sampling of abiotic two-component sample for current standard UG and adaptive LIV methods (scale bar, 200 μm). First three PCA components are shown as an RGB overlay with sampled points (white circles) and their predictive error (circle diameter).
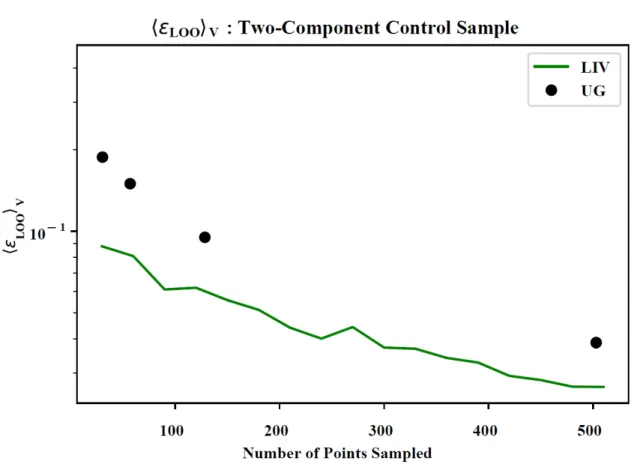
resolved characterization using scanning FTIR spectroscopy. This complete sample characterization enabled quantitative evaluations and comparisons between adaptive LIV and widely utilized, non-adaptive UG data acquisition (Figure 2). In this visibly featureless case, the mapped domain was selected with minimal experimenter knowledge input to guide the autonomous adaptive data acquisition. Under these experimental conditions, we quantitatively and qualitatively determine data acquisition performance using mathematical and spectral metrics. When using mean Voronoi-weighted LOO error ⟨ϵLOO⟩V to quantify modeling accuracy, we found that adaptive LIV data acquisition outperformed the non- adaptive data acquisition methods (Figure 3) in this experimental system.
Figure 3. Mean Voronoi-weighted leave-one-out error plotted for non-adaptive and adaptive data acquisition experiment for the abiotic two-component sample. Adaptive LIV data acquisition of map regions defined without domain knowledge outperforms current gold-standard non-adaptive data acquisition.
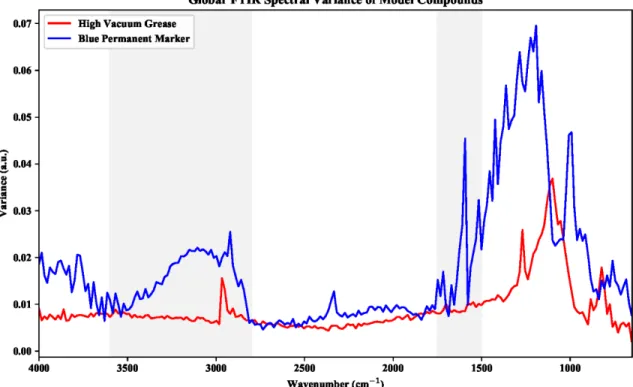
Figure 5. Globar FTIR variance fingerprint spectra of each model compound
eventually used in synthetic two-component control sample. The variance was used to determine the domains selected for exploratory PC-LDA (gray).
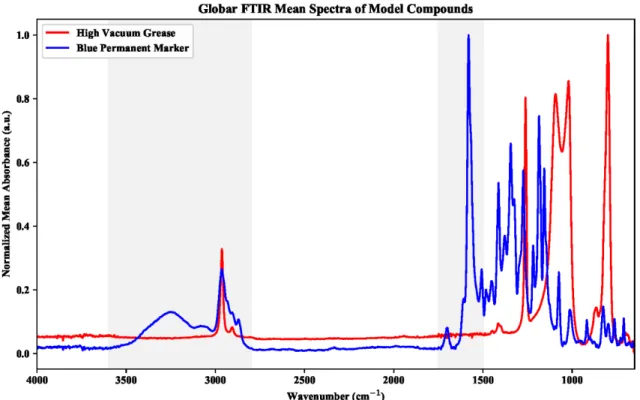
Figure 4. Globar FTIR mean absorbance identity fingerprint spectra (N = 8) of each model compound eventually used in synthetic two-component control sample. On-target ratios were calculated using spectral peaks at 1580 cm-1 and 798 cm-1, which were the major identification peaks of permanent marker and high vacuum grease respectively. PC-LDA regions (gray) were determined from mean and variance spectra.
To verify this conclusion, we tuned the spectral, on-target ratio (OTR) assessment by selecting the major contributing peak per component using our normalized mean standard spectra (Figure 4) and variance spectra (Figure 5); peak selection guided by normalized spectra emphasize chemical identification[17] over concentration in spectral interpretation.
For high vacuum grease, we referenced the symmetric stretching mode of ν(Si-O-Si) at
Figure 6. Known alcohol ingredients of Sanford Permanent Marker ink shown as
cumulative IR spectrum generated using OMNIC 9.8 alcohol libraries: ethyl alcohol, 1- propanol, 1-butanol, and diacetone alcohol in red to contrast against our normalized permanent marker ink mean spectrum obtained using globar FTIR spectromicroscopy.
Identified peaks support the discussion and analysis of the main text presenting 1580 cm-1 and region 3105 cm-1 to 3000 cm-1 vibrational modes as unique to the pigments or dyes present in the deposited ink. Plotted in OMNIC 9.8.
798 cm−1 emerging from its fumed amorphous silica[18] composition. For permanent ink presence, we used the major peak at 1580 cm−1 stemming from conjugated carbon–carbon ring ν(-C=C-) stretching modes[19] in pigment compounds[20], which was further substantiated by the presence of aromatic ν(=C-H) vibrations between 3105 cm−1 and 3000 cm−1[19] (Figure 6). All spectra were evaluated for non-adaptive UG and adaptive LIV experiments prior to processing the OTR as the proportion of on-target sampled points to total sampled points. Using this spectrally-based metric for enhanced real-world fidelity[21], we confirmed that adaptive LIV data acquisition (OTR = 0.95) outperforms non-adaptive UG
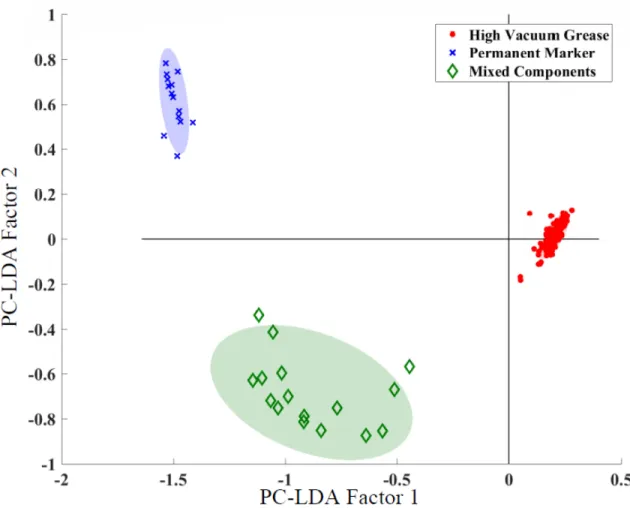
Figure 7. Exploratory 2D PC-LDA score plot of noise-filtered and baseline-corrected acquired data 95% confidence intervals as shaded areas.
(OTR = 0.19) data acquisition in experimental cases where domain knowledge is either limited or unavailable.
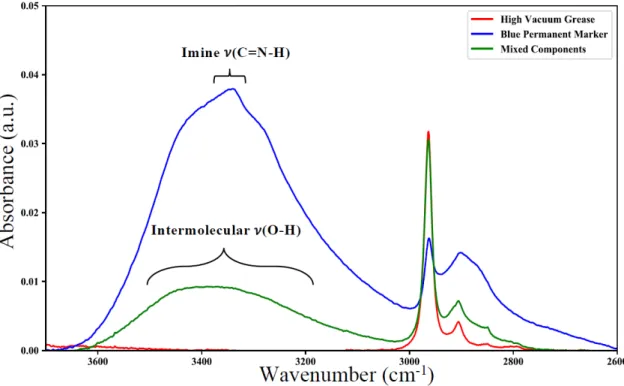
To verify that our acquired adaptive LIV data is interpretable through multivariate analysis from an experimenter’s standpoint, we performed principal component analysis (PCA) followed by linear discriminant analysis (LDA)[22] on the noise-removed IR data to discriminate between the permanent marker and high vacuum grease present in the spatiochemical map (Figure 7). We see that the first PC-LDA factor distinguishes between permanent ink-containing spectral regions and pure high vacuum grease, while the second PC-LDA factor separates between pure permanent ink and regions containing both permanent ink and high vacuum grease. This conclusion is further supported by the mean spectra plotted per cluster (Figure 8); we see the imine ν(C=N-H) from 3400 cm−1 to 3300 cm−1 and intermolecular hydrogen-bonded ν(O-H) at 3550 cm−1 and 3230 cm−1
Figure 8. Globar FTIR spectral mean of each identified PC-LDA cluster showing the peak identifications used to corroborate chemical identity of high vacuum grease (red), permanent marker (blue), and mixed components (green).
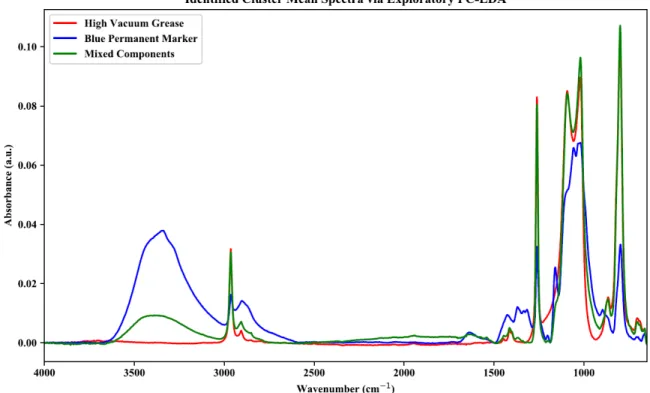
contributions[19] from permanent ink’s pigment compounds and alcohols, respectively. The identified high vacuum grease cluster matches the standard mean spectra expectations with vibrational silence in frequencies >3000 cm−1, while peak broadening and the change in peak ratio between the imine and intermolecular hydrogen bonding regions of the permanent ink and mixed component clusters suggest that permanent ink alcohols experienced inhibited evaporation in the mixed component regions due to the ink’s deposition under the high vacuum grease during sample preparation (Figure 9).
For our proof-of-principle bioimaging case, we applied scanning broadband SR- FTIR spectromicroscopy to overcome signal-to-noise limitations when characterizing a young L2 C. elegans animal. C. elegans are well characterized in genetics, microscopy, and omics-related fields while also representing a large, whole-organism experimental model
Figure 9. Full spectral region for identified cluster mean spectra of baseline-corrected cluster spectra. Spectra were not normalized in order to conserve concentration information.
containing known compartmentalized chemistry. Relative to the diffraction-limited spatial resolution (2–10 μm) of scanning SR-FTIR spectromicroscopy, their large size of 100 μm to 1 mm in length when coupled with current mapping region software restrictions often lead to temporally inefficient spatiochemical mapping of unfixed samples. With our implemented graphical user interface at ALS Beamline 1.4.3 (Lawrence Berkeley National Laboratory, Berkeley, CA), we were able to apply domain knowledge in spatial and spectral restrictions to better optimize our adaptive data acquisition of C. elegans (Figure 10) for comparison
Figure 10. Adaptive LIV data acquisition of an early-stage L2 C. elegans over a spatial map defined with domain knowledge to include the pharyngeal, nerve ring, and intestinal regions of the animal.
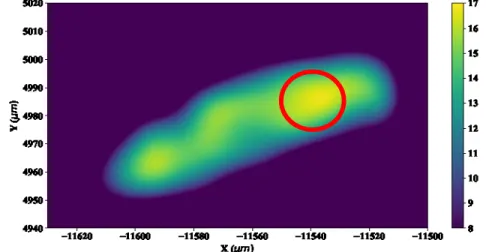
Figure 11. Density plot of sampled areas from adaptive LIV sampling for ease of more frequently sampled regions (red circle).
against the high-spatial (step-size 1.5 μm) resolution map of the same sample. We found that increased adaptive LIV sampling in the spatial domain (Figure 11) identified regions characterized by chemistries consistent with those of known anatomical features. Sampling increased in either transitional or overlapping anatomical regions between pharyngeal, head,
Figure 12. Coefficient heat maps of MCR component 1 (intensity range: 0.00–5.08), MCR component 4 (intensity range: 0.00–1.13), and the overlaid RG coefficient maps of both MCR components 1 and 4. Red cursor indicates same pixel; red circle indicates same region of dense sampling shown in Figure 11 (scale bar, 10 μm).
Figure 13. Loading vectors for MCR components 1 (blue) and 4 (red) over evaluated frequency domain of 3500 cm−1 to 2800 cm−1. Vibrational stretching assignments are labeled as discussed in the main text and Figure 14.
neck, and body wall muscle[23], regions of the nerve ring[24], and the lipid-rich intestine[25]. Our qualitative post validation of adaptive data acquisition using multivariate curve resolution[26] (MCR) and Fourier self-deconvolution[27] (FSD) SR-FTIR analyses further confirmed these anatomical co-localization results with reliable MCR components[28] 1 and 4 (Figure 12) corresponding to hydrated proteins (amino acid ν(N-H) stretching modes)[19] and hydrated lipid assemblies (N-H, O-H, methyl, and ν(-(CH2)n-)
Figure 14. FSD plots of the 3000 cm-1 to 2900 cm-1 spectral region for MCR components 1 and 4 for accurate peak identification in a high signal-to-noise region of C-H stretching vibrations. To be conservative, we only used major peaks to support assignments and co- localization with chemistry of known anatomical structures. For component 4, we referenced the asymmetric stretching mode of characterized lipid methyl groups (~2963 cm-1) and lipid antisymmetric stretching -(CH2)n- modes (2916 cm-1 – 2936 cm-1). For component 1, we referenced the asymmetric stretching -(CH2)n- mode of characterized biological polyglycines (~2925 cm-1). Plotted in OMNIC 9.8.
stretching modes)[19, 29], respectively (Figure 13 and Figure 14). With these two components overlapping in the more frequently sampled region, we verify that adaptive LIV data acquisition helps resolve spatiochemical gradients in a complex whole-organism model.
Discussion
We constructed and implemented grid-less adaptive LIV data acquisition to address a key challenge in the hyperspectral imaging of time-sensitive systems. Specifically, we decrease image acquisition time while improving sampling density in regions of increased spatiochemical complexity. Using this sampling strategy, we non-destructively explore the chemistry of anatomical features in living C. elegans. We observe that increased sampling density corresponded with known anatomical features, and these results serve as a proof-of- principle for the use of AADA on a complex, biological specimen.
In this study, all experimental LIV-based AADA cases were performed on standard hardware found with commercial high-dimensional imaging microscope designs, revealing the accessibility and computational efficiency of the algorithm for a broadened use in imaging techniques that require a sequential exploration of space, such as scanning probe techniques. We show that LIV-based AADA can operate efficiently and effectively under conditions where the map area is unconstrained, and therefore, when the main goal of a study is to characterize a system through a discovery approach. This performance implies that LIV- based AADA will still benefit an experimentalist who has a detectable, discovery aspect of their research in otherwise well-characterized biological systems that can range from single living cells to, in the case of smaller animal models like C. elegans, whole organisms. We also report that LIV-based adaptive sampling outperforms standard sampling methodologies in complex biological systems in which we apply domain knowledge to restrict mapping
regions. When specifically referencing instrument time usage to spatiochemically image the young L2 C. elegans experimental case, we were able to map the head region in 45 min with the LIV-based AADA software in comparison to ~4.9 h with the commercially available software. Lastly, we find that LIV-based AADA provides more comprehensive spatiochemical understanding of the total map domain at any given time interval in comparison to the established and standard UG sampling (Figure 15), suggesting that this aspect can be harnessed for further development of AADA to achieve adaptive high- dimensional real-time, non-invasive, label-free imaging through modular additions to the sampling algorithm.
Figure 15. Standard UG sampling compared with LIV sampling over a tightly bound, pharyngeal mapping region of late-stage L1 C. elegans (scale bar, 10 μm) per given time interval as defined by ordered, sample point domain. The first three principal components are displayed as RGB false color composites.
This advance in hyperspectral imaging offers the biological community an orthogonal perspective into the dynamic physico-chemical architectures of studied tissues and model organisms. Critically, this information can potentially guide an investigator towards time-points and regions of interest for follow-up omics characterization, which is important in but not limited to the areas of carcinogenesis and developmental biology.
Particularly in cases of discovery-based experimental design, AADA enables unbiased assessment of spatially resolved chemical changes between biological samples that differ by genotype, drug treatment or substance exposure, and physiological state such as age. More broadly, LIV-based AADA can be applied to fields outside of biology, such as hyperspectral remote sensing and space exploration. In these cases, future development towards real-time AADA will enable rapid identification, characterization, and even surveillance of chemical spills, toxic algal bloom formation, and spontaneous solar events.
Methods
Autonomous adaptive sampling. Our adaptive sampling workflow is based upon LOOCV
and begins with an initial scan of randomly distributed points. Using PCA for dimensionality reduction and our IR preprocessing module for frequency domain restriction and rubber- band baseline correction, we increased computational and temporal efficiency by calculating and operating over the first 5 principal components during our proof-of-principle, temporally intensive, high-dimensional data acquisition. A model 𝑈𝑈0 based upon 2D barycentric linear interpolation (LIV) is constructed from this processed data set. We quantify the sensitivity of the surrogate model to the removal of an individual data point through the ϵLOO. By removing a single point 𝑋𝑋𝑖𝑖, model 𝑈𝑈−𝑖𝑖 is rebuilt using the incomplete data set. The ϵLOO associated with the sample point is the difference between the two models evaluated at the
removed point δ(U0(X𝑖𝑖), U−𝑖𝑖(X𝑖𝑖)) with respect to the 𝐿𝐿2 norm[30]. After this is iterated for every sampled point in the acquired data set, the region defined by the sampled point with highest ϵLOO is sampled next by picking a random point within that region. This procedure is repeated until a set criterion is reached, which in our case was 500 total sampled points.
To assess algorithm sampling performance, we aggregate the ϵLOO of all sample points in the acquired data set and quantify the self-consistency using established LOOCV[31]. We take the mean ϵLOO, ⟨ϵLOO⟩V, of all sample points in the data set and use it as an unbiased, quantitative measure of the model accuracy due to theoretical guarantees of
⟨ϵLOO⟩V convergence to a model’s generalization error[32]. Since acquired points are often neither regularly nor uniformly distributed in the case of adaptive sampling, we partition the region into a collection of cells {𝑉𝑉𝑖𝑖} containing positions closest to each point {𝑋𝑋𝑖𝑖}. The mean is then weighted by the associated Voronoi area of sample point {𝑋𝑋𝑖𝑖}. Explicitly, we define
⟨𝜖𝜖𝐿𝐿𝐿𝐿𝐿𝐿⟩𝑉𝑉 = ∑𝑖𝑖|𝑉𝑉∑𝑖𝑖|⋅𝜖𝜖𝐿𝐿𝐿𝐿𝐿𝐿,𝑖𝑖
𝑖𝑖|𝑉𝑉𝑖𝑖| .
With the LOOCV adaptive sampling procedure, we follow the heuristic for ⟨ϵLOO⟩V minimization, and thus, effectively achieve minimization of model generalization error by sampling near the point with the largest ϵLOO. This section includes materials provided by co- author Yuan-Sheng Fang (Department of Physics, UC Berkeley) that were modified for the related publication.
Surrogate modeling. We use the scipy.interpolate.griddata method from the Python Scipy
package to implement 2D barycentric linear interpolation and treat each PCA component independently. Although it is computationally efficient, it does not quantify uncertainty in error estimate. To address this, we include the Voronoi area associated with each point into our calculated ϵLOO by treating it as an ad hoc regularizer. For a collection of points X =
{x𝑖𝑖 ∈ ℝ𝑑𝑑}, the Voronoi cell that we associate with point 𝑥𝑥𝑖𝑖 is the region of space containing positions in Euclidean distance closest to 𝑥𝑥𝑖𝑖:
𝑉𝑉𝑖𝑖 = {𝑢𝑢 ∈ ℝ𝑑𝑑:�|𝑥𝑥𝑖𝑖− 𝒖𝒖|�2 <��𝑥𝑥𝑗𝑗− 𝒖𝒖��
2∀𝑗𝑗 ≠ 𝑖𝑖}⊂ ℝ𝑑𝑑.
The Voronoi area is the area of the set, 𝑉𝑉𝑖𝑖 = ||𝑉𝑉𝑖𝑖||. This implies that if point 𝑥𝑥𝑖𝑖 is spatially isolated from the rest of the data set, then point 𝑥𝑥𝑖𝑖 will be associated with a greater Voronoi area. By approximating the error uncertainty using the Voronoi area, we utilize the fact that linear interpolation error tends to increase with larger distances from points used in the interpolation. To achieve this, we first normalize both ϵLOO and 𝑉𝑉𝑖𝑖 in order to compare both quantities using a linear scaling from [0, 1]:
𝜎𝜎(𝑋𝑋𝑖𝑖) =max(𝑋𝑋)−min(𝑋𝑋)𝑋𝑋𝑖𝑖−min(𝑋𝑋) . Next, we take the regularized LIV ϵLOO to be
𝜖𝜖𝐿𝐿𝐿𝐿𝐿𝐿,𝑖𝑖(𝐿𝐿𝐿𝐿𝑉𝑉) =𝜎𝜎�𝜖𝜖𝐿𝐿𝐿𝐿𝐿𝐿,𝑖𝑖�+𝜎𝜎(𝑉𝑉𝑖𝑖),
which is used to calculate our adjusted ϵLOO for our adaptive data acquisition in simulations and experiments[33]. Our approach is inspired by and related to the LOLA-Voronoi and CV- Voronoi surrogate modeling techniques[11, 14]. This section includes materials provided by co-author Yuan-Sheng Fang (Department of Physics, UC Berkeley) that were modified for the related publication.
Sample preparation. All samples were mounted on 0.5-mm-thick ZnSe crystals, which were
cleaned with Milli-Q water, 5% acetic acid, acetone, then Milli-Q water sequentially in order to remove organics while minimizing crystal damage. The two-component control sample was prepared with high vacuum grease (2021854-1993, Dow Corning) that was lightly applied to a 0.5-mm-thick ZnSe crystal (CAS# 1315-09-9, International Crystal
Laboratories) in an area identifiable by fiducial markings drawn with a permanent marker (Item #37003, Sanford Ultra-Fine Blue Sharpie Permanent Marker). Spectral standards were acquired of both components independently prior to autonomous adaptive sample acquisition of abiotic two-component system. Spectral regions of component mixing could be identified by alcohol presence in the mixed spectra.
The first C. elegans (N2; Caenorhabditis Genetics Center) animal used for temporal exploratory LIV experiments was selected at the late L1 stage (based on morphology). The second animal for qualitative LIV assessment via FTIR spectral analysis was selected at the young L2 stage (based on morphology). Each animal was moved from their agar growth plates to 1 μL of 0.25 mM Levamisole (CAS# 16595-80-5, Sigma-Aldrich) on the ZnSe crystal and rinsed three times with Milli-Q water before mounting the sample onto the microscope stage for imaging.
Instrumentation. Scanning benchtop and synchrotron FTIR measurements were performed
on a Nicolet Nic-Plan IR microscope with a ×32, 0.65 numerical aperture objective with a Thermo Scientific Nicolet iS50 FTIR spectrometer using a KBr beamsplitter and MCT (HgCdTe) detector at Beamline 1.4.3 of the Advanced Light Source at Lawrence Berkeley National Laboratory. Adaptive sampling was implemented using a GUI (Supplementary Figure 6) developed in PyQt and installed on the Beamline 1.4.3 computer (Dell Optiplex 7050: 8 GB RAM, Intel Core i5-7500 CPU @ 3.41 GHz, Windows 10 64 bit). OMNIC 9.8 software by Thermo Fisher Scientific controlled the microscope and FTIR bench, and our software communicated with OMNIC through Dynamic Data Exchange to store the OMNIC background-subtracted spectral output into our software’s dataframe format.
In this study, we used two different infrared sources: an internal globar source and a synchrotron source. Although an internal globar source is readily available in commercial FTIR microscopes, an accelerator-based synchrotron source offers at least 1000 times improvement in brightness (photon counts per unit time per unit area) over the globar source[34] at the same spatial resolution. As a result, we used different total co-added scan and spatial resolutions for measurements performed on each instrument, which are detailed in the following sections.
Globar FTIR spectromicroscopy and multivariate analysis. Benchtop scanning FTIR
measurements using internal globar source were performed in transmission mode with an aperture-limited spatial resolution of 75 μm × 75 μm. IR spectra between 650 cm−1 and 4000 cm−1 at 4 cm−1 spectral resolution were collected with 16 co-added scans at a interferometer mirror velocity of 1.83 cm/s. Rubber-band baseline correction and dimensionality reduction via PCA to 5 components were performed over the entire collected spectral region during adaptive LIV data acquisition. For each experimental assessment of sampling method, the total sampled points were limited to 500 to remain below the full- resolution map of 840.
On-target ratio. We define the on-target ratio (OTR) to be the number of samples that meet the on-target criteria over the total number of sampled points. To determine the criteria by which a spectrum is considered on-target, we use our full-resolution data set and remove spectra close to the detection limitations of the instrument that violate the signal-to-noise filter criteria. Using this noise-removed subset of data, we calculate the mean spectra of the noise-removed subset. After identifying one major peak component per known component standard, we evaluated all acquired spectra per method for the presence of either
aforementioned peak above the threshold that we determined as the noise-removed mean intensity at defined frequencies to define OTR as
𝑂𝑂𝑂𝑂𝑂𝑂𝑚𝑚𝑚𝑚𝑚𝑚ℎ𝑜𝑜𝑑𝑑 =𝑁𝑁𝑁𝑁𝑎𝑎∨𝑏𝑏
𝑡𝑡𝑡𝑡𝑡𝑡𝑎𝑎𝑡𝑡,
where Na∨b is the number of spectra that met either the first mean peak criterion, second mean peak criterion, or both mean peak criteria, while Ntotal is the total number of spectra acquired using the referenced data acquisition method. Using this definition of spectral metric, we calculated 𝑂𝑂𝑂𝑂𝑂𝑂𝐿𝐿𝐿𝐿𝑉𝑉 = 474500 (0.95) and 𝑂𝑂𝑂𝑂𝑂𝑂𝑈𝑈𝑈𝑈 =50095 (0.19).
FTIR multivariate analysis. The control sample components (high vacuum grease and permanent marker) were evaluated individually as spectral standards. The data were baseline corrected and vector normalized using OMNIC 9.8, and the spectral mean was calculated over 8 spectra per standard. Referencing the normalized mean and variance spectra, we use domain knowledge to perform PCA over the frequency domains of 3600 cm−1to 2800 cm−1 and 1750 cm−1 to 1450 cm−1 simultaneously before applying LDA to maximize interclass variance over intraclass variance of our factors[22] of our baseline-corrected and vector- normalized data in MATLAB R2017a. 2D score plots were generated in which the nearness between classes indicates similarity, whereas distance implies dissimilarity. The final mean spectrum of each cluster is shown for spectral validation of vibrational modes, resulting in segregation of classes.
Synchrotron FTIR spectromicroscopy and multivariate analysis. Scanning SR-FTIR diffraction-limited (2–10 μm) spectra were collected in transmission mode between 650 and 4000 cm−1 at 4 cm−1 spectral resolution and recorded with 8 co-added scans at an interferometer mirror velocity of 6.3 cm/s. We restricted the spectral domain adaptive LIV
sampling workflow from 900 to 3700 cm−1 to avoid signal contamination from detectable synchrotron noise and to decrease sample morphology[17] baseline effects, respectively, on subsequent dimensionality reduction and error calculation steps. Rubber-band baseline correction and dimensionality reduction to 5 components was performed over the restricted spectral region between 900 cm−1 and 4000 cm−1 during adaptive LIV sampling. Using domain knowledge, we restricted our mapping region to the pharynx, nerve ring, and intestine[24] of our young L2 C. elegans to reduce off-target sampling with respect to C.
elegans for increased temporal efficiency in spatiochemical mapping.
SR-FTIR multivariate analysis. We restricted our analyzed MCR domain from 3500 cm−1 to 2800 cm−1 for reduction of morphological effects on the spectral baseline and for higher diffraction-limited spatial resolution, since the goal of MCR analysis was to qualitatively assess adaptive LIV data acquisition performance. Based upon the cumulative explained variance calculated by OMNIC 9.8 on our experimental data, we performed MCR analysis in OMNIC using 5 components in which 99.82% of data variance is explained. Guided by well-characterized C. elegans anatomy and chemistry, we identified reliable MCR components[28] that would strongly correlate with muscle and lipid assembly structures—
components 1 and 4. For better accuracy in peak identification on our MCR components, we applied FSD to the C-H vibrational region. Since our analysis region was restricted, we could only broadly state the presence of protein-related stretching vibrations of ν(N-H) from amino acids between 3390 cm−1 and 3260 cm−1[19] and polyglycine asymmetric CH2 stretching modes at ~2925 cm−1[19] (Figure 14) in MCR component 1. Similarly for MCR component 4 and in referencing characterized hydrated lipid assemblies, we found broad peak contributions from N-H and O-H stretching modes between 3400 cm−1 to 3100 cm−1[29],
lipid-relevant antisymmetric ν(-(CH2)n-) modes at ~2932 cm−1[29], and lipid-related methyl antisymmetric and symmetric stretching at 2963 cm−1 and 2873 cm−1[29], respectively.
Statistics and reproducibility. Each sample size, type, and statistical method applied is described in the relevant Method section. For the two-component model system, spectral standards for permanent ink and high vacuum grease were performed with sample replicates (n = 8). Infrared spectral data are available through the CaltechDATA repository (https://doi.org/10.22002/D1.1609)[35].
References
1. Liu, T.L., et al., Observing the cell in its native state: Imaging subcellular dynamics in multicellular organisms. Science, 2018. 360(6386).
2. Chalfie, M., et al., Green fluorescent protein as a marker for gene expression.
Science, 1994. 263: p. 802-805.
3. Giepmans, B.N., et al., The fluorescent toolbox for assessing protein location and function. Science, 2006. 312(5771): p. 217-24.
4. Bodenmiller, B., Multiplexed Epitope-Based Tissue Imaging for Discovery and Healthcare Applications. Cell Syst, 2016. 2(4): p. 225-38.
5. Choi, M., S.J. Kwok, and S.H. Yun, In vivo fluorescence microscopy: lessons from observing cell behavior in their native environment. Physiology (Bethesda), 2015.
30(1): p. 40-9.
6. Prahst, C., et al., Mouse retinal cell behaviour in space and time using light sheet fluorescence microscopy. Elife, 2020. 9.
7. Zhao, M., et al., Electrical signals control wound healing through
phosphatidylinositol-3-OH kinase-gamma and PTEN. Nature, 2006. 442(7101): p.
457-60.
8. Rohban, M.H., et al., Capturing single-cell heterogeneity via data fusion improves image-based profiling. Nat Commun, 2019. 10(1): p. 2082.
9. Asprey, S.P. and S. Macchietto, Designing robust optimal dynamic experiments.
Journal of Process Control, 2002. 12: p. 545-556.
10. Queipo, N.V., et al., Surrogate-based analysis and optimization. Progress in Aerospace Sciences, 2005. 41: p. 1-28.
11. Crombecq, K., et al. A novel sequential design strategy for global surrogate modeling. in 2009 Winter Simulation Conference (WSC). 2009.
12. Li, G., V. Aute, and S. Azarm, An accumulative error based adaptive design of experiments for offline metamodeling. Structural and Multidisciplinary
Optimization, 2010. 40.
13. Wang, C., et al., An evaluation of adaptive surrogate modeling based optimization with two benchmark problems. Environmental Modelling & Software, 2014. 60: p.
167-179.
14. Xu, S., et al., A Robust Error-Pursuing Sequential Sampling Approach for Global Metamodeling Based on Voronoi Diagram and Cross Validation. Journal of Mechanical Design, 2014. 136(7).
15. Singh, P., D. Deschrijver, and T. Dhaene, A balanced sequential design strategy for global surrogate modeling, in Simulation Conference (WSC), 2013 Winter. 2013, IEEE. p. 2172–2179.
16. Elisseeff, A., T. Evgeniou, and M. Pontil, Stability of randomized learning algorithms. Journal of Machine Learning Research, 2006. 6: p. 55-79.
17. Baker, M.J., et al., Using Fourier transform IR spectroscopy to analyze biological materials. Nature Protocols, 2014. 9(8): p. 1771-1791.
18. Lippincott, E.R., et al., Infrared studies on polymorphs of silicon dioxide and germanium dioxide. Journal of Research of the National Bureau of Standards, 1958.
61: p. 61-90.
19. Socrates, G. and G. Socrates, Infrared and Raman characteristic group frequencies : tables and charts. 3rd ed. 2001, Chichester ; New York: Wiley. xv, 347 p.
20. Awab, H., et al., Infrared spectroscopic technique for the forensic discrimination of marker pen inks. Malaysian Journal of Forensic Sciences, 2011. 2: p. 1-7.
21. Razavi, S., B.A. Tolson, and D.H. Burn, Review of surrogate modeling in water resources. Water Resources Research, 2012. 28.
22. Hu, P., et al., Metabolic phenotyping of the cyanobacterium Synechocystis 6803 engineered for production of alkanes and free fatty acids. Applied Energy, 2013.
102: p. 850-859.
23. Altun, Z.F. and D.H. Hall, Muscle system introduction, in WormAtlas. 2009.
24. Altun, Z.F. and D.H. Hall, Introduction to C. elegans anatomy, in WormAtlas.
2009.
25. Mak, H.Y., Lipid droplets as fat storage organelles in Caenorhabditis elegans.
Journal of Lipid Research, 2012. 53(1): p. 28-33.
26. Felten, J., et al., Vibrational spectroscopic image analysis of biological material using multivariate curve resolution–alternating least squares (MCR-ALS). Nature Protocols, 2015. 10(2): p. 217-240.
27. Tooke, P.B., Fourier self-deconvolution in IR spectroscopy. Trends in Analytical Chemistry, 1988. 7(4): p. 130-136.
28. Motegi, H., et al., Identification of Reliable Components in Multivariate Curve Resolution-Alternating Least Squares (MCR-ALS): a Data-Driven Approach across Metabolic Processes. Scientific Reports, 2015. 5(1): p. 15710.
29. Infrared Spectroscopy of Biomolecules. 1995: Wiley-Liss.
30. Ramirez-Lopez, L., et al., Distance and similarity-search metrics for use with soil vis–NIR spectra. Geoderma, 2013. 199: p. 43-53.
31. Cawley, G.C. and N.L.C. Talbot, Efficient leave-one-out cross-validation of kernel fisher discriminant classifiers. Pattern Recognition, 2003. 36(11): p. 2585-2592.
32. Kearns, M. and D. Ron, Algorithmic Stability and Sanity-Check Bounds for Leave- One-Out Cross-Validation. Neural Computation, 1999. 11(6): p. 1427-1453.
33. Bandler, J.W., et al., Space mapping: the state of the art. IEEE Transactions on Microwave Theory and Techniques, 2004. 52(1): p. 337-361.
34. Holman, H.-Y.N., M.C. Martin, and W.R. McKinney, Tracking Chemical Changes in a Live Cell: Biomedical Applications of SR-FTIR Spectromicroscopy.
Spectroscopy, 2003. 17: p. 486940.
35. Holman, E.A., Dataset for Autonomous Adaptive Data Acquisition (AADA). 2020:
CaltechDATA.
C h a p t e r 4
TEMPORARILY REDACTED
Appendices A through C are temporarily redacted, as part of temporary redaction of chapters 2 and 4.