OXYGEN ISOTOPES AND VOLATILES IN MARTIAN METEORITES
Thesis by Melanie Beth Channon
In Partial Fulfillment of the Requirements for the Degree of
Doctor of Philosophy
CALIFORNIA INSTITUTE OF TECHNOLOGY Pasadena, California
2013
(Defended October 22, 2012)
© 2013 Melanie B. Channon
All Rights Reserved
ACKNOWLEDGEMENTS
I would like to thank my dear husband Mike Newman for introducing me to the world of academia and supporting me the entire way through my undergraduate and graduate studies, with much sacrifice to himself, including taking the hardest bar exam in the country, working at a miserable job for two years, and living long distance for three years.
If we survived all this, we can survive anything.
I would like to thank my advisers John Eiler and Ed Stolper for accepting me as a student, believing in me, and never making me feel like I was not meant to be in graduate school at Caltech. It should also go without saying (although it won’t) that their guidance has made me a much better scientist. I am honored to have been advised by such brilliant minds.
I would like to thank George Rossman, Paul Asimow, and Ken Farley for always having an open door policy with me and being so willing and excited to talk about science.
I would like to thank Jeremy Boyce, John Beckett, and Mike Baker for not only their invaluable advice and insightful discussions about science, but also for their genuine friendship and reminders that great science is balanced by great recreation.
I would like to thank Magalie Bonifacie, Lindsey Hedges, Nami Kitchen, Marion Le Voyer, Ma Chi, and Yunbin Guan for their vital roles in my development of skills in the laboratory and in using analytical instruments.
Last but not least, I would like to thank my dear friend June Wicks for her endless encouragement and her irreplaceable friendship.
ABSTRACT
Oxygen isotopes were measured in mineral separates from martian meteorites using laser fluorination and were found to be remarkably uniform in both δ18O and Δ17O, suggesting that martian magmas did not assimilate aqueously altered crust regardless of any other geochemical variations.
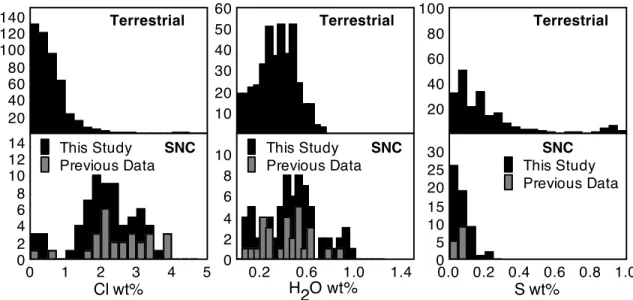
Measurements of Cl, F, H, and S in apatite from martian meteorites were made using the SIMS and NanoSIMS. Martian apatites are typically higher in Cl than terrestrial apatites from mafic and ultramafic rocks, signifying that Mars is inherently higher in Cl than Earth.
Apatites from basaltic and olivine-phyric shergottites are as high in water as any terrestrial apatite from mafic and utramafic rocks, implying the possibility that martian magmas may be more similar in water abundance to terrestrial magmas than previously thought. Apatites from lherzolitic shergottites, nakhlites, chassignites, and ALH 84001 (all of which are cumulate rocks) are all lower in water than the basaltic and olivine-phyric shergottites, indicating that the slow-cooling accumulation process allows escape of water from trapped melts where apatite later formed. Sulfur is only high in some apatites from basaltic and olivine-phyric shergottites and low in all other SNCs from this study, which could mean that cumulate SNCs are low in all volatiles and that there are other controlling factors in basaltic and olivine-phyric magmas dictating the inclusion of sulfur into apatite.
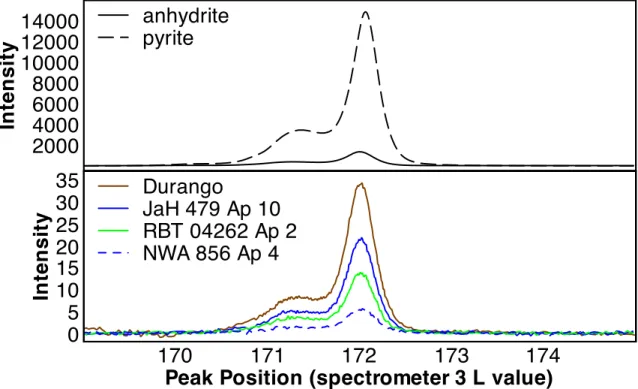
Sulfur Kα X-rays were measured in SNC apatites using the electron probe. None of the peaks in the SNC spectra reside in the same position as anhydrite (where sulfur is 100%
sulfate) or pyrite (where sulfur is 100% sulfide), but instead all SNC spectra peaks lie in between these two end member peaks, which implies that SNC apatites may be substituting
some sulfide, as well as sulfate, into their structure. However, further work is needed to verify this hypothesis.
TABLE OF CONTENTS
List of Figures and Tables ... viii
Introduction: Mars and Martian Meteorites ... 1
Chapter I: Oxygen Isotope Compositions of Mineral Separates from SNC Meteorites: Constraints on the Origin and Evolution of Martian Magmas ... 4
Introduction ... 4
Previous Studies ... 10
Values of δ18O ... 10
Values of Δ17O ... 11
Sample Materials, Preparation, and Analytical Techniques ... 13
Results ... 16
Discussion ... 19
Cleaning Study ... 19
Measurements of δ18O ... 22
Comparison of the Present Study with Previous Data ... 23
Shergottites ... 29
DaG 476 Olivine and NWA 4468 Maskelynite ... 32
Nakhlites, Chassignite, and ALH 84001 ... 34
Measurements of Δ17O ... 35
Conclusions ... 39
Chapter II: Abundance of Cl, F, H, and S in Apatites from SNC Meteorites ... 42
Introduction ... 42
Materials and Methods ... 45
Results ... 48
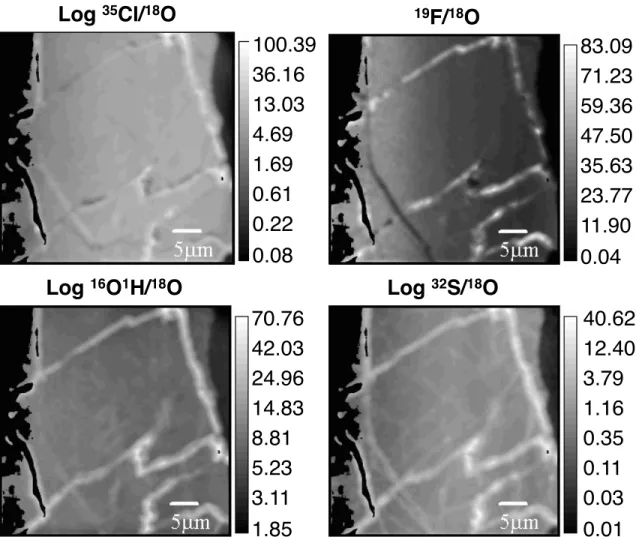
NanoSIMS Images ... 48
SNC Apatite Spot Analyses ... 50
Discussion ... 62
H2O Contamination ... 62
H2O versus Rock Type ... 70
Sulfur ... 74
Summary/Conclusions ... 77
Chapter III: Speciation of Sulfur in Apatites from SNC Meteorites ... 78
Introduction ... 78
Materials and Methods ... 79
Data Reduction ... 81
Results ... 81
Discussion ... 92
Sulfur Speciation ... 92
Sulfur Concentrations ... 96
Conclusions ... 98
Bibliography ... 101
Appendix A: Raw Data for Chapter I ... 122
Appendix B: Raw Data and Calibration Curves for Chapter II ... 130
Appendix C: Supplementary Data, Spectra, and Calibration Curves for Chapter III ... 162
LIST OF FIGURES AND TABLES
Page
Figure 1.1. Previous δ18O studies of SNCs ... 9
Table 1.1. Oxygen isotope data of SNC mineral separates from this study ... 17
Table 1.2. Oxygen isotope data on mineral separates from the cleaning experiment ... 23
Figure 1.2. Measurements of δ18O of SNC mineral separates from this study ... 24
Figure 1.3. Histogram of Δ17O measurements of SNC mineral separates from this study ... 25
Figure 1.4. Comparison of δ18O SNC mineral separates from this study with theoretically and experimentally predicted δ18O of coexisting minerals at equilibrium and terrestrial samples ... 26
Figure 1.5. Comparisons of δ18O measurements of SNCs from this study to those from other laboratories ... 27
Figure 1.6. Comparisons of Δ17O measurements of SNCs form this study to those from other laboratories ... 36
Figure 2.1. Composition of SNC apatites compared to terrestrial apatites ... 44
Figure 2.2. NanoSIMS images of apatite 2 from shergottite JaH 479 ... 49
Figure 2.3. NanoSIMS images of apatite 6 from shergottite JaH 479 ... 50
Figure 2.4. NanoSIMS images of apatite 7 from shergottite JaH 479 ... 51
Figure 2.5. NanoSIMS images of apatite 4 from shergottite NWA 6710 ... 52
Figure 2.6. NanoSIMS images of olivine from shergottite NWA 6710 ... 53 Figure 2.7. NanoSIMS images of pyroxene from shergottite NWA 6710 ... 54 Figure 2.8. NanoSIMS images of maskelynite from shergottite NWA
6710 ... 55 Figure 2.9. NanoSIMS images of apatite 1 from shergottite Dhofar 019 ... 56 Figure 2.10. NanoSIMS images of pyroxene from shergottite Dhofar 019 ... 57 Table 2.1. Measurements of Cl, F, H2O, and S in SNC apatites from this
study ... 58 Table 2.2. Measurements of H2O in SNC and terrestrial olivines from this
study ... 60 Figure 2.11. Abundance of chlorine in apatites from SNCs ... 62 Figure 2.12. Abundance of H2O in apatites from SNCs ... 63 Figure 2.13. Abundance of H2O in apatites and olivines from SNCs and
terrestrial samples ... 64 Figure 2.14. Ternary diagram for the composition of apatite in SNCs and
terrestrial samples ... 65 Figure 2.15. Abundance of sulfur in apatites from SNCs ... 66 Figure 2.16. Calibration curves for OH in apatite and olivine ... 68 Figure 2.17. Hydrogen versus carbon for measurements made in this study .. 70 Figure 2.18. Composition of SNC apatites compared to terrestrial apatites .... 74 Figure 2.19. NanoSIMS and back-scattered electron images of apatite 7
from shergottite JaH 479 ... 75
Table 3.1. Peak positions of sulfur X-rays and the estimated percent of sulfide in apatites from session 1 ... 82 Table 3.2. Peak positions of sulfur X-rays and the estimated percent of
sulfide in apatites form session 2 ... 82 Table 3.3. Peak positions of sulfur X-rays and the estimated percent of
sulfide in apatites from session 3 ... 83 Figure 3.1. Spectra of terrestrial standards for each analytical session ... 84 Figure 3.2. Percent of sulfur estimated to be sulfide for all apatites
measured in this study ... 87 Figure 3.3. Sulfur X-ray peak positions for all measurements from this
study for spectrometer 3 ... 88 Figure 3.4. Spectra of apatites from shergottite JaH 479 on spectrometer 3 ... 89 Figure 3.5. Spectra of apatites from shergottite NWA 856 on spectrometer
3 ... 91 Figure 3.6. Spectra of apatites from shergottite NWA 2986 on
spectrometer 3 ... 92 Figure 3.7. Spectra of apatites from shergottite Shergotty on spectrometer
3 ... 93 Figure 3.8. Spectra of apatites from shergottite RBT 04262 on
spectrometer 3 ... 94 Figure 3.9. Spectra of apatites from shergottite NWA 1950 on
spectrometer 3 ... 95 Figure 3.10. Example of varying spectral intensities ... 96
Table 3.4. Estimated intensities of sulfur X-rays and sulfur abundances ... 97
Figure 3.11. Peak intensity versus S abundance for spectrometer 3 in session 1 ... 98
Table 3.5. Calculated concentrations from this study ... 99
Table A.1. Raw data from all Delta sessions ... 123
Table A.2. Raw data from all MAT 252 sessions ... 128
Table B.1. Raw data from the SIMS session ... 131
Figure B.1. Calibration curve for OH during the SIMS session ... 135
Figure B.2. Calibration curve for Cl during the SIMS session ... 135
Figure B.3. Calibration curve for F during the SIMS session ... 136
Figure B.4. Calibration curve for S during the SIMS session ... 136
Table B.2. Raw data from the June 2011 NanoSIMS session ... 137
Figure B.5. Calibration curve for OH during the June 2011 NanoSIMS session ... 140
Figure B.6. Calibration curve for Cl during the June 2011 NanoSIMS session ... 140
Figure B.7. Calibration curve for F during the June 2011 NanoSIMS session ... 141
Figure B.8. Calibration curve for S during the June 2011 NanoSIMS session ... 141
Table B.3. Raw data from the December 2011 NanoSIMS session ... 142
Figure B.9. Calibration curve for OH during the December 2011 NanoSIMS session ... 144
Figure B.10. Calibration curve for Cl during the December 2011 NanoSIMS session ... 144
Figure B.11. Calibration curve for F during the December 2011 NanoSIMS session ... 145
Figure B.12. Calibration curve for S during the December 2011 NanoSIMS session ... 145
Table B.4. Raw data from the February 2012 NanoSIMS session ... 146
Figure B.13. Calibration curve for OH during the February 2012 NanoSIMS session ... 149
Figure B.14. Calibration curve for Cl during the February 2012 NanoSIMS session ... 149
Figure B.15. Calibration curve for F during the February 2012 NanoSIMS session ... 150
Figure B.16. Calibration curve for S during the February 2012 NanoSIMS session ... 150
Table B.5. Raw data from the May 2012 NanoSIMS session ... 151
Figure B.17. Calibration curve for OH in apatite during the May 2012 NanoSIMS session ... 155
Figure B.18. Calibration curve for OH in olivine during the May 2012 NanoSIMS session ... 155
Table B.6. Raw data from the June 2012 NanoSIMS session ... 156
Figure B.19. Calibration curve for OH in apatite during the June 2012 NanoSIMS session ... 159
Figure B.20. Calibration curve for OH in olivine during the June 2012 NanoSIMS session ... 159
Figure B.21. Calibration curve for Cl in apatite during the June 2012 NanoSIMS session ... 160
Figure B.22. Calibration curve for F in apatite during the June 2012 NanoSIMS session ... 160
Figure B.23. Calibration curve for S in apatite during the June 2012 NanoSIMS session ... 161
Table C.1. Analyses from session 1 that were removed ... 162
Figure C.1. Spectra of apatites from shergottite JaH 479 on spectrometer 1 ... 163
Figure C.2. Spectra of apatites from shergottite JaH 479 on spectrometer 2 ... 164
Figure C.3. Spectra of apatites from shergottite JaH 479 on spectrometer 5 ... 166
Figure C.4. Spectra of apatites from shergottite NWA 856 on spectrometer 1 ... 167
Figure C.5. Spectra of apatites from shergottite NWA 856 on spectrometer 2 ... 168
Figure C.6. Spectra of apatites from shergottite NWA 856 on spectrometer 5 ... 169
Figure C.7. Spectra of apatites from shergottite NWA 2986 on spectrometer 1 ... 170
Figure C.8. Spectra of apatites from shergottite NWA 2986 on spectrometer 2 ... 171
Figure C.9. Spectra of apatites from shergottite NWA 2986 on spectrometer 5 ... 172
Figure C.10. Spectra of apatites from shergottite Shergotty on spectrometer 1 ... 173
Figure C.11. Spectra of apatites from shergottite Shergotty on spectrometer 2 ... 173
Figure C.12. Spectra of apatites from shergottite Shergotty on spectrometer 5 ... 174
Figure C.13. Spectra of apatites from shergottite RBT 04262 on spectrometer 2 ... 174
Figure C.14. Spectra of apatites from shergottite RBT 04262 on spectrometer 5 ... 175
Figure C.15. Spectra of apatites from shergottite NWA 1950 on spectrometer 1 ... 175
Figure C.16. Spectra of apatites from shergottite NWA 1950 on spectrometer 2 ... 176
Figure C.17. Spectra of apatites from shergottite NWA 1950 on spectrometer 5 ... 176
Figure C.18. Peak intensity versus S abundance for spectrometer 2 in session 1 ... 177
Figure C.19. Peak intensity versus S abundance for spectrometer 5 in session 1 ... 178
Figure C.20. Peak intensity versus S abundance for spectrometer 1 in session 2 ... 179
Figure C.21. Peak intensity versus S abundance for spectrometer 2 in session 2 ... 180
Figure C.22. Peak intensity versus S abundance for spectrometer 3 in session 2 ... 181
Figure C.23. Peak intensity versus S abundance for spectrometer 5 in session 2 ... 182
Table C.2. Calculated sulfur concentration data ... 183
I n t r o d u c t i o n
MARS AND MARTIAN METEORITES
Martian (SNC) meteorites are the only physical samples we have from the planet Mars.
They provide a valuable way to explore martian geochemistry as well as to test theoretical models and to corroborate observations and measurements made on Mars, either remotely from orbit or from ground-based landers and rovers. Some of the most impactful observations and measurements include liquid-carved (most likely water) geomorphological features on the martian surface (Carr 2012 and references therein);
spectra indicating the presence of carbonates, hematite, sulfates, halides, and phyllosilicates (Christensen et al. 2001; Squyres et al. 2004; Bibring et al. 2006; Ming et al. 2006;
Ehlmann et al. 2008; Mustard et al. 2008; Morris et al. 2010; Jensen and Glotch 2011), which are all produced in the presence of water; and a wealth of volatiles, some of which, such as chlorine and sulfur, appear to be more abundant on Mars than on Earth (Clark and Baird 1979; Dreibus and Wanke 1985, 1987; Haskin et al. 2005; King and McLennan 2010).
To date, there are 67 known martian meteorites, and they are petrographically grouped into six types of rocks: Basalts, olivine-phyric basalts, lherzolites (these first three are known as shergottites named after the type specimen Shergotty), clinopyroxenites (known as nakhlites named after the type specimen Nakhla), one orthopyroxenite (named ALH 84001), and dunites (known as chassignites named after the type specimen Chassigny).
They span a wide range of ages from 175 Ma to 4.1 Ga (Borg et al. 1997; Nyquist et al.
2001; Borg et al. 2003; Bouvier et al. 2005, 2008; Symes et al. 2008; Bouvier et al. 2009;
Nyquist et al. 2009; Park et al. 2009; Lapen et al. 2010), and are thought to come from various parts of the martian surface. Although some alteration materials and volatile elements have been found in the SNCs (Brdiges et al. 2001; Filiberto and Treiman 2009), they do not exhibit abundant evidence of martian magmas being wet. They do not contain nominally hydrous minerals or anomalously high volatiles like what is observed remotely.
The focus of my studies at Caltech has been to use indirect techniques to investigate the presence of water and volatiles that may have existed on the martian surface and in the magmas that generated these meteorites. Specifically, I measured oxygen isotopes in mineral separates from many of the martian meteorites to detect whether magmas had assimilated crust that had been aqueously altered. This would be evident by variation in oxygen isotopes between meteorites, and would contribute to remote observations that suggest past liquid water on the martian surface.
I also measured Cl, F, H, and S in apatite from these meteorites, in order to test for high water abundance as well as to assess whether they were uniformly high in Cl, and anomalously high in S, similar to soil measurements made by the Viking lander. Apatite is a retentive, igneous mineral that can stoichiometrically incorporate Cl, F, and/or OH in what is known as the X site of its atomic structure, and include S as a substitution trace element. High H abundance in apatite would confirm the presence of water in martian magmas, which has been more difficult to establish than the presence of water on the surface. High Cl and S in apatites would suggest that their high abundances on the surface
is because Mars is inherently high in volatiles rather than the result of surficial processes driving Cl and S to concentrate in particular areas on the surface.
Sulfur is a unique volatile compared to Cl, F, and H in that it can vary in its oxidation state depending on the oxygen fugacity of the magma that the apatite is generated from. Apatite is thought to accommodate sulfur strictly as sulfate groups replacing phosphate, but it is possible that sulfur might also substitute as sulfide on the X site. Measuring sulfur in apatite also gave me the opportunity to explore whether apatite in martian meteorites is harboring sulfur in both its oxidized and reduced states, as the range of oxygen fugacities estimated for martian magmas extend from conditions where both sulfate and sulfide exist in the magma to conditions where only sulfide exists. In either case, sulfur is a good potential tool to contribute to the estimation of oxygen fugacity in the magmas where these meteorites were produced.
C h a p t e r I
OXYGEN ISOTOPE COMPOSITIONS OF MINERAL SEPARATES FROM SNC METEORITES: CONSTRAINTS ON THE ORIGIN AND EVOLUTION OF
MARTIAN MAGMAS
Introduction
Martian (SNC) meteorites currently comprise 67 (unpaired) mafic and ultramafic igneous rocks that are classified as shergottites, nakhlites, chassignites, and ALH 84001. The shergottites are subdivided into three petrographic types (basaltic, olivine-phyric, and lherzolitic) that crystallized at 175 – 575 Ma (e.g., Nyquist et al. 2001; Borg et al. 2003;
Symes et al. 2008; Nyquist et al. 2009) or possibly 4.1 – 4.3 Ga (Bouvier et al. 2005, 2008, 2009). Nakhlites and chassignites are cumulates (clinopyroxenites and dunites, respectively) that formed at ca. 1.3 Ga (Nyquist et al. 2001; Bouvier et al. 2009; Park et al.
2009). ALH 84001 is an orthopyroxenite that formed at either 4.5 Ga (e.g., Nyquist et al.
2001) or 4.1 Ga (Bouvier et al. 2009; Lapen et al. 2010).
The shergottites have been subdivided into depleted, moderately depleted, and enriched groups based on their light rare earth element (LREE) to heavy rare earth element (HREE) ratios, with the depleted group having the lowest ratios and the enriched group having the highest ratios (e.g., Borg et al. 2002; Bridges and Warren 2006). The ratios of LREE to HREE in these meteorites are correlated with several radiogenic isotope ratios (e.g., positively with 87Sr/86Sr and negatively with 143Nd/144Nd) and with oxygen fugacity, which
increases by three log10 units from the depleted group to the enriched group (Wadhwa 2001; Herd, Borg, et al. 2002; Herd 2003; McCanta et al. 2004; Herd 2006). In addition, whole rock δ18O values of shergottites correlate positively with oxygen fugacity and enrichment (Herd 2003).
On Earth, δ18O values of mantle peridotites and primitive mafic magmas are generally similar, but they differ systematically from sedimentary, weathered, and hydrothermally altered components of the crust due to low-temperature fractionations between these crustal materials and coexisting water. The distinctive oxygen isotope ratios of crustal materials can influence the δ18O values of mantle-derived magmas either by mixing into the mantle sources of basalts via subduction or delamination or by assimilation as these magmas pass through the crust or altered mantle lithosphere (Taylor 1980; Eiler 2001 and references therein). These processes are known to occur on Earth, and they lead to ranges of up to ~5 per mil in the δ18O values of unaltered terrestrial igneous rocks and to correlations between δ18O values and other geochemical variables (e.g., Taylor 1980; Davidson et al. 2005).
These processes are sufficiently common that oxygen isotope measurements of a random sampling of several dozen terrestrial igneous rocks would likely make it obvious that the Earth’s crust is rich in sedimentary and aqueously altered materials. Based on this terrestrial analogy, a straightforward interpretation of the positive correlations between δ18O values, LREE/HREE ratios, and oxidation in the shergottites is that they reflect variable amounts of crustal assimilation into mantle-derived magmas; that is, the depleted shergottites reflect partial melts of martian mantle uncontaminated by altered crustal rocks, while the incompatible-element-enriched, oxidized shergottites crystallized from magmas
that either assimilated high-δ18O crustal rocks that had experienced aqueous alteration at low temperatures or mixed with partial melts of such crustal rocks.
There is considerable evidence that at least parts of the martian crust have been altered by exposure to liquid water: e.g., martian valley networks, outflow channels, gullies, deltas, etc. (Carr 2012 and references therein); the presence of carbonates, hematite, sulfates, halides, and phyllosilicates in the SNC meteorites (Bridges et al. 2001; McCubbin et al.
2009); and the identification of similar phases on the martian surface (e.g., Squyres et al.
2004; Ming et al. 2006; Morris et al. 2010), or by remote sensing (e.g., Christensen et al.
2001; Bibring et al. 2006; Ehlmann et al. 2008; Mustard et al. 2008; Jensen and Glotch 2011). Although the extent of these processes and their effects on the 18O/16O ratios of martian crustal rocks are unknown, if aqueous alteration has been widespread, it could also have modified the oxidation states of multivalent cations in the crust and thus could also explain the oxidation of enriched, relative to depleted, magmas. Interaction of mantle- derived magmas with altered crust could thus explain why enriched shergottites have elevated δ18O values relative to the depleted shergottites and that these values appear to correlate with trace element ratios, oxidation state, and radiogenic isotope ratios (Taylor 1980). Although current data are consistent with correlations expected for such an assimilative process when whole rock δ18O values are compared to oxygen fugacity and trace element ratios (Herd 2003), whole rock δ18O values of the shergottites do not necessarily correspond to those of the liquids from which they precipitated because many of these meteorites are cumulates (e.g., McSween 1994; Bridges and Warren 2006; Papike et al. 2009); i.e., they contain proportions of minerals that are not representative of the normative mineralogy of their parent magmas, and because igneous minerals differ from
one another in their mineral-melt oxygen isotope fractionations, it is likely that whole rock cumulates have δ18O values different from the liquids from which they precipitated (Eiler 2001 and references therein). Many of the SNCs also contain alteration phases (e.g., Bridges et al. 2001), which differ in δ18O from coexisting igneous minerals (Clayton and Mayeda 1983; Valley et al. 1997; Farquhar et al. 1998; Romanek et al. 1998). Acid leaching is a relatively common practice to remove (or at least test for the effects of) alteration phases prior to oxygen isotope analysis, but the effects of alteration on published whole rock δ18O values of SNC meteorites are difficult to evaluate because most authors did not report whether or not they performed acid leaching or other purification procedures.
In addition to studies of δ18O values in SNC meteorites, Δ17O values in the SNCs have been studied extensively, and indeed the systematic deviation of these meteorites from the terrestrial fractionation line was a critical factor in lumping the SNC meteorites (previously thought of as three separate groups of meteorites) into one group likely from a single parent body (Clayton and Mayeda 1983, 1996). A detailed investigation of Δ17O values in SNC whole rocks and mineral separates has detected variations that have been used to suggest the assimilation of near-surface alteration materials (Rumble and Irving 2009). However, interpretations of variability in Δ17O values in SNCs are difficult to connect quantitatively with inferences based on δ18O values, trace element ratios, or oxygen fugacity because observed variations in Δ17O have not yet been shown to correlate with other geochemical parameters.
The goal of the work reported here is to test previously proposed relationships between the SNC meteorites by constraining the δ18O and ∆17O values of mineral separates in the SNCs
(i.e., rather than basing these relationships on whole rock measurements). Although, as summarized above, there have been many previous measurements of these parameters for martian meteorites, and results from different laboratories differ beyond stated error bars (even for the same meteorite) with the result that the collective dataset of δ18O (for shergottites in particular) is variable and confusing (see figure 1.1 and the previous studies section below). Our work differs from previous studies by (1) analyzing mineral separates (i.e., pyroxene, olivine, and maskelynite) rather than whole rocks so as to constrain the δ18O values of the liquids from which cumulate phases crystallized (discussed below); (2) analyzing many of the known SNC meteorites in a single laboratory, thereby minimizing issues associated with interlaboratory comparisons that may account for some of the variability in currently available data; (3) utilizing recent analytical advances in laser fluorination techniques and extensively replicating analyses, thereby minimizing uncertainties in the measurements; and (4) attempting to evaluate the effects of alteration phases on measured oxygen isotope ratios through the use of various sample preparation protocols. We emphasize (1) in particular because the focus on mineral separates allows direct comparison between the same phase from different meteorites permits assessment of whether equilibrium has been achieved among coexisting phases in a single meteorite (Eiler 2001), and minimizes potentially confusing effects of variations in whole rock oxygen isotope ratios that would arise between a series of cogenetic cumulates that vary only in their phase proportions.
Overall, our goal is to address the question of whether the sources of enriched, oxidized shergottites differ in δ18O and ∆17O from those of depleted shergottites and thereby to address the possible role of aqueously altered crustal materials in their petrogenesis. The
key result is that we have been unable to confirm the correlation between δ18O of mineral separates and concentrations of incompatible elements or indexes of oxidation state that
3.5 4.0 4.5 5.0 5.5 6.0
Clayton and Mayeda (1996) Romanek et al. (1998) Franchi et al. (1999) Rumble and Irving (2009)
Basaltic Shergottites
Lherzolitic Shergottites
Olivine-Phyric Shergottites
Clinopyroxenites Dunite
Orthopyroxenite
δ18
OVSMOW Shergotty
Zagami EET 79001 B QUE 94201
NWA 2975/2986
NWA 4468 ALH A77005
EET 79001 A DaG 476
NWA 2046 Dho 019
Chassigny Lafayette Nakhla
ALH 84001 LEW 88516
Y 793605
Gov. Valadares Los Angeles
NWA 817 NWA 856
NWA 1110 NWA 1195
NWA 2626 NWA 2646 NWA 2800
NWA 3171 NWA 4480
NWA 4797 NWA 5029 NWA 5298 Dho 378
NWA 4925
Figure 1.1. Previous oxygen isotope studies.
previous workers have found based on whole rock δ18O analyses. Instead we have found uniformity in δ18O from the same minerals (and ∆17O from all phases) among the shergottites. We also measured nakhlites, a chassignite, and ALH 84001 to assess their oxygen isotopic compositions relative to the shergottites and previous whole rock analyses, and we found them to differ from the shergottites, but by much less than what has been suggested previously. Preliminary results of this study were reported in Channon et al.
(2009, 2010).
Previous Studies
Values of δ18O
Taylor et al. (1965) found negligible differences in δ18O of pyroxene separates between Shergotty, Lafayette, and Nakhla (a range of 0.2 per mil). Clayton and Mayeda (1996) found a whole rock standard deviation of 0.35 per mil (1σ; all errors reported hereafter are 1σ) among all the SNCs in their study, but attributed it to different modal abundances of major minerals in each meteorite and concluded that there is no isotopic evidence for crustal, water-dominated processes that affect the petrogenesis of these rocks. Romanek et al. (1998) and Franchi et al. (1999) observed ranges between meteorites in whole rock δ18O values similar to those observed by Clayton and Mayeda (1996), but in general, the three whole rock studies differ systematically by up to 0.4 per mil in the average value of their ranges (figure 1.1). Franchi et al. (1999) attributed these value discrepancies to different reference gas calibration methods by the three different laboratories (described below). A preliminary oxygen isotope study by Rumble and Irving (2009), performed at a different laboratory than any of the three previous whole rock studies, yields a similar range in
whole rock δ18O between meteorites, with values most closely resembling those of Clayton and Mayeda (1983). All other available δ18O data come from one of these laboratories or various others for the purpose of individual sample characterization and/or meteorite classification (Clayton and Mayeda 1983, 1986; Valley et al. 1997; Farquhar and Thiemens 2000; Rubin et al. 2000; Barrat, Gillet, et al. 2002; Gnos et al. 2002; Jambon et al. 2002;
Sautter et al. 2002; Taylor et al. 2002; Gillet et al. 2005; Beck et al. 2006; Treiman and Irving 2008). The combined dataset of all available δ18O measurements span a range of up to 2 per mil and do not form any trends with incompatible-element enrichment or oxygen fugacity.
Values of Δ17O
Several previous oxygen isotope analyses of the SNCs have had as their primary goal the measurement of 17O anomalies as a tool for meteorite categorization. Clayton and Mayeda (1996) demonstrated that the SNCs have a uniform ∆17O of 0.28 ± 0.07‰ (note that the standard deviation of 0.07‰ is comparable to the uncertainty for the conventional fluorination methods used in their study), suggesting that they all come from the same parent body. Romanek et al. (1998), using a laser fluorination method, reproduced six of these whole rock measurements and made measurements on mineral and alteration separates from Lafayette, Δ17O = 0.30 ± 0.06‰ (calculated from table 2 in Romanek et al.
1998). Franchi et al. (1999) generated a higher precision laser fluorination dataset with an even more tightly defined Δ17O value for martian igneous rocks of 0.32 ± 0.013‰ (n = 11).
They concluded that the larger variability in ∆17O observed in previous whole rock studies resulted from analytical uncertainty and that SNCs have no inherent differences in Δ17O
above laser fluorination uncertainty. However, since then, more SNCs have been discovered and analyzed in several different laboratories, largely for meteorite classification. All of these newer data sets exhibit the same ~0.3‰ average offset from the terrestrial fractionation line observed in previous data, but the standard deviation in Δ17O of the composite data set (61 meteorites) is comparable to that found in the initial studies of Clayton and Mayeda (1996) and Romanek et al. (1998) (i.e., ±0.05‰). The larger uncertainty of all data now available relative to the study of Franchi et al. (1999) could reflect poor interlaboratory precision or real variations in ∆17O among samples not considered by Franchi et al. (1999). Rumble and Irving (2009) addressed this issue by examining 22 SNCs using a laser fluorination technique similar to that used by Franchi et al. (1999), and they found an average Δ17O of 0.33 ± 0.04‰; the uncertainty is larger than the 0.01‰ uncertainty observed by Franchi et al. (1999), consistent with the notion that Franchi et al. (1999) analyzed a smaller set of samples that simply happened to be less variable. Moreover, Rumble and Irving (2009) also found significant variations between splits of the same meteorite (a range of 0.1‰ in NWA 856). They attempted to minimize the effects of terrestrial weathering as a source of this variability by acid washing their samples; they attribute sample-to-sample variability to different amounts of assimilation of crustal alteration phases by ascending magmas, and they attribute heterogeneity within a single meteorite to the lack of isotopic equilibration of the assimilated material within the magma.
Sample Materials, Preparation, and Analytical Techniques
Portions of 10 shergottites, 3 nakhlites, NWA 2737 (a chassignite), and ALH 84001 were crushed in air in a stainless steel mortar and pestle and sieved to separate out 200 – 500 µm grain-size fractions (a few samples with smaller crystal sizes were sieved to separate out a 100 – 500 µm grain-size fraction). This was followed by hand picking olivine (ol), pyroxene (px), and maskelynite (msk) separates under a binocular microscope. The purity of the separates is estimated to be >90% based on Raman spectroscopy and scanning electron microscopy (SEM). No effort was made to distinguish augite (aug), pigeonite (pig), and orthopyroxene (opx) during hand picking, and the pyroxenes in shergottites were therefore measured as mixtures. Pyroxene in nakhlites is primarily aug, and px in ALH 84001 is primarily opx.
Three terrestrial samples were analyzed in this study; UWG-2 garnet was used as the main standard (Valley et al. 1995), and ol and opx (enstatite) from a San Carlos lherzolite were monitored as internal, check standards and treated as unknown samples. John Valley provided the UWG-2 garnet, and the San Carlos lherzolite was obtained from the Geological and Planetary Science Division sample collection at the California Institute of Technology. For this study the lherzolite was crushed and sieved in the same manner as the meteorites, and ol and opx were separated by hand under an optical microscope.
Cleaning studies were performed on px (presumably mostly aug) separates from sample NWA 998, a highly altered nakhlite that has experienced both martian and terrestrial weathering (Treiman and Irving 2008), and less-altered opx from the San Carlos lherzolite as a terrestrial analogue. The San Carlos lherzolite contains both opx and cpx (Cr-diopside),
which were easily separated because the cpx is bright green. Aliquots of the hand-picked pyroxene separates from the 200 – 500 mm size fractions of both NWA 998 and San Carlos were washed in 2.5M HCl for 20 minutes at 90°C. A subset of these HCl-washed separates were additionally washed in 5% HF for 10 minutes at room temperature, rinsed with 2.5M HCl, and then rinsed with deionized H2O. All of the washed samples were dried in an oven prior to analysis.
All oxygen isotope measurements were performed at the California Institute of Technology by laser fluorination using a CO2 laser, BrF5 reagent, and a purification apparatus using cryogenic traps and a Hg-diffusion pump (Sharp 1990; Elsenheimer and Valley 1993). All samples were prefluorinated with BrF5 at room temperature for at least 12 hours to remove adsorbed water and trace surface contaminants prior to analysis.
For the Δ17O analyses, O2 released by fluorination was recovered first by adsorption onto a liquid-nitrogen-cooled 13X molecular sieve following the methods of Miller et al. (1999) and Wiechert et al. (2001). The liquid nitrogen trap was replaced by an ethanol – dry ice slush (similar to Clayton and Mayeda 1983) to keep fluorination by-products such as NF3
and CF4 trapped on the 13X molecular sieve while releasing O2. The released O2 was then adsorbed onto a liquid-nitrogen-cooled 5A molecular sieve inside a pyrex glass finger, after which the glass finger was isolated from the rest of the extraction line, and the O2 was released and measured with a Finnigan MAT 252 mass spectrometer. This method also gave δ18O analyses, but most δ18O measurements reported in this study were made by converting O2 to CO2 using a heated graphite rod based on designs by Sharp (1990) and
Elsenheimer and Valley (1993) rather than trapping it onto a liquid-nitrogen-cooled 13X molecular sieve, and analyzed by a ThermoFinnigan DeltaPLUS XL mass spectrometer.
A total of 17 measurements (two of which were for the cleaning study—one where the sample was leached only with HCl and the other with both HCl and HF) were made on 11 SNC meteorites during 8 separate sessions spread over an 11-month period using the O2
method for analysis on the MAT 252; a single MAT 252 session took one day and typically included 3 analyses of UWG-2 garnet, 1 analysis of either San Carlos ol or opx, and 2 SNC analyses. A total of 77 measurements on 15 SNC meteorites were made during 16 separate analytical sessions using the CO2 method for analysis on the Delta; a single Delta session lasted one day and typically included 6 analyses of UWG-2 garnet, 4 analyses of San Carlos ol and/or opx, and 5 meteorite analyses. Raw data for all sessions can be found in Appendix A. All measured δ18O values are reported using the VSMOW scale, and were standardized to UWG-2 garnet using the oxygen isotopic composition of δ18OVSMOW = 5.800‰ (Valley et al. 1995). All δ17OVSMOW values were standardized using UWG-2 = 3.046‰ (Spicuzza et al., 2007). We calculated Δ17O using equations and methods of Miller (2002), with a high-temperature silicate slope λ of 0.5259 (Spicuzza et al. 2007). Variation of UWG-2 garnet over the course of any one session was on average ±0.07‰ for δ18OVSMOW and ±0.03‰ for δ17OVSMOW. Over the course of this study δ18OVSMOW values of 5.23 ± 0.16‰ (n = 28) and 5.72 ± 0.11‰ (n = 34) were obtained for San Carlos ol and opx.
The San Carlos ol value is similar to 5.23 ± 0.15‰ (n = 11—from F2 fluorination) and 4.99
± 0.18‰ (n = 7—from BrF5 fluorination) reported by Rumble et al. (1997), and 5.26 ± 0.05‰ (n = 7) reported by Eiler et al. (1996). Both of these studies use similar UWG-2 garnet values. San Carlos opx is not typically used as a standard, so it is not compared to
other labs. However, the ~0.50‰ difference in δ18O between San Carlos ol and opx agrees with independent estimates of the equilibrium fractionation between these two phases at magmatic temperatures (Eiler 2001 and references therein). The San Carlos ol and opx gave Δ17Ovalues of 0.000 ± 0.019‰ (n = 8) and 0.003 ± 0.019‰ (n = 5) respectively.
Results
Oxygen isotope compositions of all SNC mineral separates measured in this study are presented in table 1.1. Errors in parentheses are standard error of the mean of all analyses for that phase per meteorite; all others are the standard deviation (1σ) of the UWG-2 garnet standard used during the same session. Analyses of δ18O yield similar results whether measured as CO2 on the DeltaPLUS XL or as O2 on the MAT 252. The cleaning study showed that there is little difference in δ18O of measurements of NWA 998 px whether the separates were unleached or leached using HCl or HF (table 1.2).
Measurements of δ18OVSMOW of ol in shergottites (with the exception of DaG 476) and chassignite NWA 2737 average to 4.36 ± 0.12‰ (table 1.1 and figure 1.2). The exception, ol from DaG 476, is ~1‰ higher; it is also higher than all SNC px and msk measurements
from this study. We discuss below the possibility that DaG 476 ol has undergone subsolidus alteration that modified its δ18O. Olivine in the nakhlites is 0.35‰ higher in δ18OVSMOW than ol in the shergottites and chassignite.
The average δ18OVSMOW of shergottite px’s is 4.71 ± 0.13‰. However, DaG 476, Dho 019, and SaU 005 are outliers at the higher end of the δ18O shergottite range; the px from these three meteorites have an average δ18OVSMOW value of 4.88 ± 0.09‰ (figure 1.2). Excluding
these three samples, the average δ18OVSMOW of shergottite px’s is 4.67 ± 0.10‰. The δ18OVSMOW of px in the nakhlites average to 4.87 ± 0.10‰; i.e., like the three anomalous shergottite px values, they are also ~0.2‰ higher than the mean value of the typical Meteorite phase δ17OVSMOW error δ18OVSMOW error Δ17O error
Shergotty pyoxene 4.81 0.09
4.79 0.03
* 2.75 0.02 4.66 0.03 0.306 0.015
Average 4.75 (0.05)
maskelynite 5.14 0.09
5.33 0.03 5.27 0.07
Average 5.25 (0.06)
Zagami pyroxene 4.65 0.12
4.58 0.07
* 2.74 0.01 4.60 0.02 0.323 0.010
Average 4.61 (0.02)
maskelynite 5.04 0.12
5.16 0.07
Average 5.10 (0.06)
NWA 2986 pyroxene 4.56 0.09
4.70 0.09
* 2.72 0.01 4.62 0.01 0.288 0.004
Average 4.63 (0.04)
maskelynite 5.16 0.09
5.10 0.09 5.43 0.07
Average 5.23 (0.10)
NWA 4468 pyroxene 4.61 0.12
4.75 0.11
* 2.86 0.01 4.82 0.01 0.327 0.004
Average 4.73 (0.06)
maskelynite 4.95 0.12
4.96 0.07
Average 4.96 (0.01)
*Measurements made using the O2 method on the MAT 252; all others were made using the CO2 method on the Delta. Methods are described in the sample materials Table 1.1. Data from this study obtained by CO2 and O2 analyses.
Basaltic Shergottites
preparation, and analytical techniques section.
shergottite px’s. The δ18OVSMOW of px in ALH 84001 is 5.02 ± 0.11‰, which is ~0.35‰
higher than the average of typical shergottite px and ~0.15‰ higher than nakhlite px.
Excluding msk from NWA 4468, shergottite msk has an average δ18OVSMOW = 5.20 ± 0.13‰ (table 1.1 and figure 1.2). Maskelynite from NWA 4468 is 0.15‰ lower than the others.
The average of the Δ17Oanalyses of SNC mineral separates is 0.313 ± 0.015‰ (table 1.1 and figure 1.3). Except for the Δ17O of HF-leached NWA 998 px, which is ~0.03‰ higher (figure 1.3) than HCl-leached and untreated NWA 998 px, there are no systematic variations within or between samples.
Meteorite phase δ17OVSMOW error δ18OVSMOW error Δ17O error
DaG 476 pyroxene 4.78 0.08
4.82 0.07 5.00 0.07
Average 4.87 (0.07)
olivine 5.38 0.11
5.32 0.07
Average 5.35 (0.03)
Dho 019 pyroxene 4.96 0.07
SaU 005 pyroxene 4.86 0.12
olivine 4.29 0.12
NWA 2046 pyroxene 4.76 0.06
4.58 0.08
Average 4.67 (0.09)
olivine 4.15 0.06
4.49 0.08 4.42 0.11
Average 4.35 (0.10)
Olivine/Pyroxene-Phyric Shergottites Table 1.1 continued.
*Measurements made using the O2 method on the MAT 252; all others were made using the CO2 method on the Delta. Methods are described in the sample materials preparation, and analytical techniques section.
Discussion
Cleaning Study
Pyroxene separates from NWA 998 typically have spots of red-orange stains or films on their surfaces. It was a concern that this contamination might contribute to the relatively high values of δ18O we observe for the nakhlites. However, after the leaching experiments (described above), visual inspection of the separates showed that HCl and HF baths had Meteorite phase δ17OVSMOW error δ18OVSMOW error Δ17O error
ALH A77005 pyroxene 4.77 0.07
4.49 0.11
Average 4.63 (0.14)
olivine 4.39 0.12
4.16 0.16 4.26 0.16 4.32 0.04 4.50 0.09
* 2.59 0.05 4.31 0.08 0.321 0.010
Average 4.32 (0.05)
NWA 1950 pyroxene 4.58 0.12
4.80 0.16 4.61 0.16 4.71 0.04
Average 4.68 (0.05)
olivine 4.41 0.12
4.46 0.16 4.50 0.09 4.33 0.04
* 2.59 0.06 4.39 0.15 0.287 0.024
* 2.57 0.01 4.29 0.03 0.321 0.020
Average 2.58 (0.01) 4.40 (0.03) 0.304 (0.017) Peridotitic ("Lherzolitic") Shergottites
Table 1.1 continued.
preparation, and analytical techniques section.
*Measurements made using the O2 method on the MAT 252; all others were made using the CO2 method on the Delta. Methods are described in the sample materials
removed the surface contamination (the appearance of San Carlos opx did not change—the surface appeared clean both before and after the experiments), and yet δ18O measurements remained the same (table 1.2—where all errors are 1σ of the UWG-2 garnet standard from that session) at a 95% confidence level using the Mann-Whitney U test. It is possible this is because BrF5 pretreatment removes the contaminant (i.e., leaching in acids prior to introduction to the laser fluorination sample chamber just removes constituents that would have been removed during pretreatment). Or, the surface impurities do not meaningfully contribute to the oxygen isotopic composition, either due to their low abundance or similarity in oxygen isotope composition to the mineral substrates. Measurements of Δ17O appear to be influenced by HF leaching, at least in the one sample on which this was Meteorite phase δ17OVSMOW error δ18OVSMOW error Δ17O error
Lafayette pyroxene 4.93 0.12
4.80 0.16 4.76 0.16 5.03 0.09
* 2.83 0.01 4.83 0.02 0.293 0.010
Average 4.87 (0.05)
olivine 4.51 0.16
4.92 0.09 4.69 0.04 4.83 0.09
Average 4.74 (0.09)
Nakhla pyroxene 5.00 0.03
4.74 0.06 4.68 0.08
* 2.82 0.01 4.76 0.03 0.319 0.020
Average 4.80 (0.07)
Nakhlites
using the CO2 method on the Delta. Methods are described in the sample materials Table 1.1 continued.
preparation, and analytical techniques section.
*Measurements made using the O2 method on the MAT 252; all others were made
attempted. However, only one measurement of this kind was made, therefore conclusions are unclear at this time.
Meteorite phase δ17OVSMOW error δ18OVSMOW error Δ17O error
NWA 998 pyoxene 4.94 0.04
5.01 0.04 5.00 0.04 4.97 0.04
* 2.83 0.05 4.78 0.08 0.324 0.010
* 2.83 0.05 4.81 0.08 0.306 0.010
* 2.90 0.03 4.91 0.05 0.317 0.008
* 2.79 0.07 4.73 0.14 0.309 0.012
Average 2.84 (0.02) 4.89 (0.04) 0.314 (0.005)
HCl-treated 4.96 0.04
pyroxene 4.95 0.04
4.92 0.04 4.82 0.04
* 2.92 0.03 4.95 0.05 0.317 0.008
Average 4.92 (0.03)
HF-treated 4.98 0.06
pyroxene 4.85 0.06
4.82 0.06 4.74 0.06
* 2.86 0.07 4.79 0.14 0.342 0.012
Average 4.84 (0.04)
all pyroxene 2.85 (0.02) 4.89 (0.02) 0.319 (0.005)
olivine 4.41 0.16
4.86 0.09 4.58 0.04 4.74 0.09
Average 4.65 (0.10)
Nakhlites Continued Table 1.1 continued.
*Measurements made using the O2 method on the MAT 252; all others were made using the CO2 method on the Delta. Methods are described in the sample materials preparation, and analytical techniques section.
Measurements of δ18O
Except for DaG 476 ol, all δ18O values of SNC minerals from this study display relationships that broadly agree with equilibrium fractionations in oxygen isotope ratios among these minerals at igneous temperatures (figure 1.2). Maskelynites show the highest values, olivines show the lowest, and pyroxenes are in the middle. Figure 1.4 illustrates the mineral – mineral fractionations for various coexisting mineral pairs (olivine – pyroxene and maskelynite – pyroxene pairs from the same rock) analyzed in this study, and compares these data with similar mineral pairs from terrestrial mafic igneous rocks (where plagioclase is included as a point of comparison to maskelynite), and to fractionations predicted based on previous experimental constraints on mineral – mineral fractionation factors (Rosenbaum and Mattey 1995; Eiler 2001). Most terrestrial data appear to be slightly out of equilibrium compared to experimental and theoretical determinations, either because the experiments are slightly in error or because phenocryst assemblages in mafic igneous rocks are typically slightly out of equilibrium. Almost all martian data from this
Meteorite phase δ17OVSMOW error δ18OVSMOW error Δ17O error
NWA 2737 olivine 4.37 0.12
* 2.62 0.01 4.36 0.02 0.325 0.010
Average 4.37 (0.01)
ALH 84001 pyroxene 5.18 0.03
4.92 0.03 5.03 0.06
* 2.92 0.02 4.97 0.03 0.305 0.015
Average 5.03 (0.06)
Chassignite
Orthopyroxenite Table 1.1 continued.
*Measurements made using the O2 method on the MAT 252; all others were made using the CO2 method on the Delta. Methods are described in the sample materials preparation, and analytical techniques section.
study are comparable to terrestrial data and most are within predicted ranges of equilibrium fractionations. However, the ol – px fractionation in DaG 476 and the px – msk fractionation in NWA 4468 fall outside both the predicted range for magmatic equilibrium and the majority of the terrestrial dataset we considered.
Comparison of the Present Study with Previous Data
Figure 1.5 compares δ18O values of SNCs from this study to previous measurements. It is noteworthy that we observe a significantly smaller range in δ18O for any one phase than was observed in previous studies. There are three factors that may be contributing to this finding. First, most of these rocks are cumulates. Bulk measurements of a lherzolitic shergottite that consists of mostly ol and px will result in a lower δ18O than a basaltic shergottite that consists of px and msk even if they had parent magmas that were identical in δ18O and had closely similar δ18O values of pyroxenes. This is due to oxygen isotope
Table 1.2. Results of cleaning study.
untreated error HCl error HF error
NWA 998 4.94 0.04 4.96 0.04 4.98 0.06
5.01 0.04 4.95 0.04 4.85 0.06
5.00 0.04 4.92 0.04 4.82 0.06
4.97 0.04 4.82 0.04 4.74 0.06
Average 4.98 0.03 4.91 0.06 4.85 0.10
SCOL 5.77 0.04
5.78 0.04 5.79 0.06
5.69 0.04 5.59 0.06 5.84 0.06
5.75 0.06 5.89 0.06 5.75 0.06
5.55 0.06 5.82 0.06 5.64 0.06
5.75 0.06 5.65 0.06 5.67 0.06
Average 5.72 0.09 5.75 0.12 5.73 0.09
δ18OVSMOW
fractionation among coexisting phases in magmas. Clayton and Mayeda (1996) attributed all variations of δ18O values of SNC whole rock samples in their study to this factor.
Second, different laboratories use different sample preparation techniques and prefluorination conditions. Neither Romanek et al. (1998) nor Franchi et al. (1999) report acid washing as a sample preparation technique, but Rumble and Irving (2009) do report acid washing. Measurements of bulk rocks might include contaminants, such as terrestrial weathering products and/or martian alteration phases that are not present in mineral separates. Acid leaching is intended to remove these contaminants, though it is not clear
3.5 4.0 4.5 5.0 5.5 6.0
Shergotty px Shergotty msk Zagami px Zagami msk NWA 2986 px NWA 2986 msk NWA 4468 px NWA 4468 msk NWA 1950 px NWA 1950 ol ALH A77005 px ALH A77005 ol NWA 2046 px NWA 2046 ol DaG 476 px DaG 476 ol Dho 019 px SaU 005 px SaU 005 ol NWA 2737 ol Lafayette px Lafayette ol Nakhla px NWA 998 px NWA 998 ol ALH 84001 px Enriched
Shergottites
Intermediate Shergottites
Depleted Shergottites
Nakhlites Chassignite
ALH 84001
δ18
OVSMOW
Figure 1.2. Measurements from this study. The shergottites are grouped according to depletion. All error bars are 1σ standard deviation.
that it does so with perfect efficiency. Furthermore, acid leaching might actually degrade the quality of oxygen isotope measurements in some cases. Olivine can transform to an amorphous “gel” when exposed to acids. It is unknown whether or not this causes an effect on δ18O (or ∆17O) measurements, but there is a possibility that acid leaching a bulk sample that contains a lot of olivine may have an effect. Measurements of the same sample prepared in various ways made in one lab, and on one instrument (similar to the cleaning experiments performed on NWA 998 pyroxenes in this study) may be able to resolve whether some of the cleaning methods used in prior studies subtly influence δ18O (or ∆17O) values.
Figure 1.3. Histogram of all Δ17O measurements made on SNC mineral separates from this study.
0.20 0.25 0.30 0.35 0.40
2 4 6 8
Basaltic Shergottites Peridotitic Shergottites Nakhlites
HCl-leached NWA 998 HF-leached NWA 998 Chassignite
Orthopyroxenite
n=17
Δ 17 O
#
3.5 4.0 4.5 5.0 5.5 6.0 6.5 7.0
predicted equilibrium terrestrial ol-cpx terrestrial ol-opx NWA 1950 ol-px
ALH A77005 ol-px
NWA 2046 ol-px SaU 005 ol-px Lafayette ol-px NWA 998 ol-px Dag 476 ol-px
δ18 O VSMOW (ol) (A)
Figure 1.4. (A) Ol – px equilibrium pairs. (B) Plag/msk – px pairs. Data from this study compared with terrestrial samples. Black and open symbols are from terrestrial samples (from GEOROC); red symbols are from this study. Grey regions denote equilibrium based on experimental and theoretical data (Rosenbaum and Mattey 1995;
Eiler 2001).
3.0 3.5 4.0 4.5 5.0 5.5 6.0 6.5 7.0 7.5 3.0
3.5 4.0 4.5 5.0 5.5 6.0 6.5 7.0
predicted equilibrium terrestrial plag-cpx terrestrial plag-opx Shergotty msk-px Zagami msk-px NWA 2986 msk-px NWA 4468 msk-px
δ18OVSMOW (px)
δ18 O VSMOW (plag/msk) (B)
Prefluorination of the sample chamber in this study and at the Geophysical Laboratory (GL—laboratory used by Rumble and Irving 2009) is done overnight at room temperature (Rumble et al. 2007), whereas at Open University (OU—laboratory used by Franchi et al.
2 4 6 8 10 12
14 pyroxene
olivine
#
Nakhlites This Study
(B)
3.0 3.5 4.0 4.5 5.0 5.5 6.0 2
4 6 8 10 12
14 bulk rock
pyroxene olivine Nakhlites
Literature
δ18
OVSMOW 2
4 6 8 10 12
14 pyroxene
olivine maskelynite
δ18
OVSMOW
#
Shergottites This Study
(A)
3.0 3.5 4.0 4.5 5.0 5.5 6.0 2
4 6 8 10 12
14 bulk rock
pyroxene maskelynite Shergottites
Literature
2 4 6 8 10 12
14 NWA 2737 ol
ALH 84001 px
δ18
OVSMOW This Study
(C)
2 4 6 8 10 12
14 Chassignites bulk rock Literature
#
3.0 3.5 4.0 4.5 5.0 5.5 6.0 2
4 6 8 10 12
14 bulk rock
pyroxene olivine ALH 84001
Literature
Figure 1.5. Comparisons of δ18O from this study with previous studies. Where there is overlap between minerals in this study, ol or msk are superimposed on px.
Pyroxene has the smallest fractionation from the melt, and therefore would be closest to whole rock values, if the whole rocks are not cumulates. For previous measurements, mineral separate data are superimposed on bulk rock data.
1999) the sample chamber is evacuated overnight at elevated temperature and then prefluorinated at room temperature prior to analysis (Franchi et al. 1999). Romanek et al.
(1998) prefluorinated for one hour at an elevated temperature, presumably following methods of Clayton and Mayeda (1963).
Third, not all studies have followed the same practices in calibrating measurements to the VSMOW scale. Laboratories that make calibrations based on international silicate standards (this study and that of Romanek et al. 1998) obviously depend on the accepted value for that standard. Kusakabe and Matsuhisa (2008) have demonstrated that different laboratories are not reporting the same values for some standards. Franchi et al. (1999), and Clayton and Mayeda (1983) report data for silicate standards that are lower than those from Romanek et al. (1998), and this study (e.g., δ18O of UWG-2 = 5.4‰ vs. 5.8‰). The conference abstract of Rumble and Irving (2009) does not report standard data. However, even after one corrects for different silicate standard values, scatter still exists in the data, even for the same meteorite. Franchi et al. (1999) and Clayton and Mayeda (1963) report data relative to a working gas that has been independently calibrated to VSMOW (i.e., as opposed to the difference with respect to an interlaboratory silicate standard). It is unclear how data were calibrated to the VSMOW scale for the Rumble and Irving (2009) abstract.
Surveying the various approaches to calibration for obtaining δ18O values, we conclude that one cannot compile a data set of δ18O measurements of SNC meteorites among different laboratories without introducing systematic errors on the order of tenths of per mil due to variations in methods and materials for calibration to the VSMOW scale (and this is likely generally true for silicate δ18O values). Nevertheless, when one attempts to correct for these differences (i.e., by adding 0.4‰ to data from the Franchi et al. 1999 and Clayton and
Mayeda 1983 to make them consistent with our calibration), significant interlaboratory differences still exist in data for the SNC meteorites, even for whole rock measurements of the same meteorite. This implies that differences in analytical or sample preparation procedures are at least partially responsible. Nevertheless, we again emphasize the general lack of variation in δ18O in this study and the one done at OU (Franchi et al. 1999); a large enough range of samples are considered in that work that we consider it unlikely variations in δ18O observed among other studies reflect true variations among primary martian silicate minerals.
Shergottites
Pyroxene is a major phase in SNC meteorites and was analyzed in the largest number and diversity of samples in this study, and so serves as the simplest point of reference for estimating differences in δ18O between samples. Figures 1.2 and 1.5 summarize these data for our sample suite, which covers the whole range in shergottites, from depleted and reduced to enriched and oxidized. These figures suggest that liquids from which the shergottites crystallized span a significantly smaller range in δ18OVSMOW (0.35‰) than previously inferred from whole rock measurements (~2‰), and that the process responsible for the trends between δ18O and enrichment and oxygen fugacity among the shergottites (Herd 2003) do not reflect compositional trends among the SNC parent magmas; they must instead be fortuitous results of analytical errors, sample preparation artifacts and/or systematic differences in mineral proportions of cumulate rocks. In any event, our oxygen isotope data provide little to no evidence that the oxidation state or enrichment of shergottites is associated with oxygen isotope signals, and thus do not provide any
indication that the shergottite parent magmas assimilated or mixed with aqueously altered mantle or crustal components.
Pyroxenes in DaG 476, Dho 019, and SaU 005 (that is, three of the four depleted shergottites that we analyzed) are slightly higher in δ18O (by ~0.2‰) than pyroxenes from other shergottites. A 0.2‰ difference in δ18O among shergottite pyroxenes may be too small to support any confident conclusions. But it is among the only statistically significant variations we observe in our otherwise uniform data set, so we discuss possible explanations below.
It is imaginable that this reflects a high proportion of δ18O-rich alteration phases in pyroxene separates from these samples. None of these samples were acid washed, and both DaG 476 and Dho 019 exhibit terrestrial weathering; however, SaU 005 does not exhibit terrestrial weathering. And, our cleaning study of NWA 998 (also higher in δ18O by 0.2‰) suggests that acid leaching makes no significant difference to the measurements of pyroxenes that contain visible alteration products. We conclude that there is little evidence that alteration products could be responsible for this difference.
The depleted shergottites are relatively rich in low-Ca pyroxene (mostly pig with some opx, and little aug). It is known that opx is higher in δ18O than coexisting high-Ca cpx when they form in mutual equilibrium. It is not obvious whether this reflects a chemical or structural difference, and so it is not clear whether the low-Ca, clinopyroxene pig should exhibit an oxygen isotope fractiona