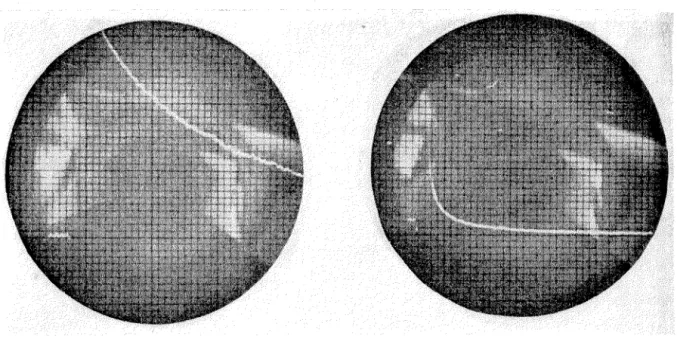
In these experiments and experiments with iodine solutions, a short, intense flash light pulse dissociated 1-10% of the iodine molecules in the reaction cell. An oscilloscope trace, a direct indication of subsequent recombination observed at periods from 0.0002 second after the flash to 0.01 second, was photographically recorded. The concentration of uranium in this slug was determined as ppmo. The isotopic composition of lead from Strombus gigas was also determined and compared with other analyzes of 11 commorl' lead.
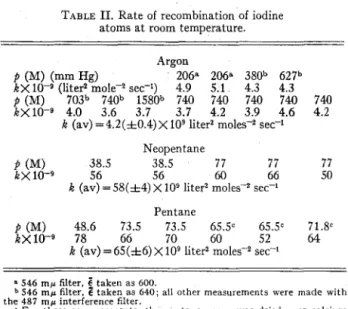
Some studies of the trace amounts of lead, uranium and thorium in marine carbonate skeletons. Conditions for the recombination experiments Summary of data from I2 in CCl4 solutions Optical density data used to calculate the extinction coefficient of I 2 in ~-c7H16.
LIST OF FIGURES
PART I
Derivation of the Recombination Expression
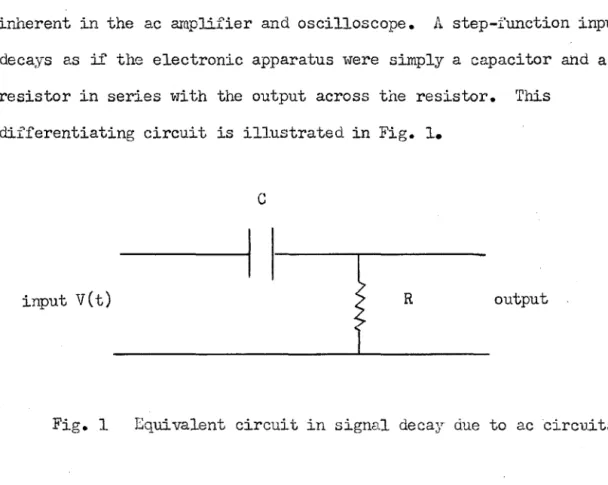
This part contains the derivation of mathematical expressions that relate the iodine atom concentration to the experimentally observed parameters. A correction for photocell decay in AC circuits is derived and incorporated into the final equation. The course of the reaction was monitored spectrophotometrically, and changes in light transmission through the reaction cell are related to changes in the concentration of the iodine molecule.
The initial logarithmic rate of change of the iodine atom concentration (equation (4) ) is therefore set equal to ff:. However, since the average lifetime of the iodine atoms in liquids is typically much less than a millisecond and.
One washing with water
- One washing with water
- Distillation over molten Na, 97.5 - 97.8°C distillation range
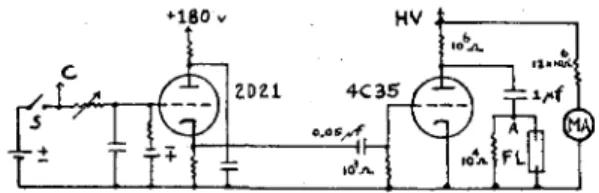
A 33.2 cm long, cylindrical, pyrex reaction cell with a 5.1 cm external diameter and 2 filling arms placed in the trough of the bottom reflector. If the first of these two equations is divided into the second and the law of the mean :iintroduced,. From the plate of the thyratron passed four 20 megohm resistors (Sprague high voltage, ferrule type) to.
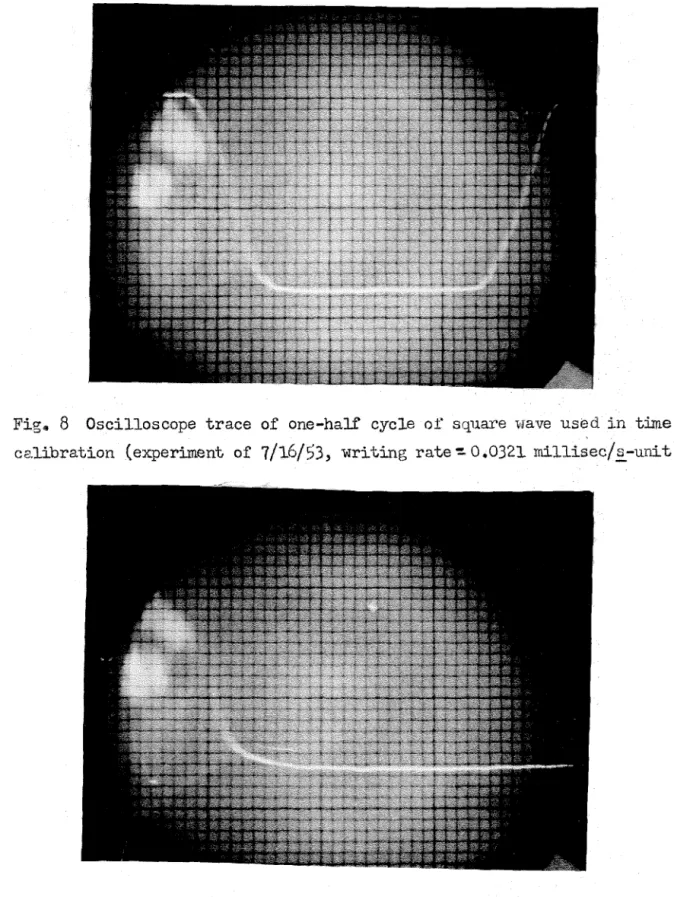
Several photographs taken in succession of the calibration square waves with the photoelectric cell alternately shielded and unshielded from the steady light provide the average amplitudes, ~l and~' used in calculation. The reciprocals of the signal heights were plotted against tine and the slope of the straight line through these points was calculated.
In fact, the dependence of the intercept data for both gas and liquid reaction cells on the energy delivered by the flashbulb strongly suggests that delayed flashbulb firing rarely, if at all, occurs. Illumination with the filtered flashbulb light produced a reaction cell containing only Eastman spectropiiOtometer grade cc1. The points at the end of the sweep are high in almost all plots.
The reason for this slight deviation towards the end of the response from the line for a second order rate expression is not known. Possibly a combination of effects tend to shift these p_oints upwards as the signal is compressed at the edges of the oscilloscope plane along both the time and the amplitude directions (the cathode ray tube is curved at the edge). In addition_; the small positive signal in the cc1 4 before I2 was added was observed at higher monitor lamp currents (.£!! 5 f~ . arnps) than the phenomenon wi.
The compression in the time direction at the end of the sweep and the small positive-signal overcorrection partly account for high reciprocal values, but the small number of points actually affected in any plot and the incompleteness of the adjustment for these errors meant that performed replotting. impractical. The signals also give roughly straight lines when plotted against time on semilogarithmic paper (cf. Figs. 13, 14 and reported recombination values were obtained.
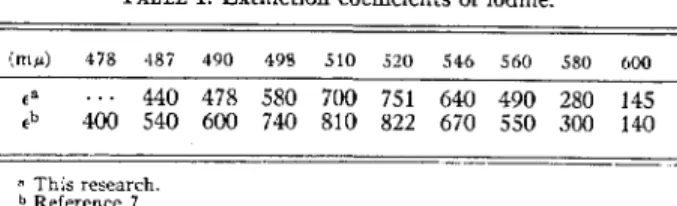
Determination of the effective extinction coefficient To determine the effective extinction coefficient for I2 in cc1. The optical density of this small cell was measured at 517 1¥' in the Beclanan model DU spectrophotometer and after making the blank correction, the concentration of iodine was calculated using the reported (3) extinction coefficient of 930. If the optical density for a reaction cell is taken as log i0/i1 where ~ is the photoelectric current due to the steady light with a reaction cell filled with H20* in the light path and i1 is.
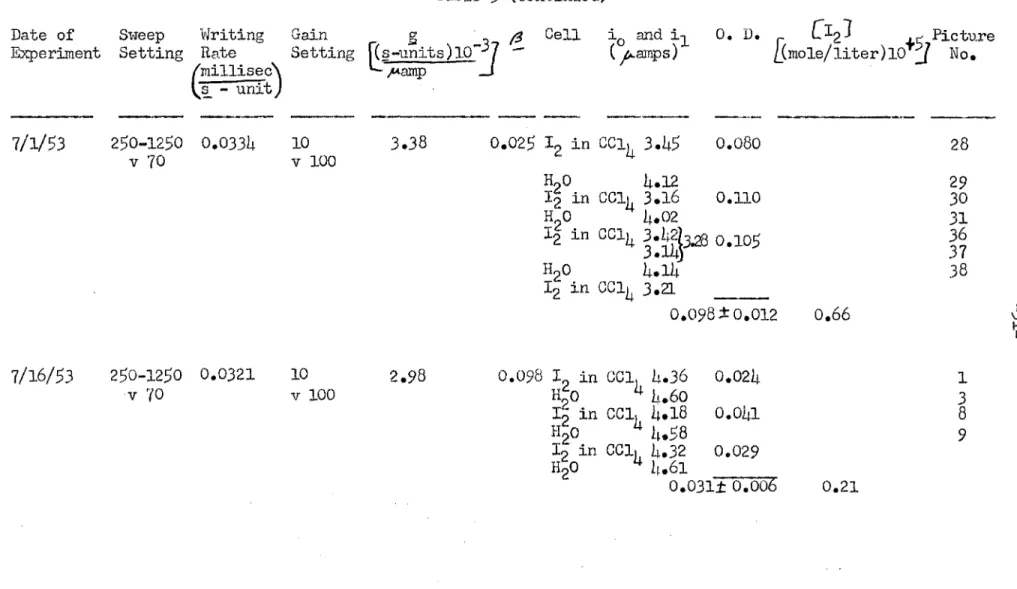
Optical density Jk~ta used in calculating the E,;,~tinction coefficient for I 2 in cc1 4 under conditions of the recombination experiments A. The logarithm of both sides of the equation formed bJ' subequation (!1.4a) by equation (LJ.ib) becomes after the application of Taylor's. In Taole S are given the date of each experiment with I2 in CCl4 solutions, the oscilloscope sweep setting, the write speed of the oscilloscope S"iNeep (in millisec/ §. - ur.:5.t), the .
The primary quantum yield in the gas phase for the dissociation of iodine molecules has been shown to be essentially unity in the banded region of the absorption spectrum by Rabinowitch and \1Joocl (4). The optical density of this cell was essentially the same as that of a 10 cm long cell with the same components whose iodine concentration was 1.1 x: 10-.5 mol/liter, so the concentration of the longer cell was ( 10/32.9) x 1.1) x io-5 mol/liter. The values of the fractional dissociation in the gas cells are slightly larger than they should be.
The reflection loss and the error in the fractional separations in the gas system almost cancel each other. Deviation me<1n is the average of the weighted deviations and is assumed to have an additional potential error of at least 15% associated with iodine concentrations and assumptions in fractional dissociation values. Essentially the same results were obtained from all these solutions except for an approximately 60% increase in the initial iodine atom concentration with a doubling of the discharge energy of the flash lamp.
The rate constant in the latter experiments is apparently too high by a factor of 1/0.82, in all probability due to the non-uniform production of iodine atoms. However, the apparent increase in signal decay rate towards the end of the sweep is not due to an inhomogeneous concentration of iodine atoms. 7H16 without purification and I 2 provided sustained positive signals (decrease in optical density) ·with a minimum in the signal just after the flash.
4/1/53 (continued)
The subsequent recombination of the iodine atoms is facilitated by the very high rate of collision of an iodine atom with solvent molecules. Although other mechanisms for the energy dissipation of excited molecules in solution have been suggested (7), primary recombination appears to be the only significant process responsible for the fractional quantum yields observed in these experiments (0.41 in ,!! -c 7H Reaction (44b) is the more likely of the two, but is energetically possible at the s1.10r test wavelength entering the reaction cell, where the minimum activation energy is assumed to be the difference between the binding energies.
Chemical interaction of the G atom with solvent molecules in recombination studies is unlikely in the energy ranges. The ratio of 2.3 for these diffusion coefficients is almost similar to that corresponding to the quant.-rn values. This suggests that there may be a rough correlation between the quantum yield and the ability of an atom to diffuse through the surrounding envelope of solvent particles, at least for protolysis at.
The conservation of momentum requires that the dissociated particle be reflected by the solvent molecules, however high the kinetic energy of the particle may be as long as the solvent. With ihan's more precise value for the C6HJ.4 solutions and the ratio of o.62 for the quantum. However, this close agreement is purely coincidental in relation to the assumptions involved in calculating the value in these studies.
It is assured no chemical re2ctions between the dissociated ps.rticles and. the dissolved decomposition of ethylene ioside does not. I'urt,hermo:ce, the stationary concentration of atoms in an irradiated solution is given by the rate of the:'..r production times their a verc:.ge lifetime. Since the rate of production is proportional to 1 / n and the average lifetime, to n, the concentration iG independent of the primary recombination and the pl10tostation217 condition experiments cannot provide any ini'or;1on about ti:J.is process3. However, the rough quantum yield that2_ obtained :Lin the current recombination studies de ) illustrates the flexibility of the .flash.
However, in view of the difficulty involved in these various experiments, it is difficult to obtain accurate results.
87- 6. References
Pra.v·
Linear interpolation between the optical densities for the standard solutions and the observed density of the '.3t_:t:'~~. The new low concentrations of lead in the Stromous shell and the reported 0.31 ppm lead (6) for the Lomita marl indicate that marine calcium carbonate apparently contributes very little of these heavy metals to sediments. The isotopic ra·0ios observed for the lead of the :;trori1bus .f2:.i3as ?.look unique.
The isotopic composition of lead in the Atlantic Ocean can differ significantly from that of lead in the Pacific Ocean, given the degree of isolation of these two major ocean bodies and the difference in the bulk of the ocean. the rocks border:;. For a natural coloreo mineral iris concentration of the 2nd type capture center and Ni. The common structure for carbonate Gs of the divalent ions with ionic radii smaller than that of Ca+2 is the calcite structure.
Hi ·wjJ:.h 'l:;e 2.and the suggestion:::al is made that the deviation may in some cases be a characteristic of the age of the rocks. The rate of devitrif'ic~·.tion at roorn . temperature is believed to be of the order of 3 r/100 N yr. These phase songs are, following i)uert;er's discussion (1), a reconstructive type and in the light of the energy.
If wc:.te:c diffuses into the glass and forms -OH [;groups, the crosslink is broken,. The aftershocks represent elastic ai'ter-working of the rock, each jolt being an increase in creep stress. However, it is suggested that an equally satisfactory (and perhaps better) representation of the data can be achieved with the sigmoid equation.