I would also like to thank David Cocker and the other students from the roof laboratory and Prof. to thank. Last but not least, I would like to thank my family; my parents (Miriam and Avigdor Beiles) and sisters (Diti and Gali) who were always with me, regardless of the physical distance.
Physical properties of ice and snow
At equilibrium, the thickness of the liquid-like layer, d, (in the range of d » 0) can be expressed as. This effect leads to the solar zenith angle dependence of the reflectivity (albedo) of snow.
2. 2 Photochemistry in ice
Nitrate in Polar Ice
A major difficulty arises from incomplete understanding of the sources of nitrate in polar snow and its fate after deposition. On the other hand, nitrate profiles sampled along the route of the International Transantarctic Expedition indicated that nitrate distribution may be affected by electron flux (Dahe et al., 1992).
12_8 MTN/YEAR\ ~
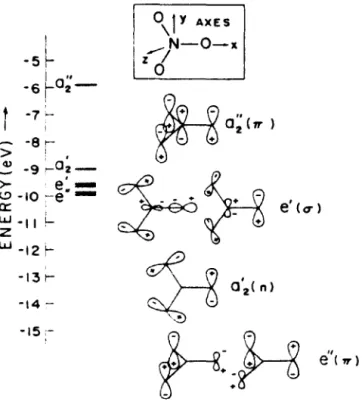
Nitrate Photolysis in The Aqueous Phase
MO shapes are pictorially represented on the right (Maria et al., 1973). In addition, the increased stability of ONOO- at pH > 7 can lead to additional nitrite via reactions 13 to 16 (Kissner et al., 1997):.
Organic Matter in Polar Ice
1997) C~ and Delta 0-18 e O2 Records from Antarctic and Greenland Ice: A Clue for Stratigraphic Disturbance in the Bottom Part of the Greenland Ice Core Project and the Greenland Ice Sheet Project 2 Ice Cores. Distribution of nitrate content in surface snow of the Antarctic ice sheet along the route of the 1990 International Trans-Antarctic Expedition. Measurement of liquid layer thickness on ice surfaces by atomic force microscopy.
Houdier S., Perrier S., Domine F., Cobanes A, Legagneux L., Grannas AM., Guimbaud c., Shepson P. 2000) Snow phase Acetaldehyde (CH3CHO) and acetone (CH3hCO in the Arctic Snowpack. A (1983) Nitrogen oxides in the troposphere: global and regional budgets. 1994) Melting, freezing and colloidal suspensions, Physics Rep. Rapid oxidation reaction of nitrite by dissolved oxygen in the freezing process in the tropospheric aqueous phase.
Abstract
Introduction
4-nitrophenol was selected for this study as a convenient aromatic chromophore with a strong absorption over the UV range relevant to the Earth's surface and which can represent the photochemical behavior of other simple polar aromatic compounds in ice. 4-nitrophenol is introduced into the environment by the following processes: combustion from motor vehicles (Tremp et al., 1993), photochemical reactions in the atmosphere during photochemical smog events (e.g., Leone and Seinfeld, 1985), and degradation of pesticides, such as parathion and parathion- methyl (Kishk et al., 1976; Woodrow et al., 1977). Field measurements suggest that 4-nitrophenol is mainly particle-bound and has a longer lifetime in the atmosphere than 2-nitrophenol (Luttke et al., 1997).
This suggests that 4-nitrophenol may find its way to rural areas in the upper latitudes. In this study, the photochemical degradation of 4-nitrophenol in uniform ice pellets under conditions representative of the Earth's surface (258 K, 105 Pa and under UV irradiation over the wavelength range 300 to 370 nm) is clearly demonstrated.
Experimental Methods
Polycrystalline ice pellets of 13 mm × 4 mm were made from the ice powder under an applied pressure of 7.1 MPa using a French press. After annealing overnight at 248 K under ambient pressure (105 Pa), the pellets were irradiated with light over the wavelength range of 300–370 nm. During the experiments, the ice pellets were placed (one at a time) in an insulated slot in a copper block, which was kept at a constant temperature of 258 K.
After irradiation, pellets were thawed and analyzed by liquid chromatography (HP 1090), ion chromatography (Dionex BIO-LC) and total organic carbon analysis (Shimadzu TOe-5000A). The average intensity of scattered light was measured by a photomultiplier located at the bottom of the integrating sphere, which quantifies the light transmission through the pellet, with air used as a reference. The reflections from the pellets were measured by the ice pellets contained in a slot at the wall of the integrating sphere (with a depth equal to the pellet thickness), with pressed BaSO4 powder used as a reference.
Results
Due to light scattering and the uncertainties related to the path length of light propagation through the ice, the light absorption of the 4-nitrophenol in the grains was determined using a UV-VIS spectrophotometer (Shimadzu UV-2101 PC) with a attached integrating sphere (Shimadzu ISR-260). The reflections of the grains were measured from the ice grains contained in a slit at the wall of the integrating sphere (with a depth equal to the grain thickness), with pressed BaSO4 powder used as a reference. methods) are shown in Fig 3.1. The percentage of incident light absorbed by a 250 ~M 4-nitrophenol solution dispersed in ice pellets was determined based on a light flux balance, as described in equation 1, where pure H20 ice pellets were used as a reference blank.
Three aromatic compounds, hydroquinone, benzoquinone, and, 4-nitrosophenol (Fig. 3.3) and two inorganic anions, nitrate and nitrite (data not shown), were detected as reaction products of the ice-phase solid photolysis of 4-nitrophenol. Although the amount of aromatic reaction products detected did not account for the total amount of 4-nitrophenol that disappeared, TOC analysis showed that the latter did not change significantly over a 90-minute time period (Fig. 3.4). Nitrate and nitrite were detected in the ice pellets of the control experiment, but no increase in their concentration was observed over time.

3.S. Discussion
Conclusions
Photochemical degradation of 4-NP under conditions similar to those in polar snow and ice (i.e., temperature, pressure, and UV wavelength range) suggests that other direct and indirect photochemical processes may occur in polar ice/snow during spring and summer. . For example, naturally occurring organic matter (NOM), which has considerable aromatic character and serves as an excellent absorber of UV and visible radiation, is most likely present in significant amounts in polar snow. These free radicals can further react with other impurities present in polar snow (eg organic matter), causing chemical changes in important species such as H202 and H2CO and CO2•.
These changes may affect the interpretation of the time records of these species in polar ice cores regarding the oxidation capacity of past atmospheres (Staffelbach et al., 1991) and related climate changes (Fuhrer et aI., 1993). The present results are consistent with recent studies by Honrath et al. 2000), and Sumner and Shepson (1999), who reported the photochemical production of NOx and HCHO in surface accumulated snow. These observations were interpreted in terms of nitrate photolysis in snow, followed by the production of hydroxyl radical, which in turn is expected to lead to the production of H202•HCHO and other organic compounds destruction in polar snow during spring and summer.
Scheme of the integrating Sphere
Light absorption by 4NP in ice pellets and in aqueous solution
As seen in Figure 3.6, at initial concentrations of [4-nitrophenol] > 50 J.lM, the measured absorbance does not appear to follow the Beer-Lambert law. It is possible that due to the exclusion of 4-nitrophenol from the ice matrix during freezing (see above), the solute concentrates on crystal surfaces and between adjacent crystals where it reaches supersaturation and precipitates. If crystalline 4-nitrophenol absorbs less light than in frozen solution, we would expect a decrease in overall light absorption.
Extrapolation of the 4-nitrophenol solubility data of Benes and Dohnal (1999) (Figure 3.7) to temperatures below 273 K shows that at 258 K the solubility of 4-nitrophenol in supercooled water is about 30 mM. Measurements of the thickness (h) of the quasi-liquid layer on the surface of pure ice by atomic force microscopy (Doppenschmidt et al., 1998) show that at 258 K, approx. Assuming a similar layer on the surface of ice crystals in our experiments ([4-nitrophenol]o = 250 J.lM) and complete rejection of 4-nitrophenol from the ice matrix, we calculate (eq. 5) that for ice crystal diameters greater than 14 J.lm, 4-nitrophenol is expected to precipitate according to.

4-NP distribution and degradation rate in solid ice cylinders
- Abstract
- Introduction
- Experimental Section
- Results and Discussion
- Atmospheric implications
Most of the 4-NP is concentrated (up to seven times the original concentration) in the voids in the central part of the ice sample. The stability of the lamp output during the (necessarily) long experiments was checked with a photocell (UDT Sensors, model PIN UV 100L) attached to the top of the aluminum chamber. The volume of melt in the QS was measured and used to determine the average thickness of the ice layer (h).
In other words, N02 emission rates remain constant despite the fact that more N03- is photolyzed in the thicker ice layers. The inevitable conclusion is that only the N02 produced in the outer region of the ice deposits is able to escape into the gas phase. The estimated value of the effective diffusion coefficient D'N02 indicates that only the N02 produced within a few tens of microns of the ice/air interface is actually released into the gas phase.
Nitrate levels tend to decrease with depth to a meter or more in cores. Rearrangement: Evaluation of Quantum Yields of Radical Formation, fur Zeitschrift Physikalische Chemie Neue Folge.

N02 collection efficiency
Lamp output Spectrum and the extinction coefficient of 2-NBZA and nitrate
Appendix 4-4: Error analysis
- Experimental Methods
- Results
- Discussion
Furthermore, knowledge of the activation energy for nitrite formation in ice can also provide additional information about the environment in which the primary photochemistry takes place. The light absorbance of the nitrate in the pellets was determined (before irradiation) using a UV-VIS spectrophotometer (Shimadzu UV-2101 PC) with an attached integrating sphere (Shimadzu ISR-260). In the presence of HC02-, which acts as an OH scavenger (Eq. 1), the rate of nitrite formation remained linear at least on time scales of up to two hours (Fig. 5.4).
The linear regression through the data from the 1 mM NaN03 pellets in the absence of OH scavenger indicates a higher activation energy (-9 kcal morl). The moderate difference between these quantum yields may be the result of the substantially different methods used in the two sets of experiments. As in aqueous solutions, the addition of an OH scavenger (HC02-) produced a significant increase in the measured quantum yields, indicating that both solutes are present in the same area of the ice sample.


