Download free eBooks at bookboon.com
Click on the ad to read more 65
3 Derivative markets: futures
3.1 Learning outcomes
After studying this text the learner should / should be able to:
• Define a futures contract.
• Understand the constituents of the definition of futures contracts.
• Understand the payoff (risk) profile of futures contracts.
• Understand the characteristics of the futures market, such as getting out of a position in futures, and cash settlement versus physical settlement.
• Understand the concepts of margins, marking to market and open interest.
• Comprehend the principles applied in the pricing of futures contracts (fair value).
• Calculate the fair value prices of futures contracts.
• Understand the concepts of convergence, basis and carry cost in relation to basis.
• Understand the motivation for undertaking deals in futures, particularly hedging, and the participants in the futures market.
• Comprehend basis and spread trading.
Download free eBooks at bookboon.com
66
3.2 Introduction
In the previous section on forwards, we defined a forward market as a market where a transaction (buy or sell) on an asset is concluded now (at T+0) for settlement on a date in the future at a price determined now. A forward contract may therefore be defined as a contract between a buyer and a seller at time T+0 to buy or sell a specified asset on a future date at a price set at time T+0. We also identified the advantages and disadvantages of forward markets. We also covered variations on this main theme, such as FRAs, FIRCs and repos.
Essentially, futures contracts are standardised forward contracts, and they developed because forward contracts have some disadvantages, the most obvious one being that forward contracts are difficult (usually impossible) to reverse. There is also a need for efficient price discovery which means that liquidity needs to be enhanced, and this only comes about when activity in the market increases, and in pursuance of this contracts need to be standardised in terms of quality, quantity and expiry date. Once this need is satisfied an exchange is an appropriate market form, and an exchange mitigates risk, which further enhances the breadth and depth of the market.
This does not mean that all forward markets are destined to become futures markets. In some markets reversibility of deals is not crucial and customisation in terms of quantity and expiry is required. The best example is the outright forward forex market where commercial transactions (importing and exporting) require customisation and rarely require reversal.
Futures are discussed in the following sections:
• Futures defined.
• An example.
• Trading price versus spot price.
• Types of futures contracts.
• Organisation of futures markets.
• Clearing house.
• Margining and marking to market.
• Open interest.
• Cash settlement versus physical settlement.
• Payoff with futures (risk profile).
• Pricing of futures (fair value versus trading price).
• Fair value pricing of specific futures.
• Basis.
• Participants in the futures market.
• Hedging with futures.
• Basis trading.
Download free eBooks at bookboon.com
67
• Spread trading.
• Futures market contracts.
• Risk management by a futures exchange.
• Mechanics of dealing in futures.
• Economic significance of futures market.
3.3 Futures defined
3.3.1 Introduction
A futures contract may be defined as a contractual obligation in terms of which one party to the deal undertakes on T+0 to sell an asset at a price (determined on T+0) on a future date, and the other party undertakes to buy the same asset at the same price on the same future date. This sounds pretty similar to the forward contract. It is, but the differences are that the contracts are standardised, the underlying assets are standardised, and the contracts are exchange-traded, because these qualities render the contracts marketable (sort of – later we will see that futures are marketable in the sense that they can be “closed out” by undertaking an equal and opposite transaction).
As noted, essentially the futures markets of the world developed to overcome the disadvantages of forward markets. By their very nature, forward markets are OTC markets (mostly), whereas futures markets are all formalised in the form of financial exchanges, the members of which effect all trading, and the exchange guarantees all transactions by interposing itself between buyer and seller.
The definition of a future may now be extended: a standardised contract which obligates the buyer to accept delivery of, and the seller to deliver, a standardised quantity and quality of an asset at a pre-specified price on a pre-stipulated date in the future.
It may be useful to break up this definition into its constituents:
• Standardised contract between two parties.
• Buyer and seller.
• Delivery.
• Standardised quantity.
• Standardised quality.
• Asset.
• Price.
• Expiry date.
• Market price.
Download free eBooks at bookboon.com
Click on the ad to read more 68
3.3.2 Standardised contract between two parties
BUYER OF
FUTURE SELLER OF
FUTURE Contract FUTURES
EXCHANGE Contract
Figure 1: participants in futures deal
Figure 1: participants in futures deal
All futures contracts in all international futures markets are standardised. A future is a legal contract between two parties setting out the details: price, expiry date, etc. At least one party to the contract must be a member of the exchange. As noted, even though a client may buy a future from, or sell a future to, a member of the exchange, the transaction is guaranteed by the exchange, i.e. the exchange acts as the seller for each buyer, and as the buyer for each seller: it interposes itself in each futures deal. This may be illustrated simply as in Figure 1.
3.3.3 Buyer and seller
It should be evident that the futures market is a typical example of a “zero sum game”, i.e. for every buyer of a contract there is a seller. Consequently, if the buyer makes a loss, the seller gains by the same amount.
The converse is obviously also true. As noted earlier, the buyer and the seller deal with a member of the exchange, unless the buyer and seller are members of the exchange.
Download free eBooks at bookboon.com
69 3.3.4 Delivery
Even though the standard definition of a future emphasises delivery, in practice this is rare, particularly in the financial futures markets. The reason for this is simply that the participants in the futures markets prefer settlement of the profit or loss on expiry date. Even if they wanted delivery, in many cases this is not possible. In the case of a future on an equity index, for example, it is impossible to deliver the index.
Nowadays, delivery takes place in only a few financial and commodity futures contracts.
3.3.5 Standardised quantity
Every futures contract obviously has a specific size, as opposed to a forward contract where size is negotiated between buyer and seller. For example, in the case of the equity / share index futures contracts in South Africa, the size of each contract is ZAR10 × the index value. In the commodities futures markets the contract sizes are usually multiples of standard units, for example, tons, ounces, barrels, bushels, etc.
3.3.6 Standardised quality
This is important in the commodities futures markets, particularly in the case of perishable assets. Quality is obviously not an issue in the case of financial futures markets. In these markets contracts are based on underlying specific assets or notional assets the qualities of which do not vary.
3.3.7 Asset
A futures contract is a derivative instrument, i.e. it and its value are derived from an underlying asset and it cannot exist in the absence of this asset. The underlying assets of futures contracts can be divided into two broad categories, i.e. specific assets and notional assets, and there are various subcategories under each, such as storable assets, perishable assets, income-producing assets, etc. Specific (also called
“physical”) assets include the specific bonds and equities, pork bellies, etc, while notional assets include the industrial index, the all share index, the gold index, etc. One may also categorise futures broadly into financial futures and commodity futures, and then split them further into sub-categories as follows:
• Financial futures:
- Interest rates (for example, future on a specific bond, future on a bond index).
- Shares / equities (for example, future on an individual share, future on equity / share index).
- Currencies (for example, future on the USD/GBP exchange rate, future on currency index).
• Commodity futures:
- Agricultural (for example, future on livestock, future on maize).
- Metals and energy (for example, future on gold price, future on crude oil).
Download free eBooks at bookboon.com
70 3.3.8 Price
Price is the core of a future. Essentially, futures market participants are fixing a price now for settlement in the future. Clearly therefore, the price of the future is related to the price of the underlying instrument.
As the price of the underlying instrument varies, so does the price of the future (but not always to the same extent).
3.3.9 Expiry date
The other vital feature of futures contracts is the expiry date, i.e. the date when delivery or cash settlement takes place. Needless to say, the price of the future at the expiry time on the expiry date is equivalent to the spot price. It will therefore be clear that the futures price moves closer to the spot price as time goes by (i.e. it converges on the spot price).
3.3.10 Market price
The contract trades (in the sense that it can be reversed = “closed out”) because it has a value, and this value is largely influenced by the spot price of the underlying asset, but also by expectations. Price is the only feature of the future that varies. Each contract has a minimum movement size or “tick size”, for example LCC1.
3.4 An example
The above definitional section may be rendered more meaningful if an example of a futures transaction is introduced at this stage (see Box 1). This is an actual deal supplied by an exchange [the Johannesburg Securities Exchange (JSE); hence the use of the currency ZAR, reduced to “R”, in the example] (names are fictitious in the interests of confidentiality).
Member (of the exchange) ABCM bought one Dec 2012 ALSI futures contract at the price 29490. It is a notional contract with the underlying “asset” being the ALSI index, and it expires at 12 noon on 1 December 2012. It can therefore not be delivered by the seller to the buyer and will be settled in cash.
The counterparty (seller) to the deal is member (of the exchange) PQRM: he sold the contract at price 29490. Both parties dealt 29490, i.e. the agreed price (i.e. the price at which willing buyer and willing seller were prepared to deal), which is the “trading” (or market) price of the ALSI at the time (let’s assume 10 am) on the date of purchase / sale (let’s assume 3 January 2012). (Note that the trading / market price is different, but related, to the actual index value.) If these were naked positions (i.e. not hedged), they indicated:
• The buyer expected the ALSI to increase.
• The seller expected the ALSI to decline.
Download free eBooks at bookboon.com
Click on the ad to read more 71
(QWU\WUDGH
$%&0EX\V'(&$/6,#/RQJ
3450VHOOV'(&$/6,#6KRUW
ZĞĨŶŽ DĞŵďĞƌ ĞĂůĞƌ ƵLJͬ^Ğůů YƚLJ ŽŶƚƌĂĐƚ WƌŝĐĞ ŽƵŶƚĞƌͲƉĂƌƚLJ ϬϬϬϬϬϯϵϵϯ D /DZ ϭ ϭϮ>^/ ϮϵϰϵϬ WYZD ϬϬϬϬϬϯϵϵϯ WYZD Z ^ ϭ ϭϮ>^/ ϮϵϰϵϬ D
&ORVHRXWWUDGH
$%&0VHOOV'(&$/6,#FORVHVRXW3URILW± 5
3450EX\V'(&$/6,#FORVHVRXW/RVV 5
ZĞĨŶŽ DĞŵďĞƌ ĞĂůĞƌ ƵLJͬ^Ğůů YƚLJ ŽŶƚƌĂĐƚ WƌŝĐĞ ŽƵŶƚĞƌͲƉĂƌƚLJ ϬϬϬϬϬϯϵϵϱ D /DZ ^ ϭ ϭϮ>^/ ϮϵϱϭϬ WYZD ϬϬϬϬϬϯϵϵϱ WYZD Z ϭ ϭϮ>^/ ϮϵϱϭϬ D
3URILWORVVHTXDOVWKHGLIIHUHQFHLQWKHEX\SULFHDQGWKHVHOOSULFHPXOWLSOLHGE\WKHQRPLQDO PXOWLSOLHGE\WKHQXPEHURIFRQWUDFWV7KHH[DPSOHDERYHDVVXPHVWKHQRPLQDOLV
Box 1: example of futures deal
“The perfect start of a successful,
international career.”
CLICK HERE
to discover why both socially and academically the University
of Groningen is one of the best places for a student to be
www.rug.nl/feb/education
Excellent Economics and Business programmes at:
Download free eBooks at bookboon.com
72
At 3 pm on 3 January 2012 both parties “closed out” their positions at the trading price of the future:
29510. Members ABCM and PQRM each did an equal and opposite trade to their original trade, and therefore made a profit or a loss. This indicates an important point on the nature of the futures market (and indeed of the derivatives market in general): it is a zero-sum market: for every buyer there is a seller (in equal amounts) and for every profit there is an equal-sized loss.
Thus, in the above example member ABCM made a profit of R20, while member PQRM made a loss of R20. Note that this assumes the “nominal” is 1 (we did this to keep it simple). In reality the nominal is 10, i.e. the contract size / value = 10 × the market prices dealt at. Thus, when the trade was opened, both parties had an exposure to the ALSI market of 10 × R29 490 = R290 490, and when the trade was closed out the profit / loss was R200.
It is a feature of futures markets that no money changes hands when a deal is struck. However, both buyer and seller are required to make a “good faith” deposit – termed the “margin” (note: this was the origin of the margin, but it is now part of the risk management procedures of the exchange). This deposit is made with the broker who, in turn, passes it on to the exchange.
In conclusion, it is important to again point out that the exchange interposes itself between the buyer and the seller and guarantees the transaction. For each buy-deal the exchange creates a sell-deal, and for the opposite deal (the sell-deal) the exchange creates a buy-deal. Thus, the counterparty to each leg of a deal is the exchange.
3.5 Futures trading price versus spot price
It should be clear at this stage that buyers and sellers of futures contracts trade at the market prices for the relevant futures, i.e. at the prices established in the market by the interplay of supply of and demand for the futures contracts. It is also apparent that these prices are different from the spot prices of the underlying assets, but that the prices of futures are closely related to the spot prices of the underlying assets. An example is required.
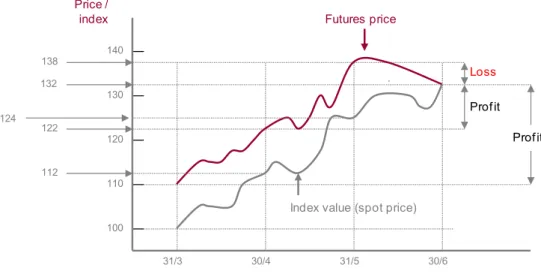
The example in the Figure 2 depicts the life of a three-month future (assume it is a share index future) created on 31 March and expiring on 30 June. It will be evident that the buyer of the future on 31 March who holds it to expiry on 30 June profits (and the seller loses of course). She bought the future at 110 when the spot price was 100 and it “closed out” at 132. Similarly, the buyer of the future on 30 April at 122 (when the spot price was 112) also profits, but to a lesser extent. The buyer of the future on 31 May at 138 (when the spot price was 124), held to expiry, however, makes a loss because the futures price declined to 132 on expiry date (= spot price).
Download free eBooks at bookboon.com
73
Loss Profit Price /
index
100 140 130 120 110
31/3 30/4 31/5 30/6
Profit
Period to expiry 132
122 112 124
138
Futures price
Index value (spot price)
Figure 2: example of a 3-month future (index)
As noted earlier, the price of a future always converges upon the spot (cash market) price as the expiry date gets closer. The reason is that the so-called basis (which is similar to net carry cost – see below) becomes smaller with the passage of time. On expiry date the basis (and net carry cost) is zero.
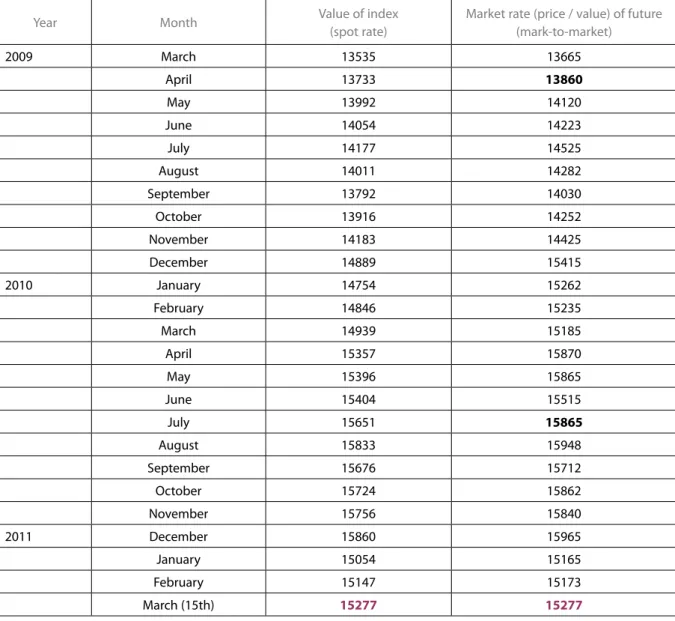
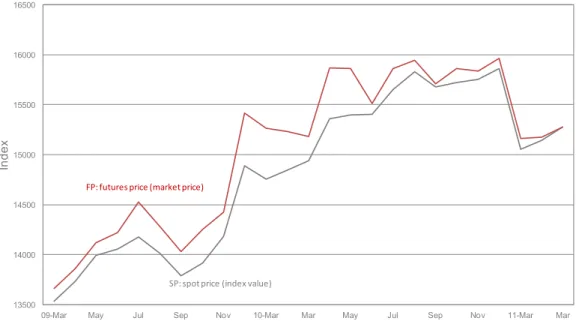
Table 1 tracks the life of a fictitious March 2011 All Share Index (ALSI) future as at month-ends. As noted above, “spot” refers to the value of the index on the particular dates, while market rate refers to the price for the future established in the market, i.e. the price at which the future traded on the relevant dates. This is also illustrated in the Figure 3.
It can be seen that the future traded above the spot price for the entire life of the contract. This is not always the case, however. At times the future can trade at a discount to the spot price. Also clear from the above is that the difference between the two prices is not consistent. This is because expectations play a major role in the determination of the futures price.
Download free eBooks at bookboon.com
74
Year Month Value of index
(spot rate)
Market rate (price / value) of future (mark-to-market)
2009 March 13535 13665
April 13733 13860
May 13992 14120
June 14054 14223
July 14177 14525
August 14011 14282
September 13792 14030
October 13916 14252
November 14183 14425
December 14889 15415
2010 January 14754 15262
February 14846 15235
March 14939 15185
April 15357 15870
May 15396 15865
June 15404 15515
July 15651 15865
August 15833 15948
September 15676 15712
October 15724 15862
November 15756 15840
2011 December 15860 15965
January 15054 15165
February 15147 15173
March (15th) 15277 15277
Table 1: March 2011 all share index futures contract
Two examples may be useful (the numbers are from the Table 1):
• A buyer of 10 contracts (one contract = LCC10 × market price) of the March 2011 ALSI on 30 April 2009 would have “bought” an exposure in the share market (ALSI) to the value of LCC1 386 000 (10 × LCC10 × 13860). If this position were held until “close out”, i.e. 15 March 2011, the buyer would have profited to the extent of LCC141 700 [LCC1 527 700 (10 × LCC10 × 15277) – LCC1 386 000]. The seller of the contract would of course have lost this amount (if she held the contract until expiry).
• A buyer of the 10 contracts on 30 July 2010 would have bought exposure to the ALSI of LCC1 586 500 (10 × LCC10 × 15865). If she held the future until expiry, she would have made a loss LCC58 800 [LCC1 527 700 (10 × LCC10 × 15277) – LCC1 586 500].
Download free eBooks at bookboon.com
Click on the ad to read more 75
13500 14000 14500 15000 15500 16000 16500
09-Mar May Jul Sep Nov 10-Mar Mar May Jul Sep Nov 11-Mar Mar
Index
Figure 3: March 2011 All Share Index (ALSI) future
FP: futures price (market price)
SP: spot price (index value)
Figure 3: March 2011 all share index (ALSI) future
3.6 Types of futures contracts
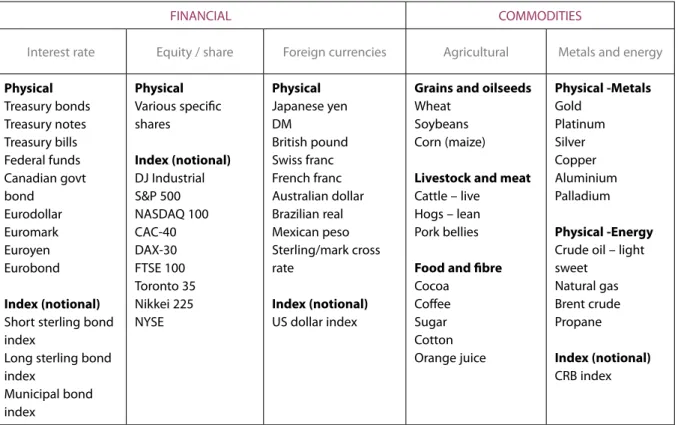
There are many futures exchanges around the world, and the variety of contracts is vast. Table 2 shows an excerpt of the contracts that are listed (from Wall Street Journal).
LIGS University
based in Hawaii, USA
▶
enroll by October 31st, 2014 and▶
save up to 11% on the tuition!▶
pay in 10 installments / 2 years▶
Interactive Online education▶ visit www.ligsuniversity.com to find out more!
is currently enrolling in the Interactive Online BBA, MBA, MSc,
DBA and PhD programs:
Note: LIGS University is not accredited by any nationally recognized accrediting agency listed by the US Secretary of Education.
More info here.
Download free eBooks at bookboon.com
76
FINANCIAL COMMODITIES
Interest rate Equity / share Foreign currencies Agricultural Metals and energy
Physical Treasury bonds Treasury notes Treasury bills Federal funds Canadian govt bond
Eurodollar Euromark Euroyen Eurobond Index (notional) Short sterling bond index
Long sterling bond index
Municipal bond index
Physical Various specific shares
Index (notional) DJ Industrial S&P 500 NASDAQ 100 CAC-40 DAX-30 FTSE 100 Toronto 35 Nikkei 225 NYSE
Physical Japanese yen DM
British pound Swiss franc French franc Australian dollar Brazilian real Mexican peso Sterling/mark cross rate
Index (notional) US dollar index
Grains and oilseeds Wheat
Soybeans Corn (maize) Livestock and meat Cattle – live
Hogs – lean Pork bellies Food and fibre Cocoa
Coffee Sugar Cotton Orange juice
Physical -Metals Gold
Platinum Silver Copper Aluminium Palladium Physical -Energy Crude oil – light sweet
Natural gas Brent crude Propane Index (notional) CRB index
Physical = the actual instrument, currency, commodity. Index = indices of exchanges, etc. CRB index = Commodity Research Bureau.
Table 2: Examples of futures contracts
There are various contracts under each of these names, i.e. contracts that have different expiry dates.
For example, there may be four S&P 40 contracts running simultaneously – the 15 March, the 16 June, the 15 September, and the 15 December. It is to be noted that The Wall Street Journal’s futures contract complete list is about three times the above list provided.
Download free eBooks at bookboon.com
77
3.7 Organisational structure of futures markets
Market nature
PRIMARY MARKET Market
form Market
type
Trading driver Trading
system
DERIVATIVE MARKETS SPOT MARKETS
Trading form
ORDER QUOTE OTC EXCHANGE
FLOOR TEL /
SCREEN SCREEN / ATS TEL
SINGLE
CAPACITY DUAL CAPACITY
Figure 4: organisational structure of derivative financial markets
Figure 4: organisational structure of derivative financial markets
Financial markets have many aspects to them. One way of depicting the organisational structure of financial markets is as in Figure 4.
Does the futures market have both primary markets and secondary markets? The answer is that the market type is primary market; however, while futures cannot be sold, they can be “closed out” at any time by dealing in the opposite direction. The “closing out” results a loss or profit as in the case of a spot instrument sale (or purchase in the case of a “short” sale24) in the secondary market.
The market form of the futures market is formal in the shape of an exchange. There are many futures exchanges in the world or futures divisions of exchanges as in the case of South Africa.
As regards trading driver and the trading system, the futures market in South Africa is order and ATS (automated trading system), i.e. an order-matching method on an ATS is followed. This requires some elucidation:
• The broking members of the exchange register their clients with the exchange. This is in fact unique in that most futures exchanges do not know who the clients of the members are.
• The members we refer to by the generic term broker-dealers, because they may deal as principals or agents and the capacity of trading is disclosed to the client. The broker-dealers at times deal in dual capacity in a single deal (see last bullet point).
Download free eBooks at bookboon.com
Click on the ad to read more 78
• Some broker-dealers do not have clients and only deal as principals, and some broker-dealers deal only as agents with clients (both are called single capacity).
• The ATS is constructed in such a way that broker-dealers input their orders into the system (directly onto a computer). An example is buy 300 December ALSI contracts at 9020 (this is an index value). Sellers do so also. The system places on the screen the best buy and sell orders for all the different contracts, and has a drop-down facility where the non-best buy and sell orders appear (to show the depth of the market).
• Because the buyers and sellers are ultimately to deal with the exchange, the identities of the broker-dealers are not displayed.
• When two opposite orders match, the deal is automatically consummated by the ATS, and the two members are informed via the system. The clients (if applicable) are informed in turn by their broker-dealers.
• A broker-dealer, as noted, can deal in dual capacity, meaning that a single order can be split between principal and agent. For example, the buy example mentioned earlier can be 100 contracts as principal and 200 contracts as agent.
Because large deals (defined as for example over 500 contracts) may affect prices unduly, the rules of the exchange allow for off-ATS trading. These deals are negotiated between members and then reported on the ATS. However, most futures deals are done via the ATS.
.
Download free eBooks at bookboon.com
79
The above is the organisation of the South African futures market. In some futures markets, the open outcry floor method of trading is preferred. This is also an order driven trading system, which is highly transparent because the broker-dealers face each other in a “trading pit”, i.e. ensuring that clients’ orders (and broker-dealers’ own orders) are transacted at the best prices. An ATS may be seen as imitating the transparency of floor trading.
As regards delivery, in the futures markets delivery of the underlying asset usually does not take place.
This is discussed in the later section “cash settlement versus physical settlement”. However, unlike as in the case of forwards (the unsophisticated future) margin is required. This is discussed after the following section on clearing.
3.8 Clearing house
All deals are cleared through a clearing house that is usually separate from the exchange. The clearing house may be regarded as being responsible for the management of the market.
We noted earlier that as soon as a deal is struck, the exchange interposes itself between the two principals that concluded the deal. This means that it takes on the opposite side of each leg of each deal. Most exchanges are backed by a Fidelity and Guarantee funds.
3.9 Margining and marking to market
The exchange requires that for each transaction the client is obliged to place with it a “good faith deposit’, which is called the margin deposit. At the start of a deal this is called the initial margin, and this is set by the exchange (see contracts below). It is usually 5–8% of the value of the contract. The initial margin may be defined as a deposit required on futures deals that will ensure that the obligations under the contracts will be fulfilled.
The initial margin essentially protects the exchange from default because it is extremely unlikely that losses on positions will exceed the initial margin. At the end of each day the margin account is topped up, where required (i.e. in the case of losses). Each contact is marked to market every day, meaning that at a point in time each contract is “valued”. This takes place at the end of the trading day and it is based on the last settlement price.
The purpose of the marking to market is to ensure that the margin account is kept funded. If the mark to market price is lower that the purchase price, i.e. if the holder of a future is making a loss, she has to top up the margin account to the proportionate level it was. This amount is called the variation margin.
If a holder makes a profit, a credit to the margin account is made. The ultimate purpose is to ensure that the exchange, which has taken on the risk of guaranteeing the trades, is protected.
Download free eBooks at bookboon.com
80
From this it follows that if a holder of a future makes a loss and is unable to top up the margin account, the exchange will “close the member out”. This means that the exchange takes an offsetting contract. The loss in then deducted from the client’s margin account balance, and he is paid out.
3.10 Open interest
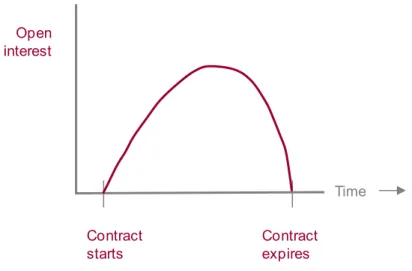
A term that often crops up in the futures market is “open interest”. This is the term for the number of outstanding contracts of a particular contract, i.e. the number of contracts that are still open and obligated to delivery (physical or cash settlement). Double counting is avoided in the number. If broker-dealer A takes a position in a future and B takes the opposite position, open interest is equal to 1. Open interest on a particular contract may be depicted as in Figure 5 (daily from start of contract to its expiry date).
interestOpen
Contract expires Contract
starts
Time
Figure 5: open interest
Figure 5: open interest
When a contract is launched by an exchange, open interest is zero. As participants begin to trade, open interest rises, and this continues until the maturity date approaches. On maturity date the future is
“closed out” and open interest is again zero (because the contract is replaced with another that has a new maturity date).
3.11 Cash settlement versus physical settlement
In many of the commodities markets physical settlement takes place. This means that the commodities that underlie futures contracts are delivered at expiry of the contract. In the financial futures markets, physical delivery also takes place in some cases (for example, certain of the bond contracts), but in the majority of cases settlement takes place in the form of cash settlement.
Download free eBooks at bookboon.com
Click on the ad to read more 81
Many traders in futures markets where delivery is required resort to trade reversing prior to expiry of the contract, and the reason for doing so is that they do not want to deliver or receive the physical goods/metals etc. These traders are involved in the market for speculative or hedging reasons, and take an opposite position to the one they hold prior to maturity, in so doing liquidate their position at the clearing house.
3.12 Payoff with futures (risk profile)
The gains and losses on futures are symmetrical around the difference between the spot price on expiry of the futures contract and the futures price at which the contract was purchased. A simple example may be useful (see Figure 6): one futures contract = one share of ABC Corporation Limited.
On the vertical axis we have the profit or loss scale of the future. On the horizontal axis we have the price of the future at expiry (= spot price). If the long future is bought at LCC70 and the price at expiry is LCC71, the profit is LCC1, i.e. for each LCC1 increase in the price of the future, the profit is LCC1.
Thus, if the spot price on maturity is LCC90, the profit is LCC20 (LCC90 – LCC70).
www.mastersopenday.nl Visit us and find out why we are the best!
Master’s Open Day: 22 February 2014
Join the best at
the Maastricht University School of Business and Economics!
Top master’s programmes
• 33rd place Financial Times worldwide ranking: MSc International Business
• 1st place: MSc International Business
• 1st place: MSc Financial Economics
• 2nd place: MSc Management of Learning
• 2nd place: MSc Economics
• 2nd place: MSc Econometrics and Operations Research
• 2nd place: MSc Global Supply Chain Management and Change
Sources: Keuzegids Master ranking 2013; Elsevier ‘Beste Studies’ ranking 2012;
Financial Times Global Masters in Management ranking 2012
Maastricht University is the best specialist
university in the Netherlands
(Elsevier)
Download free eBooks at bookboon.com
82
Profit on long futures contract
Loss on long futures contract
LCC 70 LCC
90 LCC
110 LCC 50
-LCC 20 +LCC 20 +LCC 40
-LCC 40
LCC 30 PP
SPM spot price on maturity (expiry) of contract
Figure 6: payoff with long futures contract (risk profile)
It will be apparent that if the spot price on maturity is SPm, and the purchase price is PP, then the payoff on a long position per one unit of the asset is:
SPm – PP.
It follows that the payoff in the case of a short future (see Figure 7) is:
PP – SPm.
It will also be clear that the payoff on a future is a total payoff because nothing was paid for the contract (remember: the margin is a deposit that earns interest and is repayable in full).
Download free eBooks at bookboon.com
83
Profit on short futures contract
Loss on short futures contract
LCC 70
LCC 90 LCC 110
LCC 50 -LCC 20
+LCC 20 +LCC 40
-LCC 40
LCC 30
PP SPMspot price on
maturity (expiry) of contract
Figure 7: payoff with short futures contract (risk profile)
3.13 Pricing of futures (fair value versus trading price)
The reader should at this stage already have a good idea of the principle involved in the pricing of futures contracts. Some elaboration, however, will be useful. All or some of the following factors influences the theoretical price of a future, which is also termed the fair value price (FVP):
• Current (or “spot”) price of the underlying asset.
• Financing (interest) costs involved.
• Cash flows (income) generated by the underlying asset.
• Other costs such as storage and transport costs and insurance.
The theoretical price / FVP of a future is determined according to the the cost-of-carry model (CCM): the FVP is equal to the spot price (SP) of the underlying asset, plus the cost-of-carry (CC) of the underlying asset to expiry of the contract. Thus:
FVP = SP + CC.
CC = {SP × [(rfr – I) × t]} + OC where:
rfr = risk free rate25 (i.e. the financing cost for the period) I = income earned during the period (dividends or interest) t = days to expiry (dte) of the contract / 365
OC = other costs (which apply in the case of commodities: usually transport, insurance and storage).
Download free eBooks at bookboon.com
Click on the ad to read more 84
Thus, in the case of financial futures:
FVP = SP + CC
= SP + {SP × [(rfr – I) × t]}
= SP × {1 + [(rfr – I) × t]}.
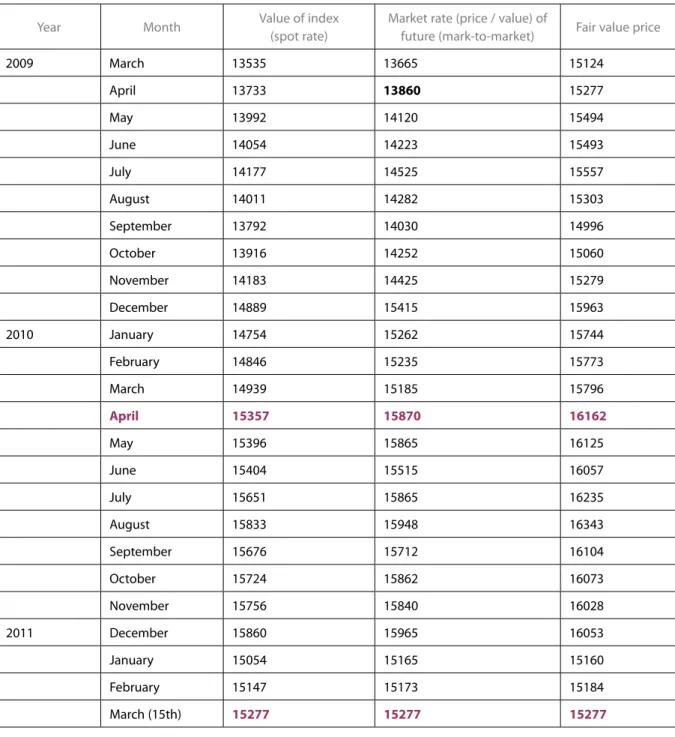
An example may be handy. The table and graph shown earlier (Table 1 and Figure 3) are expanded to include the fair value prices (FVPs) at the end of each month26 (see Table 3 and Figure 8). Taking April 2010 as an example, we have the following:
SP (index value) = 15357
rfr (assumed) = 8.0% pa
I (assumed dividend yield) = 2.0% pa
t = dte / 365 = 319 / 365
FVP = SP + CC
= SP + {SP × [(rfr – I) × t]}
= SP × {1 + [(rfr – I) × t]}
= 15357 × {1 + [(0.08 – 0.02) × (319 / 365)]}
= 15357 × [1 + (0.06 × 0.873973)]
= 15357 × 1.052438
= 16162.
- © Photononstop
> Apply now
redefine your future
AxA globAl grAduAte progrAm 2015
axa_ad_grad_prog_170x115.indd 1 19/12/13 16:36
Download free eBooks at bookboon.com
85
As can be seen from Table 3, the March 2011 future traded (15870) at lower than its FVP (16162).
Year Month Value of index
(spot rate)
Market rate (price / value) of
future (mark-to-market) Fair value price
2009 March 13535 13665 15124
April 13733 13860 15277
May 13992 14120 15494
June 14054 14223 15493
July 14177 14525 15557
August 14011 14282 15303
September 13792 14030 14996
October 13916 14252 15060
November 14183 14425 15279
December 14889 15415 15963
2010 January 14754 15262 15744
February 14846 15235 15773
March 14939 15185 15796
April 15357 15870 16162
May 15396 15865 16125
June 15404 15515 16057
July 15651 15865 16235
August 15833 15948 16343
September 15676 15712 16104
October 15724 15862 16073
November 15756 15840 16028
2011 December 15860 15965 16053
January 15054 15165 15160
February 15147 15173 15184
March (15th) 15277 15277 15277
Table 3: March 2011 all share index futures contract
Download free eBooks at bookboon.com
86
13500 14000 14500 15000 15500 16000 16500
09-Mar May Jul Sep Nov 10-Mar Mar May Jul Sep Nov 11-Mar Mar
Index
FVP: fair value price
FP: futures price (market price)
SP: spot price (index value)
Figure 8: March 2011 all share index (ALSI) future
It will be apparent that in the above use was made of simple interest. In the case of compound interest, the formula changes to:
FVP = SP × [1 + (rfr – I)]t Using the above example:
FVP = SP × [1 + (rfr – I)]t
= 15357 × 1.060.87397
= 15357 × 1.052244
= 16159.
It is clear that compounding makes little difference in the case of short-term contracts.
3.14 Fair value pricing of specific futures
3.14.1 Introduction
In the previous section we covered the basic principle (formula) for valuing futures. However, there are a number of variations on the theme, because there are different types of futures contract traded.
Download free eBooks at bookboon.com
87
The (valuation) mathematics pertaining to the different futures is illustrated with the following futures:
• Short-term interest rate futures.
• Individual bond futures.
• Equity / share index futures.
• Individual equity / share futures (aka single stock futures).
• Commodity futures.
• Currency futures.
• Futures on other derivatives.
• Other futures.
3.14.2 Short-term interest rate futures
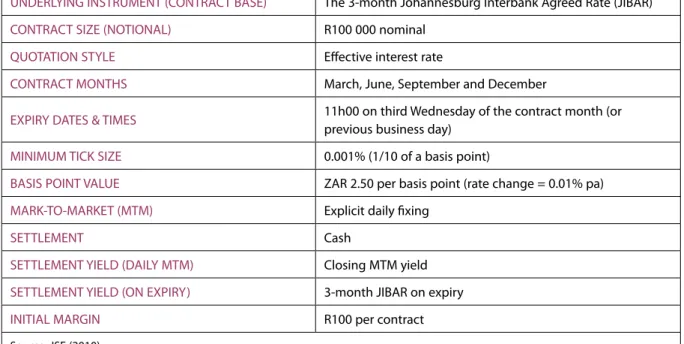
In the case of short-term interest rate futures, the theoretical price or fair value price (FVP) is determined from the calculated forward-forward rate (which is also called the implied forward rate). An example is required here: the South African 3-month JIBAR27 future, the specifications of which are shown in Table 4.
UNDERLYING INSTRUMENT (CONTRACT BASE) The 3-month Johannesburg Interbank Agreed Rate (JIBAR) CONTRACT SIZE (NOTIONAL) R100 000 nominal
QUOTATION STYLE Effective interest rate
CONTRACT MONTHS March, June, September and December
EXPIRY DATES & TIMES 11h00 on third Wednesday of the contract month (or previous business day)
MINIMUM TICK SIZE 0.001% (1/10 of a basis point)
BASIS POINT VALUE ZAR 2.50 per basis point (rate change = 0.01% pa) MARK-TO-MARKET (MTM) Explicit daily fixing
SETTLEMENT Cash
SETTLEMENT YIELD (DAILY MTM) Closing MTM yield SETTLEMENT YIELD (ON EXPIRY) 3-month JIBAR on expiry
INITIAL MARGIN R100 per contract
Source: JSE (2010).
Table 4: Specifications of the 3-month jibar future
A note on how the basis point value (ZAR 2.50 per basis point) is arrived at is required. A basis point = 0.01% per annum. Because there are four 3-month periods in a year, 3 months is taken to be 91.25 days (365 / 4). Therefore, if the 3-month JIBAR rate changes from 7.81% pa to 7.80% pa (i.e. by 1 basis point), the profit on a 91.25-day asset = (0.01 / 100) × (91.25 / 365) × ZAR 100 000 = ZAR 2.50.
Download free eBooks at bookboon.com
88
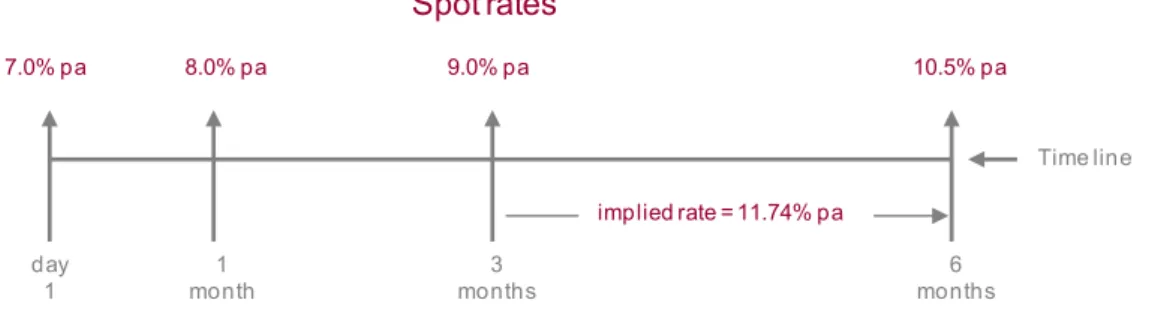
The theoretical price or fair value price (FVP) of a 3-month JIBAR future is arrived at by calculating the implied forward rate from the current spot rates. An example is required: shown in Figure 9 are the JIBAR rates quoted on the day a client wishes to buy a 3-month JIBAR futures contract (i.e. a 3-month rate in 3 months’ time).
day1 1
month 3
months 6
months
Time line implied rate = 11.74% pa
7.0% pa 8.0% pa 9.0% pa 10.5% pa
Spot rates
Figure 9: JIBAR spot rates and implied rate
Figure 9: JIBAR spot rates and implied rate
The rate now (spot rate) for three months is 9.0% pa and the rate now (spot rate) for six months is 10.5% pa, and the period of the latter rate covers the period of the first rate. The rate of interest for the three-month period beyond the first three-month period can be calculated by knowing the two spot rates mentioned. This is called the forward rate of interest, or the implied forward rate, or the forward-forward rate. This is calculated as follows (assumption 3-month period = 91 days; 6-month period = 182 days):
IFR = {[1 + (irL × tL)] / [1 + (irS × tS)] – 1} × [365 / (tL – tS)]
where
IFR = implied forward rate
irL = spot interest rate for 6-month (i.e. long) period irS = spot interest rate for 3-month (i.e. short) period
tL = 6-month (i.e. long) period, expressed as number of days / 365 (= 182 / 365) tS = 3-month (i.e. short) period, expressed as number of days / 365 (= 91 / 365) IFR = {[1 + (0.105 × 182/365)] / [1 + (0.09 × 91/365)] –1} × [365 / (182 – 91)]
= [(1.05235616 / 1.02243836) –1] × (365 / 91)
= 0.02926123 × 4.010989
= 0.11736647
= 11.736647% pa.
Download free eBooks at bookboon.com
89
This derived interest rate may be tested as follows: if R1 million (present value, PV) is placed on deposit for 6 months (182 days) at the abovementioned 6-month rate of 10.5% pa, the future value (FV6-m) amount would be:
FV6-m = PV × [1 + (0.105 × 182 / 365)]
= R1 000 000 × 1.05235616
= R1 052 356.16.
Alternatively, if an investment were made for 91 days, the following would be the total:
FV3-m = PV × [1 + (0.09 × 91 / 365)]
= R1 000 000 × 1.02243836
= R1 022 438.36.
If this amount (R1 022 438.36) is invested for another 91 days at the implied forward rate of 11.736647%, the FV6-m:
FV6-m = PV × [1 + (0.11736647 × 91 / 365)]
= R1 022 438.36 × 1.02926123
= R1 052 356.16.
As expected, this number is identical to the FV of the six-month investment calculated above.
As seen, the implied forward rate is 11.736647% pa. This is the fair value price / rate, i.e. the rate that should apply to the future.
Keep in mind that the fair value is not necessarily equal to the market value (= MTM value as determined by the exchange). It will also be apparent that the forward-forward pricing of futures is the same as the pricing of an FRA. An FRA can thus be seen as the OTC equivalent of the interest rate future. This calculation also applies to the forward-forward foreign exchange swap.
3.14.3 Individual bond futures28
The principle that underlies the fair value price of a bond future is the CCM as discussed. However, the calculation is more elaborate because of the existence of coupon payments, clean and dirty (all-in) prices, ex and cum interest and so on. The fair value price (FVP) of an individual bond future is made up of:
Bond spot price (i.e. all-in price) + carry cost (i.e. rfr) – income.
Download free eBooks at bookboon.com
Click on the ad to read more 90
An example is required: LCC15729 bond future:
Bond = LCC157
Maturity date = 15 September 2015
Coupon (c) =13.5% pa
Coupon payment dates (cd1 & cd2) =15 March and 15 September
Yield to maturity (ytm) = 8.2%
Carry cost (rfr) = 7.5% pa
Purchase (valuation) date of future (fvd) = 20 June Termination date of future (ftd) = 31 August30
Books (register) closes = one month before coupon dates31. As noted, the FVP of a bond future is made up of three parts:
FVP = A + B – C (i.e. bond spot price + carry cost (excl income) – income 32)
Download free eBooks at bookboon.com
91 where
A = dirty (all-in) price of underlying bond at market (current) rate on bond futures valuation date (fvd) 33
= 105.71077 (note: this price is assumed so that it does not date) B = A × {(rfr / 100) × [(ftd – fvd) / 365]}
= 105.71077 × [0.075 × (72 / 365)]
= 105.71077 × (0.075 × 0.19726)
= 105.71077 × 0.014795
= 1.56394
C = (c / 2) × (1 + {(rfr / 100) × [(ftd – cd2) / 365)]})
[if the futures termination date crosses a books-closed date and its associated coupon date (i.e. is not ex-interest)]
or
= (c / 2) / (1 + {(rfr / 100) × [(cd2 – ftd) / 365)])
[if the futures termination date crosses a books closed date but not the associated coupon date (i.e. is in ex-interest period, which is the case here)]
= (13.5 / 2) / (1 + {0.075 × [(cd2 – ftd) / 365]})
= 6.75 / {1 + [0.075 × (15 / 365)]}
= 6.75 / [1 + (0.075 × 0.04110)]
= 6.75 / 1.00308
= 6.72927.
Thus:
FVP = A + B – C
= 105.71077 + 1.56394 – 6.72927
= 100.5454. Figure 10: example of individual bond future
time line 72 days
Jun
Coupon date Coupon = 13.5%
Jul Oct
May
20 June
Nov Apr
Coupon date Coupon = 13.5%
15 Mar
15 Aug Register closes
ftd
fvd cd2
31 Aug
Sep Mar
15 Sep 15 days
Aug Feb
cd1
Figure 10: example of individual bond future
Download free eBooks at bookboon.com
92 3.14.4 Equity / share index futures
We covered the case of equity / share index futures in our first example where the simple interest net carry cost calculation was introduced:
FVP = SP + CC
= SP + {SP × [(rfr – I) × t]}
= SP × {1 + [(rfr – I) × t]}.
Here we provide another example (ALSI future):
SP (spot price, i.e. index value) = 10765
rfr = 11.5% pa
I (dividend yield, assumed) = 3.5% pa
t (number of days to expiry of contract / 365) 245 / 365 FVP = SP + CC)
= SP + {SP × [(rfr – I) × t]}
= SP × {1 + [(rfr – I) × t]}
= 10765 × {1 + [(0.115 – 0.035) × (245 / 365)]}
= 10765 × (1 + (0.08 × 0.6712329))
= 10765 × 1.05369863
= 11343.
3.14.5 Individual equity / share futures
Individual equity / share futures are also called single stock futures (in short SSFs). Calculation of the FVP of SSFs is the same as above – i.e. as for equity / share index futures, except that the dividend yield will be easier to predict.
It is appropriate to mention a futures product which is closely allied with SSFs: the dividend future (DIVF).
They are used to hedge against the dividend risk that accompanies a position in a SSF. As we have seen, dividend expectations (I) are part of the FVP calculation; therefore there is a need for such contracts.
Download free eBooks at bookboon.com
93 3.14.6 Commodity futures
With commodities, where insurance and storage is payable (such as maize), and the amount is not proportional to the spot price, it is simply added to the FVP. An example follows [we assume there are only storage costs (SC); note: there is no income (I)]:
Contract = WMAZ (white maize)
Contract size = 100 metric tons Number of contracts = 1
Date of valuation = 31 March Expiry of contract = 21 September
Days to expiry (dte) = 174 days (31 March to 21 September) t = dte / 365 = 174 / 365
rfr = 7.5% pa
SP = LCC2 732.20 (per metric ton)
Storage costs (SC) = 36 cents per ton per day FVP (per ton) = SP + CC
= SP + [SP × (rfr × t)] + (SC × dte)
= SP × [1 + (rfr × t)] + (SC × dte)
= 2732.20 × [1 + (0.075 × 174 / 365)] + (0.36 × 174)
= 2732.20 × 1.03575 + 62.64
= 2829.88 + 62.64
= LCC2 892.52
FVP (per contract) = 100 × 2892.52
= LCC289 252.00.
3.14.7 Currency futures
Currency futures are similar to foreign exchange forward contracts, and the covered interest parity formula (a variation of the CCM) is therefore applicable:
FVP = SR × {[1 + (irvc × t)] / [1 + (irbc × t)]}
where:
SR = spot rate
irvc = interest rate of variable currency for period to expiry irbc = interest rate for base currency for period to expiry t = number of days to expiry of contract / 365.
Download free eBooks at bookboon.com
Click on the ad to read more 94
An example is called for [base currency (i.e. the 1 unit currency) = GBP; variable currency = USD]:
SR = GBP / USD 1.5 irvc = 5.5%
irbc = 8.5% pa t = 182 / 365
FVP = SR × {[1 + (irvc × t)] / [1 + (irbc × t)]}
= USD 1.5 × {[1 + (0.055 × 182 / 365)] / [1 + (0.085 × 182 / 365)]} = USD 1.5 × (1.027425 / 1.042384)
= USD 1.5 × 0.985649
= USD 1.47847.
It will be evident here that the formula is similar to the CCM, with the difference being that there are two rates of interest taken into account: the foreign rate and the local rate.
3.14.8 Futures on other derivatives
As in the case of forwards (forwards on swaps) there are futures on other derivatives, for example futures on FRAs and futures on swaps.
Get Help Now
Go to www.helpmyassignment.co.uk for more info
Need help with your dissertation?
Get in-depth feedback & advice from experts in your topic area. Find out what you can do to improve the quality of your dissertation!
Download free eBooks at bookboon.com
95 3.14.9 Other futures
Another future listed on the JSE deserves mention: the variance future (VARF). Variance is a statistical measure of volatility (= risk). The generally accepted measure of risk in the Finance discipline is the standard deviation of an asset’s return (= the extent of deviation from the mean return). Standard deviation is closely related to variance; it is the square root of variance.
The variances and standard deviations of returns on assets (like shares) change considerably from period to period. It is also a major input in the pricing of options. There is a need by some investors to hedge against this risk, and certain speculators seek exposure to this risk. These two parties make the trading of this instrument a possibility.
In short, a variance future is a futures contract on realised annualised variance of returns on assets / indices. This instrument is regarded by some as a new asset class.
3.15 Basis
Participants in the futures market frequently use the terminology “basis” (B), “cost of carry” (CC) and
“convergence”. As regards the latter: as time in the life of a futures contract goes by, the futures price (FP) and the fair value price of the future (FVP) converge on the spot price (SP), and they are equal on the expiry date of the future, as indicated in Figure 11.
13500 14000 14500 15000 15500 16000 16500
09-Mar May Jul Sep Nov 10-Mar Mar May Jul Sep Nov 11-Mar Mar
Index
Figure 11: basis, carry cost & convergence
FP: futures price (market price)
SP: spot price (index value) FVP: fair value price
CC: cost of carry
B: basis
Converged at expiry of contract
Figure 11: basis, carry cost & convergence
It will be evident from the discussion above on the CCM, which gave us FVP = SP + CC,
Download free eBooks at bookboon.com
96
that cost of carry (CC) is the difference between the fair value price (FVP) and the spot price (SP) of the underlying asset as follows:
CC = FVP – SP.
Basis (B), on the other hand, is the difference between the SP and the FP of the underlying asset:
B = SP – FP.
The above concepts are illustrated as in Figure 11. It will be apparent that the FVP is higher than the SP when the CC is positive (i.e. when rfr > I on the underlying asset). However, when I > rfr, i.e. CC is negative, FVP < SP. When CC is negative, B is positive.
What is the significance of basis? It is that the basis is a known number when a hedge is undertaken (buy the underlying and sell the future or sell the underlying and buy the future). If the basis changes during the life of the hedge (which is likely), risk (called basis risk) emerges, and the hedge will not be a perfect one, i.e. if the basis strengthens or weakens, the outcome of the hedge will be different from that hoped for or expected.
3.16 Participants in the futures market
3.16.1 Introduction
membersNon-
Deal for own account MEMBERS OF EXCHANGE
Non-clearing members
Broking
members Non-broking members Deal for clients
Settle all trades with their clearing
member Clearing
members
Figure 12: participants in the futures market
INVESTORS / HEDGERS / ARBITRAGEURS / SPECULATORS
Figure 12: participants in the futures market
Download free eBooks at bookboon.com
Click on the ad to read more 97
The participants in the futures market can be categorised in a number of ways. One can, for example, categorise participants according to membership of the exchange (all futures markets are formalised):
• Futures exchange members:
- clearing members (clear for self, own clients and all other members) - non-clearing members (all other members)
- broking members (deal for own account and/or for clients) - non-broking members (deal for own account).
• Non-members (the clients of members):
- foreign sector
- household sector (individuals) - corporate sector
- financial intermediaries (banks, insurers, retirement funds, CISs, etc.).
However, the most logical categorisation is according to functionality as follows:
• Investors.
• Arbitrageurs.
• Hedgers.
• Speculators.
By 2020, wind could provide one-tenth of our planet’s electricity needs. Already today, SKF’s innovative know- how is crucial to running a large proportion of the world’s wind turbines.
Up to 25 % of the generating costs relate to mainte- nance. These can be reduced dramatically thanks to our systems for on-line condition monitoring and automatic lubrication. We help make it more economical to create cleaner, cheaper energy out of thin air.
By sharing our experience, expertise, and creativity, industries can boost performance beyond expectations.
Therefore we need the best employees who can meet this challenge!
The Power of Knowledge Engineering
Brain power
Plug into The Power of Knowledge Engineering.
Visit us at www.skf.com/knowledge
Download free eBooks at bookboon.com
98
These participants are found in both the categories non-members and members of the exchange, meaning that some members themselves are engaged in investing, arbitrage, hedging and speculation.
All the participants in the futures market may be depicted as in Figure 12. We examine each of these categories briefly.
3.16.2 Investors
Investors in the futures market are those that view the futures market as an alternative to the cash market (i.e. the underlying market). For example, an investor may wish to earn the All Share Index (ALSI) and, instead of buying the shares in the proportions that make up the index, can achieve this by buying the appropriate number of ALSI futures contracts. She may do this for the sake of convenience, to avoid transactions costs (depending on the fair value price) or she may view the underlying market as lacking in liquidity.
An investor may also use long-term instruments and short futures contracts to invest short-term, or use short-term financial instruments and long futures contracts to invest long term.34 These positions are alternatives to straightforward investing for the desired investment horizon (see Table 5).
Investment term desired
Cash market alternative
Use of futures market alternative What is known? Comparison
3 months (March to June)
Buy 3-month treasury bill (in March; maturity June)
• Buy government bond with 10-year maturity
• Sell (go short of) a 10-year government bond futures contract with June maturity
• Buy rate
• Sell rate locked in
Compare computed rate with 3-month treasury bill rate
10 years (it is now March)
Buy 10-year government bond (in March)
• Buy (go long of) a 10-year government bond futures contract with June maturity
• Invest funds in 3-month treasury bill (March–June)
• Buy rate locked in
• 3-month rate locked in
Table 5: Use of futures to manage investment horizon
3.16.3 Arbitrageurs
Arbitrageurs endeavour to profit from price differentials (mispricing) that may exist in different markets on similar securities. For example, if the industrial index (let us assume it is called INDI) futures price is trading far in excess of its fair value price, the arbitrageur may sell the INDI future and buy the individual equities that make up the INDI.
Arbitrageurs play a significant role in the futures market by ensuring that futures prices do not stray too far from fair value prices and by adding to the liquidity of the market.
Download free eBooks at bookboon.com
99 3.16.4 Hedgers
Hedgers are those participants that have exposures in cash markets and wish to reduce risk by taking the opposite positions in the futures markets. Most investors, such as retirement funds, life offices and banks hedge their portfolios from time to time in the financial futures market. The equivalents in the commodity futures markets are the producers (e.g. farmers) and consumers (e.g. millers of flour) of commodities.
The opposite parties to hedgers are usually the speculators that willingly take on risk in order to profit from their views in respect of the future movement of prices / rates. Thus, hedgers transfer risk to speculators and speculators willingly seek risk positions (accept the risk being shed).
3.16.5 Speculators
Speculators are those participants that endeavour to gain from price movements in the futures market.
Given the small outlay (i.e. the margin) in comparison with cash markets (where the full price is paid), speculators are attracted to futures markets because they are able to “gear up”.
For example, if a speculator has LCC1 million with which to speculate, she is able to buy shares to the value of LCC1 million in the cash market. In the futures market she is able to get exposure (and risk) to the extent of the amount on hand times the reciprocal of the margin requirement. Thus, if the margin requirement is 8% of the value of the future/s, she is able to go long of futures by 12.5 (1 / 0.08) times LCC1 million.35
Speculators and hedgers play a significant role in the futures market in terms of enhancing the liquidity of this market. It should be apparent that hedgers endeavour to eliminate or reduce risk faced from holding inventories of financial instruments or commodities, while speculators assume the risk. Thus, speculators willingly take on the risks transferred to them by hedgers. <